Free Statistics

of Irreproducible Research!

Author's title

Author*The author of this computation has been verified*
R Software Modulerwasp_correlation.wasp
Title produced by softwarePearson Correlation
Date of computationWed, 21 Dec 2011 12:54:48 -0500
Cite this page as followsStatistical Computations at FreeStatistics.org, Office for Research Development and Education, URL https://freestatistics.org/blog/index.php?v=date/2011/Dec/21/t132449010118okpzabjryx7bl.htm/, Retrieved Tue, 07 May 2024 12:20:48 +0000
Statistical Computations at FreeStatistics.org, Office for Research Development and Education, URL https://freestatistics.org/blog/index.php?pk=158913, Retrieved Tue, 07 May 2024 12:20:48 +0000
QR Codes:

Original text written by user:
IsPrivate?No (this computation is public)
User-defined keywords
Estimated Impact61
Family? (F = Feedback message, R = changed R code, M = changed R Module, P = changed Parameters, D = changed Data)
-     [Pearson Correlation] [Connected vs Sepa...] [2010-10-04 07:35:56] [b98453cac15ba1066b407e146608df68]
- R  D    [Pearson Correlation] [vcxcvcvb] [2011-12-21 17:54:48] [583fc5a74bfa894f261a865501f20e1c] [Current]
-           [Pearson Correlation] [,n,nbn,,n] [2011-12-21 17:57:38] [a9671b130b33f9fcb98554992ce4582f]
Feedback Forum

Post a new message
Dataseries X:
119.880
131.468
155.089
149.581
122.788
143.900
112.115
109.600
117.446
118.456
101.901
89.940
129.143
126.102
143.048
142.258
131.011
146.471
114.073
114.642
118.226
111.338
108.701
80.512
146.865
137.179
166.536
137.070
127.090
139.966
122.243
109.097
116.591
111.964
109.754
77.609
138.445
127.901
156.615
133.264
143.521
152.139
131.523
113.925
86.495
127.877
107.017
78.716
138.278
144.238
143.679
159.932
136.781
148.173
125.673
105.573
122.405
128.045
94.467
85.573
Dataseries Y:
5124
4742
5434
5684
6332
6334
5636
5940
6195
6022
4535
4320
4872
4662
4663
5491
6018
6393
5610
5777
6094
6478
5216
5201
4784
4205
4681
4896
5752
6452
5995
5601
6119
6569
5798
5492
5018
4773
5502
5908
5902
6125
5419
5559
5962
6023
5346
5379
4859
5156
5010
5508
6426
6043
5499
5191
5790
5949
5219
4729


Summary of computational transaction
Raw Inputview raw input (R code)
Raw Outputview raw output of R engine
Computing time0 seconds
R Server'Herman Ole Andreas Wold' @ wold.wessa.net

\begin{tabular}{lllllllll}
\hline
Summary of computational transaction \tabularnewline
Raw Input & view raw input (R code)  \tabularnewline
Raw Output & view raw output of R engine  \tabularnewline
Computing time & 0 seconds \tabularnewline
R Server & 'Herman Ole Andreas Wold' @ wold.wessa.net \tabularnewline
\hline
\end{tabular}
%Source: https://freestatistics.org/blog/index.php?pk=158913&T=0

[TABLE]
[ROW][C]Summary of computational transaction[/C][/ROW]
[ROW][C]Raw Input[/C][C]view raw input (R code) [/C][/ROW]
[ROW][C]Raw Output[/C][C]view raw output of R engine [/C][/ROW]
[ROW][C]Computing time[/C][C]0 seconds[/C][/ROW]
[ROW][C]R Server[/C][C]'Herman Ole Andreas Wold' @ wold.wessa.net[/C][/ROW]
[/TABLE]
Source: https://freestatistics.org/blog/index.php?pk=158913&T=0

Globally Unique Identifier (entire table): ba.freestatistics.org/blog/index.php?pk=158913&T=0

As an alternative you can also use a QR Code:  

The GUIDs for individual cells are displayed in the table below:

Summary of computational transaction
Raw Inputview raw input (R code)
Raw Outputview raw output of R engine
Computing time0 seconds
R Server'Herman Ole Andreas Wold' @ wold.wessa.net


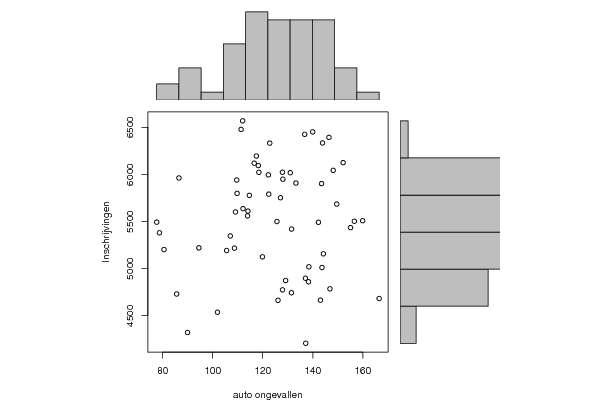
Pearson Product Moment Correlation - Ungrouped Data
StatisticVariable XVariable Y
Mean124.4984666666675523.53333333333
Biased Variance431.150155815556348124.748888889
Biased Standard Deviation20.7641555526719590.020973261874
Covariance536.198882485876
Correlation0.0430372925639619
Determination0.00185220855123605
T-Test0.328066219603053
p-value (2 sided)0.744042998118559
p-value (1 sided)0.372021499059279
Degrees of Freedom58
Number of Observations60

\begin{tabular}{lllllllll}
\hline
Pearson Product Moment Correlation - Ungrouped Data \tabularnewline
Statistic & Variable X & Variable Y \tabularnewline
Mean & 124.498466666667 & 5523.53333333333 \tabularnewline
Biased Variance & 431.150155815556 & 348124.748888889 \tabularnewline
Biased Standard Deviation & 20.7641555526719 & 590.020973261874 \tabularnewline
Covariance & 536.198882485876 \tabularnewline
Correlation & 0.0430372925639619 \tabularnewline
Determination & 0.00185220855123605 \tabularnewline
T-Test & 0.328066219603053 \tabularnewline
p-value (2 sided) & 0.744042998118559 \tabularnewline
p-value (1 sided) & 0.372021499059279 \tabularnewline
Degrees of Freedom & 58 \tabularnewline
Number of Observations & 60 \tabularnewline
\hline
\end{tabular}
%Source: https://freestatistics.org/blog/index.php?pk=158913&T=1

[TABLE]
[ROW][C]Pearson Product Moment Correlation - Ungrouped Data[/C][/ROW]
[ROW][C]Statistic[/C][C]Variable X[/C][C]Variable Y[/C][/ROW]
[ROW][C]Mean[/C][C]124.498466666667[/C][C]5523.53333333333[/C][/ROW]
[ROW][C]Biased Variance[/C][C]431.150155815556[/C][C]348124.748888889[/C][/ROW]
[ROW][C]Biased Standard Deviation[/C][C]20.7641555526719[/C][C]590.020973261874[/C][/ROW]
[ROW][C]Covariance[/C][C]536.198882485876[/C][/ROW]
[ROW][C]Correlation[/C][C]0.0430372925639619[/C][/ROW]
[ROW][C]Determination[/C][C]0.00185220855123605[/C][/ROW]
[ROW][C]T-Test[/C][C]0.328066219603053[/C][/ROW]
[ROW][C]p-value (2 sided)[/C][C]0.744042998118559[/C][/ROW]
[ROW][C]p-value (1 sided)[/C][C]0.372021499059279[/C][/ROW]
[ROW][C]Degrees of Freedom[/C][C]58[/C][/ROW]
[ROW][C]Number of Observations[/C][C]60[/C][/ROW]
[/TABLE]
Source: https://freestatistics.org/blog/index.php?pk=158913&T=1

Globally Unique Identifier (entire table): ba.freestatistics.org/blog/index.php?pk=158913&T=1

As an alternative you can also use a QR Code:  

The GUIDs for individual cells are displayed in the table below:

Pearson Product Moment Correlation - Ungrouped Data
StatisticVariable XVariable Y
Mean124.4984666666675523.53333333333
Biased Variance431.150155815556348124.748888889
Biased Standard Deviation20.7641555526719590.020973261874
Covariance536.198882485876
Correlation0.0430372925639619
Determination0.00185220855123605
T-Test0.328066219603053
p-value (2 sided)0.744042998118559
p-value (1 sided)0.372021499059279
Degrees of Freedom58
Number of Observations60


Parameters (Session):
Parameters (R input):
R code (references can be found in the software module):
bitmap(file='test1.png')
histx <- hist(x, plot=FALSE)
histy <- hist(y, plot=FALSE)
maxcounts <- max(c(histx$counts, histx$counts))
xrange <- c(min(x),max(x))
yrange <- c(min(y),max(y))
nf <- layout(matrix(c(2,0,1,3),2,2,byrow=TRUE), c(3,1), c(1,3), TRUE)
par(mar=c(4,4,1,1))
plot(x, y, xlim=xrange, ylim=yrange, xlab=xlab, ylab=ylab)
par(mar=c(0,4,1,1))
barplot(histx$counts, axes=FALSE, ylim=c(0, maxcounts), space=0)
par(mar=c(4,0,1,1))
barplot(histy$counts, axes=FALSE, xlim=c(0, maxcounts), space=0, horiz=TRUE)
dev.off()
lx = length(x)
makebiased = (lx-1)/lx
varx = var(x)*makebiased
vary = var(y)*makebiased
corxy <- cor.test(x,y,method='pearson')
cxy <- as.matrix(corxy$estimate)[1,1]
load(file='createtable')
a<-table.start()
a<-table.row.start(a)
a<-table.element(a,'Pearson Product Moment Correlation - Ungrouped Data',3,TRUE)
a<-table.row.end(a)
a<-table.row.start(a)
a<-table.element(a,'Statistic',1,TRUE)
a<-table.element(a,'Variable X',1,TRUE)
a<-table.element(a,'Variable Y',1,TRUE)
a<-table.row.end(a)
a<-table.row.start(a)
a<-table.element(a,hyperlink('arithmetic_mean.htm','Mean',''),header=TRUE)
a<-table.element(a,mean(x))
a<-table.element(a,mean(y))
a<-table.row.end(a)
a<-table.row.start(a)
a<-table.element(a,hyperlink('biased.htm','Biased Variance',''),header=TRUE)
a<-table.element(a,varx)
a<-table.element(a,vary)
a<-table.row.end(a)
a<-table.row.start(a)
a<-table.element(a,hyperlink('biased1.htm','Biased Standard Deviation',''),header=TRUE)
a<-table.element(a,sqrt(varx))
a<-table.element(a,sqrt(vary))
a<-table.row.end(a)
a<-table.row.start(a)
a<-table.element(a,hyperlink('covariance.htm','Covariance',''),header=TRUE)
a<-table.element(a,cov(x,y),2)
a<-table.row.end(a)
a<-table.row.start(a)
a<-table.element(a,hyperlink('pearson_correlation.htm','Correlation',''),header=TRUE)
a<-table.element(a,cxy,2)
a<-table.row.end(a)
a<-table.row.start(a)
a<-table.element(a,hyperlink('coeff_of_determination.htm','Determination',''),header=TRUE)
a<-table.element(a,cxy*cxy,2)
a<-table.row.end(a)
a<-table.row.start(a)
a<-table.element(a,hyperlink('ttest_statistic.htm','T-Test',''),header=TRUE)
a<-table.element(a,as.matrix(corxy$statistic)[1,1],2)
a<-table.row.end(a)
a<-table.row.start(a)
a<-table.element(a,'p-value (2 sided)',header=TRUE)
a<-table.element(a,(p2 <- as.matrix(corxy$p.value)[1,1]),2)
a<-table.row.end(a)
a<-table.row.start(a)
a<-table.element(a,'p-value (1 sided)',header=TRUE)
a<-table.element(a,p2/2,2)
a<-table.row.end(a)
a<-table.row.start(a)
a<-table.element(a,'Degrees of Freedom',header=TRUE)
a<-table.element(a,lx-2,2)
a<-table.row.end(a)
a<-table.row.start(a)
a<-table.element(a,'Number of Observations',header=TRUE)
a<-table.element(a,lx,2)
a<-table.row.end(a)
a<-table.end(a)
table.save(a,file='mytable.tab')