Free Statistics

of Irreproducible Research!

Author's title

Author*The author of this computation has been verified*
R Software Modulerwasp_multipleregression.wasp
Title produced by softwareMultiple Regression
Date of computationWed, 21 Dec 2011 07:26:41 -0500
Cite this page as followsStatistical Computations at FreeStatistics.org, Office for Research Development and Education, URL https://freestatistics.org/blog/index.php?v=date/2011/Dec/21/t1324470435f59bedxsvg4jp7t.htm/, Retrieved Tue, 07 May 2024 18:51:47 +0000
Statistical Computations at FreeStatistics.org, Office for Research Development and Education, URL https://freestatistics.org/blog/index.php?pk=158588, Retrieved Tue, 07 May 2024 18:51:47 +0000
QR Codes:

Original text written by user:
IsPrivate?No (this computation is public)
User-defined keywords
Estimated Impact63
Family? (F = Feedback message, R = changed R code, M = changed R Module, P = changed Parameters, D = changed Data)
-       [Multiple Regression] [Multiple regressi...] [2011-12-21 12:26:41] [2fa2d22b72a9c62ab85a23406d5dc0a0] [Current]
Feedback Forum

Post a new message
Dataseries X:
9911
8915
9452
9112
8472
8230
8384
8625
8221
8649
8625
10443
10357
8586
8892
8329
8101
7922
8120
7838
7735
8406
8209
9451
10041
9411
10405
8467
8464
8102
7627
7513
7510
8291
8064
9383
9706
8579
9474
8318
8213
8059
9111
7708
7680
8014
8007
8718
9486
9113
9025
8476
7952
7759
7835
7600
7651
8319
8812
8630


Summary of computational transaction
Raw Inputview raw input (R code)
Raw Outputview raw output of R engine
Computing time5 seconds
R Server'Gwilym Jenkins' @ jenkins.wessa.net

\begin{tabular}{lllllllll}
\hline
Summary of computational transaction \tabularnewline
Raw Input & view raw input (R code)  \tabularnewline
Raw Output & view raw output of R engine  \tabularnewline
Computing time & 5 seconds \tabularnewline
R Server & 'Gwilym Jenkins' @ jenkins.wessa.net \tabularnewline
\hline
\end{tabular}
%Source: https://freestatistics.org/blog/index.php?pk=158588&T=0

[TABLE]
[ROW][C]Summary of computational transaction[/C][/ROW]
[ROW][C]Raw Input[/C][C]view raw input (R code) [/C][/ROW]
[ROW][C]Raw Output[/C][C]view raw output of R engine [/C][/ROW]
[ROW][C]Computing time[/C][C]5 seconds[/C][/ROW]
[ROW][C]R Server[/C][C]'Gwilym Jenkins' @ jenkins.wessa.net[/C][/ROW]
[/TABLE]
Source: https://freestatistics.org/blog/index.php?pk=158588&T=0

Globally Unique Identifier (entire table): ba.freestatistics.org/blog/index.php?pk=158588&T=0

As an alternative you can also use a QR Code:  

The GUIDs for individual cells are displayed in the table below:

Summary of computational transaction
Raw Inputview raw input (R code)
Raw Outputview raw output of R engine
Computing time5 seconds
R Server'Gwilym Jenkins' @ jenkins.wessa.net


Multiple Linear Regression - Estimated Regression Equation
Sterftegevallen[t] = + 9653.025 + 474.970138888892M1[t] -495.318055555556M2[t] + 42.5937499999992M3[t] -857.494444444445M4[t] -1148.38263888889M5[t] -1365.27083333333M6[t] -1155.15902777778M7[t] -1504.64722222222M8[t] -1592.93541666667M9[t] -1007.42361111111M10[t] -990.711805555556M11[t] -9.11180555555558t + e[t]

\begin{tabular}{lllllllll}
\hline
Multiple Linear Regression - Estimated Regression Equation \tabularnewline
Sterftegevallen[t] =  +  9653.025 +  474.970138888892M1[t] -495.318055555556M2[t] +  42.5937499999992M3[t] -857.494444444445M4[t] -1148.38263888889M5[t] -1365.27083333333M6[t] -1155.15902777778M7[t] -1504.64722222222M8[t] -1592.93541666667M9[t] -1007.42361111111M10[t] -990.711805555556M11[t] -9.11180555555558t  + e[t] \tabularnewline
\hline
\end{tabular}
%Source: https://freestatistics.org/blog/index.php?pk=158588&T=1

[TABLE]
[ROW][C]Multiple Linear Regression - Estimated Regression Equation[/C][/ROW]
[ROW][C]Sterftegevallen[t] =  +  9653.025 +  474.970138888892M1[t] -495.318055555556M2[t] +  42.5937499999992M3[t] -857.494444444445M4[t] -1148.38263888889M5[t] -1365.27083333333M6[t] -1155.15902777778M7[t] -1504.64722222222M8[t] -1592.93541666667M9[t] -1007.42361111111M10[t] -990.711805555556M11[t] -9.11180555555558t  + e[t][/C][/ROW]
[/TABLE]
Source: https://freestatistics.org/blog/index.php?pk=158588&T=1

Globally Unique Identifier (entire table): ba.freestatistics.org/blog/index.php?pk=158588&T=1

As an alternative you can also use a QR Code:  

The GUIDs for individual cells are displayed in the table below:

Multiple Linear Regression - Estimated Regression Equation
Sterftegevallen[t] = + 9653.025 + 474.970138888892M1[t] -495.318055555556M2[t] + 42.5937499999992M3[t] -857.494444444445M4[t] -1148.38263888889M5[t] -1365.27083333333M6[t] -1155.15902777778M7[t] -1504.64722222222M8[t] -1592.93541666667M9[t] -1007.42361111111M10[t] -990.711805555556M11[t] -9.11180555555558t + e[t]


Multiple Linear Regression - Ordinary Least Squares
VariableParameterS.D.T-STATH0: parameter = 02-tail p-value1-tail p-value
(Intercept)9653.025201.51367647.902600
M1474.970138888892245.1526641.93740.0587130.029357
M2-495.318055555556244.786387-2.02350.0487320.024366
M342.5937499999992244.454520.17420.8624250.431213
M4-857.494444444445244.157205-3.51210.0009940.000497
M5-1148.38263888889243.894567-4.70852.2e-051.1e-05
M6-1365.27083333333243.666718-5.6031e-061e-06
M7-1155.15902777778243.473756-4.74452e-051e-05
M8-1504.64722222222243.315765-6.183900
M9-1592.93541666667243.192811-6.550100
M10-1007.42361111111243.104949-4.1440.0001417.1e-05
M11-990.711805555556243.052217-4.07610.0001758.8e-05
t-9.111805555555582.923252-3.1170.0031140.001557

\begin{tabular}{lllllllll}
\hline
Multiple Linear Regression - Ordinary Least Squares \tabularnewline
Variable & Parameter & S.D. & T-STATH0: parameter = 0 & 2-tail p-value & 1-tail p-value \tabularnewline
(Intercept) & 9653.025 & 201.513676 & 47.9026 & 0 & 0 \tabularnewline
M1 & 474.970138888892 & 245.152664 & 1.9374 & 0.058713 & 0.029357 \tabularnewline
M2 & -495.318055555556 & 244.786387 & -2.0235 & 0.048732 & 0.024366 \tabularnewline
M3 & 42.5937499999992 & 244.45452 & 0.1742 & 0.862425 & 0.431213 \tabularnewline
M4 & -857.494444444445 & 244.157205 & -3.5121 & 0.000994 & 0.000497 \tabularnewline
M5 & -1148.38263888889 & 243.894567 & -4.7085 & 2.2e-05 & 1.1e-05 \tabularnewline
M6 & -1365.27083333333 & 243.666718 & -5.603 & 1e-06 & 1e-06 \tabularnewline
M7 & -1155.15902777778 & 243.473756 & -4.7445 & 2e-05 & 1e-05 \tabularnewline
M8 & -1504.64722222222 & 243.315765 & -6.1839 & 0 & 0 \tabularnewline
M9 & -1592.93541666667 & 243.192811 & -6.5501 & 0 & 0 \tabularnewline
M10 & -1007.42361111111 & 243.104949 & -4.144 & 0.000141 & 7.1e-05 \tabularnewline
M11 & -990.711805555556 & 243.052217 & -4.0761 & 0.000175 & 8.8e-05 \tabularnewline
t & -9.11180555555558 & 2.923252 & -3.117 & 0.003114 & 0.001557 \tabularnewline
\hline
\end{tabular}
%Source: https://freestatistics.org/blog/index.php?pk=158588&T=2

[TABLE]
[ROW][C]Multiple Linear Regression - Ordinary Least Squares[/C][/ROW]
[ROW][C]Variable[/C][C]Parameter[/C][C]S.D.[/C][C]T-STATH0: parameter = 0[/C][C]2-tail p-value[/C][C]1-tail p-value[/C][/ROW]
[ROW][C](Intercept)[/C][C]9653.025[/C][C]201.513676[/C][C]47.9026[/C][C]0[/C][C]0[/C][/ROW]
[ROW][C]M1[/C][C]474.970138888892[/C][C]245.152664[/C][C]1.9374[/C][C]0.058713[/C][C]0.029357[/C][/ROW]
[ROW][C]M2[/C][C]-495.318055555556[/C][C]244.786387[/C][C]-2.0235[/C][C]0.048732[/C][C]0.024366[/C][/ROW]
[ROW][C]M3[/C][C]42.5937499999992[/C][C]244.45452[/C][C]0.1742[/C][C]0.862425[/C][C]0.431213[/C][/ROW]
[ROW][C]M4[/C][C]-857.494444444445[/C][C]244.157205[/C][C]-3.5121[/C][C]0.000994[/C][C]0.000497[/C][/ROW]
[ROW][C]M5[/C][C]-1148.38263888889[/C][C]243.894567[/C][C]-4.7085[/C][C]2.2e-05[/C][C]1.1e-05[/C][/ROW]
[ROW][C]M6[/C][C]-1365.27083333333[/C][C]243.666718[/C][C]-5.603[/C][C]1e-06[/C][C]1e-06[/C][/ROW]
[ROW][C]M7[/C][C]-1155.15902777778[/C][C]243.473756[/C][C]-4.7445[/C][C]2e-05[/C][C]1e-05[/C][/ROW]
[ROW][C]M8[/C][C]-1504.64722222222[/C][C]243.315765[/C][C]-6.1839[/C][C]0[/C][C]0[/C][/ROW]
[ROW][C]M9[/C][C]-1592.93541666667[/C][C]243.192811[/C][C]-6.5501[/C][C]0[/C][C]0[/C][/ROW]
[ROW][C]M10[/C][C]-1007.42361111111[/C][C]243.104949[/C][C]-4.144[/C][C]0.000141[/C][C]7.1e-05[/C][/ROW]
[ROW][C]M11[/C][C]-990.711805555556[/C][C]243.052217[/C][C]-4.0761[/C][C]0.000175[/C][C]8.8e-05[/C][/ROW]
[ROW][C]t[/C][C]-9.11180555555558[/C][C]2.923252[/C][C]-3.117[/C][C]0.003114[/C][C]0.001557[/C][/ROW]
[/TABLE]
Source: https://freestatistics.org/blog/index.php?pk=158588&T=2

Globally Unique Identifier (entire table): ba.freestatistics.org/blog/index.php?pk=158588&T=2

As an alternative you can also use a QR Code:  

The GUIDs for individual cells are displayed in the table below:

Multiple Linear Regression - Ordinary Least Squares
VariableParameterS.D.T-STATH0: parameter = 02-tail p-value1-tail p-value
(Intercept)9653.025201.51367647.902600
M1474.970138888892245.1526641.93740.0587130.029357
M2-495.318055555556244.786387-2.02350.0487320.024366
M342.5937499999992244.454520.17420.8624250.431213
M4-857.494444444445244.157205-3.51210.0009940.000497
M5-1148.38263888889243.894567-4.70852.2e-051.1e-05
M6-1365.27083333333243.666718-5.6031e-061e-06
M7-1155.15902777778243.473756-4.74452e-051e-05
M8-1504.64722222222243.315765-6.183900
M9-1592.93541666667243.192811-6.550100
M10-1007.42361111111243.104949-4.1440.0001417.1e-05
M11-990.711805555556243.052217-4.07610.0001758.8e-05
t-9.111805555555582.923252-3.1170.0031140.001557


Multiple Linear Regression - Regression Statistics
Multiple R0.890871803322973
R-squared0.793652569955926
Adjusted R-squared0.740968119731907
F-TEST (value)15.0642659566769
F-TEST (DF numerator)12
F-TEST (DF denominator)47
p-value2.80897527460411e-12
Multiple Linear Regression - Residual Statistics
Residual Standard Deviation384.271501749398
Sum Squared Residuals6940235.59166666

\begin{tabular}{lllllllll}
\hline
Multiple Linear Regression - Regression Statistics \tabularnewline
Multiple R & 0.890871803322973 \tabularnewline
R-squared & 0.793652569955926 \tabularnewline
Adjusted R-squared & 0.740968119731907 \tabularnewline
F-TEST (value) & 15.0642659566769 \tabularnewline
F-TEST (DF numerator) & 12 \tabularnewline
F-TEST (DF denominator) & 47 \tabularnewline
p-value & 2.80897527460411e-12 \tabularnewline
Multiple Linear Regression - Residual Statistics \tabularnewline
Residual Standard Deviation & 384.271501749398 \tabularnewline
Sum Squared Residuals & 6940235.59166666 \tabularnewline
\hline
\end{tabular}
%Source: https://freestatistics.org/blog/index.php?pk=158588&T=3

[TABLE]
[ROW][C]Multiple Linear Regression - Regression Statistics[/C][/ROW]
[ROW][C]Multiple R[/C][C]0.890871803322973[/C][/ROW]
[ROW][C]R-squared[/C][C]0.793652569955926[/C][/ROW]
[ROW][C]Adjusted R-squared[/C][C]0.740968119731907[/C][/ROW]
[ROW][C]F-TEST (value)[/C][C]15.0642659566769[/C][/ROW]
[ROW][C]F-TEST (DF numerator)[/C][C]12[/C][/ROW]
[ROW][C]F-TEST (DF denominator)[/C][C]47[/C][/ROW]
[ROW][C]p-value[/C][C]2.80897527460411e-12[/C][/ROW]
[ROW][C]Multiple Linear Regression - Residual Statistics[/C][/ROW]
[ROW][C]Residual Standard Deviation[/C][C]384.271501749398[/C][/ROW]
[ROW][C]Sum Squared Residuals[/C][C]6940235.59166666[/C][/ROW]
[/TABLE]
Source: https://freestatistics.org/blog/index.php?pk=158588&T=3

Globally Unique Identifier (entire table): ba.freestatistics.org/blog/index.php?pk=158588&T=3

As an alternative you can also use a QR Code:  

The GUIDs for individual cells are displayed in the table below:

Multiple Linear Regression - Regression Statistics
Multiple R0.890871803322973
R-squared0.793652569955926
Adjusted R-squared0.740968119731907
F-TEST (value)15.0642659566769
F-TEST (DF numerator)12
F-TEST (DF denominator)47
p-value2.80897527460411e-12
Multiple Linear Regression - Residual Statistics
Residual Standard Deviation384.271501749398
Sum Squared Residuals6940235.59166666


Multiple Linear Regression - Actuals, Interpolation, and Residuals
Time or IndexActualsInterpolationForecastResidualsPrediction Error
1991110118.8833333333-207.883333333319
289159139.48333333333-224.483333333334
394529668.28333333333-216.283333333334
491128759.08333333333352.916666666666
584728459.0833333333312.916666666666
682308233.08333333333-3.08333333333368
783848434.08333333333-50.0833333333339
886258075.48333333333549.516666666666
982217978.08333333333242.916666666666
1086498554.4833333333394.5166666666662
1186258562.0833333333362.916666666666
12104439543.68333333333899.316666666666
131035710009.5416666667347.45833333333
1485869030.14166666667-444.141666666667
1588929558.94166666667-666.941666666667
1683298649.74166666667-320.741666666667
1781018349.74166666667-248.741666666667
1879228123.74166666667-201.741666666667
1981208324.74166666667-204.741666666667
2078387966.14166666667-128.141666666667
2177357868.74166666667-133.741666666667
2284068445.14166666667-39.141666666667
2382098452.74166666667-243.741666666667
2494519434.3416666666716.658333333333
25100419900.2140.799999999996
2694118920.8490.2
27104059449.6955.4
2884678540.4-73.4000000000001
2984648240.4223.6
3081028014.487.6
3176278215.4-588.4
3275137856.8-343.8
3375107759.4-249.4
3482918335.8-44.8
3580648343.4-279.4
369383932557.9999999999999
3797069790.85833333334-84.8583333333366
3885798811.45833333333-232.458333333333
3994749340.25833333333133.741666666667
4083188431.05833333333-113.058333333333
4182138131.0583333333381.941666666667
4280597905.05833333333153.941666666667
4391118106.058333333331004.94166666667
4477087747.45833333333-39.458333333333
4576807650.0583333333329.9416666666668
4680148226.45833333333-212.458333333333
4780078234.05833333333-227.058333333333
4887189215.65833333333-497.658333333333
4994869681.51666666667-195.51666666667
5091138702.11666666667410.883333333334
5190259230.91666666667-205.916666666666
5284768321.71666666667154.283333333334
5379528021.71666666667-69.716666666666
5477597795.71666666667-36.7166666666661
5578357996.71666666667-161.716666666666
5676007638.11666666667-38.1166666666661
5776517540.71666666667110.283333333334
5883198117.11666666667201.883333333334
5988128124.71666666667687.283333333334
6086309106.31666666667-476.316666666666

\begin{tabular}{lllllllll}
\hline
Multiple Linear Regression - Actuals, Interpolation, and Residuals \tabularnewline
Time or Index & Actuals & InterpolationForecast & ResidualsPrediction Error \tabularnewline
1 & 9911 & 10118.8833333333 & -207.883333333319 \tabularnewline
2 & 8915 & 9139.48333333333 & -224.483333333334 \tabularnewline
3 & 9452 & 9668.28333333333 & -216.283333333334 \tabularnewline
4 & 9112 & 8759.08333333333 & 352.916666666666 \tabularnewline
5 & 8472 & 8459.08333333333 & 12.916666666666 \tabularnewline
6 & 8230 & 8233.08333333333 & -3.08333333333368 \tabularnewline
7 & 8384 & 8434.08333333333 & -50.0833333333339 \tabularnewline
8 & 8625 & 8075.48333333333 & 549.516666666666 \tabularnewline
9 & 8221 & 7978.08333333333 & 242.916666666666 \tabularnewline
10 & 8649 & 8554.48333333333 & 94.5166666666662 \tabularnewline
11 & 8625 & 8562.08333333333 & 62.916666666666 \tabularnewline
12 & 10443 & 9543.68333333333 & 899.316666666666 \tabularnewline
13 & 10357 & 10009.5416666667 & 347.45833333333 \tabularnewline
14 & 8586 & 9030.14166666667 & -444.141666666667 \tabularnewline
15 & 8892 & 9558.94166666667 & -666.941666666667 \tabularnewline
16 & 8329 & 8649.74166666667 & -320.741666666667 \tabularnewline
17 & 8101 & 8349.74166666667 & -248.741666666667 \tabularnewline
18 & 7922 & 8123.74166666667 & -201.741666666667 \tabularnewline
19 & 8120 & 8324.74166666667 & -204.741666666667 \tabularnewline
20 & 7838 & 7966.14166666667 & -128.141666666667 \tabularnewline
21 & 7735 & 7868.74166666667 & -133.741666666667 \tabularnewline
22 & 8406 & 8445.14166666667 & -39.141666666667 \tabularnewline
23 & 8209 & 8452.74166666667 & -243.741666666667 \tabularnewline
24 & 9451 & 9434.34166666667 & 16.658333333333 \tabularnewline
25 & 10041 & 9900.2 & 140.799999999996 \tabularnewline
26 & 9411 & 8920.8 & 490.2 \tabularnewline
27 & 10405 & 9449.6 & 955.4 \tabularnewline
28 & 8467 & 8540.4 & -73.4000000000001 \tabularnewline
29 & 8464 & 8240.4 & 223.6 \tabularnewline
30 & 8102 & 8014.4 & 87.6 \tabularnewline
31 & 7627 & 8215.4 & -588.4 \tabularnewline
32 & 7513 & 7856.8 & -343.8 \tabularnewline
33 & 7510 & 7759.4 & -249.4 \tabularnewline
34 & 8291 & 8335.8 & -44.8 \tabularnewline
35 & 8064 & 8343.4 & -279.4 \tabularnewline
36 & 9383 & 9325 & 57.9999999999999 \tabularnewline
37 & 9706 & 9790.85833333334 & -84.8583333333366 \tabularnewline
38 & 8579 & 8811.45833333333 & -232.458333333333 \tabularnewline
39 & 9474 & 9340.25833333333 & 133.741666666667 \tabularnewline
40 & 8318 & 8431.05833333333 & -113.058333333333 \tabularnewline
41 & 8213 & 8131.05833333333 & 81.941666666667 \tabularnewline
42 & 8059 & 7905.05833333333 & 153.941666666667 \tabularnewline
43 & 9111 & 8106.05833333333 & 1004.94166666667 \tabularnewline
44 & 7708 & 7747.45833333333 & -39.458333333333 \tabularnewline
45 & 7680 & 7650.05833333333 & 29.9416666666668 \tabularnewline
46 & 8014 & 8226.45833333333 & -212.458333333333 \tabularnewline
47 & 8007 & 8234.05833333333 & -227.058333333333 \tabularnewline
48 & 8718 & 9215.65833333333 & -497.658333333333 \tabularnewline
49 & 9486 & 9681.51666666667 & -195.51666666667 \tabularnewline
50 & 9113 & 8702.11666666667 & 410.883333333334 \tabularnewline
51 & 9025 & 9230.91666666667 & -205.916666666666 \tabularnewline
52 & 8476 & 8321.71666666667 & 154.283333333334 \tabularnewline
53 & 7952 & 8021.71666666667 & -69.716666666666 \tabularnewline
54 & 7759 & 7795.71666666667 & -36.7166666666661 \tabularnewline
55 & 7835 & 7996.71666666667 & -161.716666666666 \tabularnewline
56 & 7600 & 7638.11666666667 & -38.1166666666661 \tabularnewline
57 & 7651 & 7540.71666666667 & 110.283333333334 \tabularnewline
58 & 8319 & 8117.11666666667 & 201.883333333334 \tabularnewline
59 & 8812 & 8124.71666666667 & 687.283333333334 \tabularnewline
60 & 8630 & 9106.31666666667 & -476.316666666666 \tabularnewline
\hline
\end{tabular}
%Source: https://freestatistics.org/blog/index.php?pk=158588&T=4

[TABLE]
[ROW][C]Multiple Linear Regression - Actuals, Interpolation, and Residuals[/C][/ROW]
[ROW][C]Time or Index[/C][C]Actuals[/C][C]InterpolationForecast[/C][C]ResidualsPrediction Error[/C][/ROW]
[ROW][C]1[/C][C]9911[/C][C]10118.8833333333[/C][C]-207.883333333319[/C][/ROW]
[ROW][C]2[/C][C]8915[/C][C]9139.48333333333[/C][C]-224.483333333334[/C][/ROW]
[ROW][C]3[/C][C]9452[/C][C]9668.28333333333[/C][C]-216.283333333334[/C][/ROW]
[ROW][C]4[/C][C]9112[/C][C]8759.08333333333[/C][C]352.916666666666[/C][/ROW]
[ROW][C]5[/C][C]8472[/C][C]8459.08333333333[/C][C]12.916666666666[/C][/ROW]
[ROW][C]6[/C][C]8230[/C][C]8233.08333333333[/C][C]-3.08333333333368[/C][/ROW]
[ROW][C]7[/C][C]8384[/C][C]8434.08333333333[/C][C]-50.0833333333339[/C][/ROW]
[ROW][C]8[/C][C]8625[/C][C]8075.48333333333[/C][C]549.516666666666[/C][/ROW]
[ROW][C]9[/C][C]8221[/C][C]7978.08333333333[/C][C]242.916666666666[/C][/ROW]
[ROW][C]10[/C][C]8649[/C][C]8554.48333333333[/C][C]94.5166666666662[/C][/ROW]
[ROW][C]11[/C][C]8625[/C][C]8562.08333333333[/C][C]62.916666666666[/C][/ROW]
[ROW][C]12[/C][C]10443[/C][C]9543.68333333333[/C][C]899.316666666666[/C][/ROW]
[ROW][C]13[/C][C]10357[/C][C]10009.5416666667[/C][C]347.45833333333[/C][/ROW]
[ROW][C]14[/C][C]8586[/C][C]9030.14166666667[/C][C]-444.141666666667[/C][/ROW]
[ROW][C]15[/C][C]8892[/C][C]9558.94166666667[/C][C]-666.941666666667[/C][/ROW]
[ROW][C]16[/C][C]8329[/C][C]8649.74166666667[/C][C]-320.741666666667[/C][/ROW]
[ROW][C]17[/C][C]8101[/C][C]8349.74166666667[/C][C]-248.741666666667[/C][/ROW]
[ROW][C]18[/C][C]7922[/C][C]8123.74166666667[/C][C]-201.741666666667[/C][/ROW]
[ROW][C]19[/C][C]8120[/C][C]8324.74166666667[/C][C]-204.741666666667[/C][/ROW]
[ROW][C]20[/C][C]7838[/C][C]7966.14166666667[/C][C]-128.141666666667[/C][/ROW]
[ROW][C]21[/C][C]7735[/C][C]7868.74166666667[/C][C]-133.741666666667[/C][/ROW]
[ROW][C]22[/C][C]8406[/C][C]8445.14166666667[/C][C]-39.141666666667[/C][/ROW]
[ROW][C]23[/C][C]8209[/C][C]8452.74166666667[/C][C]-243.741666666667[/C][/ROW]
[ROW][C]24[/C][C]9451[/C][C]9434.34166666667[/C][C]16.658333333333[/C][/ROW]
[ROW][C]25[/C][C]10041[/C][C]9900.2[/C][C]140.799999999996[/C][/ROW]
[ROW][C]26[/C][C]9411[/C][C]8920.8[/C][C]490.2[/C][/ROW]
[ROW][C]27[/C][C]10405[/C][C]9449.6[/C][C]955.4[/C][/ROW]
[ROW][C]28[/C][C]8467[/C][C]8540.4[/C][C]-73.4000000000001[/C][/ROW]
[ROW][C]29[/C][C]8464[/C][C]8240.4[/C][C]223.6[/C][/ROW]
[ROW][C]30[/C][C]8102[/C][C]8014.4[/C][C]87.6[/C][/ROW]
[ROW][C]31[/C][C]7627[/C][C]8215.4[/C][C]-588.4[/C][/ROW]
[ROW][C]32[/C][C]7513[/C][C]7856.8[/C][C]-343.8[/C][/ROW]
[ROW][C]33[/C][C]7510[/C][C]7759.4[/C][C]-249.4[/C][/ROW]
[ROW][C]34[/C][C]8291[/C][C]8335.8[/C][C]-44.8[/C][/ROW]
[ROW][C]35[/C][C]8064[/C][C]8343.4[/C][C]-279.4[/C][/ROW]
[ROW][C]36[/C][C]9383[/C][C]9325[/C][C]57.9999999999999[/C][/ROW]
[ROW][C]37[/C][C]9706[/C][C]9790.85833333334[/C][C]-84.8583333333366[/C][/ROW]
[ROW][C]38[/C][C]8579[/C][C]8811.45833333333[/C][C]-232.458333333333[/C][/ROW]
[ROW][C]39[/C][C]9474[/C][C]9340.25833333333[/C][C]133.741666666667[/C][/ROW]
[ROW][C]40[/C][C]8318[/C][C]8431.05833333333[/C][C]-113.058333333333[/C][/ROW]
[ROW][C]41[/C][C]8213[/C][C]8131.05833333333[/C][C]81.941666666667[/C][/ROW]
[ROW][C]42[/C][C]8059[/C][C]7905.05833333333[/C][C]153.941666666667[/C][/ROW]
[ROW][C]43[/C][C]9111[/C][C]8106.05833333333[/C][C]1004.94166666667[/C][/ROW]
[ROW][C]44[/C][C]7708[/C][C]7747.45833333333[/C][C]-39.458333333333[/C][/ROW]
[ROW][C]45[/C][C]7680[/C][C]7650.05833333333[/C][C]29.9416666666668[/C][/ROW]
[ROW][C]46[/C][C]8014[/C][C]8226.45833333333[/C][C]-212.458333333333[/C][/ROW]
[ROW][C]47[/C][C]8007[/C][C]8234.05833333333[/C][C]-227.058333333333[/C][/ROW]
[ROW][C]48[/C][C]8718[/C][C]9215.65833333333[/C][C]-497.658333333333[/C][/ROW]
[ROW][C]49[/C][C]9486[/C][C]9681.51666666667[/C][C]-195.51666666667[/C][/ROW]
[ROW][C]50[/C][C]9113[/C][C]8702.11666666667[/C][C]410.883333333334[/C][/ROW]
[ROW][C]51[/C][C]9025[/C][C]9230.91666666667[/C][C]-205.916666666666[/C][/ROW]
[ROW][C]52[/C][C]8476[/C][C]8321.71666666667[/C][C]154.283333333334[/C][/ROW]
[ROW][C]53[/C][C]7952[/C][C]8021.71666666667[/C][C]-69.716666666666[/C][/ROW]
[ROW][C]54[/C][C]7759[/C][C]7795.71666666667[/C][C]-36.7166666666661[/C][/ROW]
[ROW][C]55[/C][C]7835[/C][C]7996.71666666667[/C][C]-161.716666666666[/C][/ROW]
[ROW][C]56[/C][C]7600[/C][C]7638.11666666667[/C][C]-38.1166666666661[/C][/ROW]
[ROW][C]57[/C][C]7651[/C][C]7540.71666666667[/C][C]110.283333333334[/C][/ROW]
[ROW][C]58[/C][C]8319[/C][C]8117.11666666667[/C][C]201.883333333334[/C][/ROW]
[ROW][C]59[/C][C]8812[/C][C]8124.71666666667[/C][C]687.283333333334[/C][/ROW]
[ROW][C]60[/C][C]8630[/C][C]9106.31666666667[/C][C]-476.316666666666[/C][/ROW]
[/TABLE]
Source: https://freestatistics.org/blog/index.php?pk=158588&T=4

Globally Unique Identifier (entire table): ba.freestatistics.org/blog/index.php?pk=158588&T=4

As an alternative you can also use a QR Code:  

The GUIDs for individual cells are displayed in the table below:

Multiple Linear Regression - Actuals, Interpolation, and Residuals
Time or IndexActualsInterpolationForecastResidualsPrediction Error
1991110118.8833333333-207.883333333319
289159139.48333333333-224.483333333334
394529668.28333333333-216.283333333334
491128759.08333333333352.916666666666
584728459.0833333333312.916666666666
682308233.08333333333-3.08333333333368
783848434.08333333333-50.0833333333339
886258075.48333333333549.516666666666
982217978.08333333333242.916666666666
1086498554.4833333333394.5166666666662
1186258562.0833333333362.916666666666
12104439543.68333333333899.316666666666
131035710009.5416666667347.45833333333
1485869030.14166666667-444.141666666667
1588929558.94166666667-666.941666666667
1683298649.74166666667-320.741666666667
1781018349.74166666667-248.741666666667
1879228123.74166666667-201.741666666667
1981208324.74166666667-204.741666666667
2078387966.14166666667-128.141666666667
2177357868.74166666667-133.741666666667
2284068445.14166666667-39.141666666667
2382098452.74166666667-243.741666666667
2494519434.3416666666716.658333333333
25100419900.2140.799999999996
2694118920.8490.2
27104059449.6955.4
2884678540.4-73.4000000000001
2984648240.4223.6
3081028014.487.6
3176278215.4-588.4
3275137856.8-343.8
3375107759.4-249.4
3482918335.8-44.8
3580648343.4-279.4
369383932557.9999999999999
3797069790.85833333334-84.8583333333366
3885798811.45833333333-232.458333333333
3994749340.25833333333133.741666666667
4083188431.05833333333-113.058333333333
4182138131.0583333333381.941666666667
4280597905.05833333333153.941666666667
4391118106.058333333331004.94166666667
4477087747.45833333333-39.458333333333
4576807650.0583333333329.9416666666668
4680148226.45833333333-212.458333333333
4780078234.05833333333-227.058333333333
4887189215.65833333333-497.658333333333
4994869681.51666666667-195.51666666667
5091138702.11666666667410.883333333334
5190259230.91666666667-205.916666666666
5284768321.71666666667154.283333333334
5379528021.71666666667-69.716666666666
5477597795.71666666667-36.7166666666661
5578357996.71666666667-161.716666666666
5676007638.11666666667-38.1166666666661
5776517540.71666666667110.283333333334
5883198117.11666666667201.883333333334
5988128124.71666666667687.283333333334
6086309106.31666666667-476.316666666666


Goldfeld-Quandt test for Heteroskedasticity
p-valuesAlternative Hypothesis
breakpoint indexgreater2-sidedless
160.6541438570153740.6917122859692510.345856142984626
170.493747052190030.9874941043800590.50625294780997
180.3455166093268040.6910332186536090.654483390673196
190.2288977399539190.4577954799078380.771102260046081
200.2127282357951520.4254564715903040.787271764204848
210.1349616150895130.2699232301790260.865038384910487
220.0819917970953220.1639835941906440.918008202904678
230.04856546487331960.09713092974663930.95143453512668
240.07079088986675120.1415817797335020.929209110133249
250.08317908424881030.1663581684976210.91682091575119
260.3427091265129320.6854182530258630.657290873487068
270.8596789004798470.2806421990403050.140321099520153
280.7990305980401920.4019388039196170.200969401959808
290.7565237114640010.4869525770719970.243476288535999
300.6821886573418750.6356226853162510.317811342658125
310.7868228077642050.4263543844715910.213177192235795
320.7584926645046460.4830146709907070.241507335495354
330.7008517552791190.5982964894417620.299148244720881
340.6067252538963830.7865494922072350.393274746103617
350.5866147016908630.8267705966182740.413385298309137
360.5843026787676520.8313946424646960.415697321232348
370.4827743550449580.9655487100899150.517225644955042
380.4733678066256080.9467356132512160.526632193374392
390.3976213297805720.7952426595611440.602378670219428
400.3044586144277190.6089172288554380.695541385572281
410.2124225981933530.4248451963867060.787577401806647
420.1419681293523140.2839362587046280.858031870647686
430.7723553923552630.4552892152894740.227644607644737
440.6757047130595110.6485905738809790.324295286940489

\begin{tabular}{lllllllll}
\hline
Goldfeld-Quandt test for Heteroskedasticity \tabularnewline
p-values & Alternative Hypothesis \tabularnewline
breakpoint index & greater & 2-sided & less \tabularnewline
16 & 0.654143857015374 & 0.691712285969251 & 0.345856142984626 \tabularnewline
17 & 0.49374705219003 & 0.987494104380059 & 0.50625294780997 \tabularnewline
18 & 0.345516609326804 & 0.691033218653609 & 0.654483390673196 \tabularnewline
19 & 0.228897739953919 & 0.457795479907838 & 0.771102260046081 \tabularnewline
20 & 0.212728235795152 & 0.425456471590304 & 0.787271764204848 \tabularnewline
21 & 0.134961615089513 & 0.269923230179026 & 0.865038384910487 \tabularnewline
22 & 0.081991797095322 & 0.163983594190644 & 0.918008202904678 \tabularnewline
23 & 0.0485654648733196 & 0.0971309297466393 & 0.95143453512668 \tabularnewline
24 & 0.0707908898667512 & 0.141581779733502 & 0.929209110133249 \tabularnewline
25 & 0.0831790842488103 & 0.166358168497621 & 0.91682091575119 \tabularnewline
26 & 0.342709126512932 & 0.685418253025863 & 0.657290873487068 \tabularnewline
27 & 0.859678900479847 & 0.280642199040305 & 0.140321099520153 \tabularnewline
28 & 0.799030598040192 & 0.401938803919617 & 0.200969401959808 \tabularnewline
29 & 0.756523711464001 & 0.486952577071997 & 0.243476288535999 \tabularnewline
30 & 0.682188657341875 & 0.635622685316251 & 0.317811342658125 \tabularnewline
31 & 0.786822807764205 & 0.426354384471591 & 0.213177192235795 \tabularnewline
32 & 0.758492664504646 & 0.483014670990707 & 0.241507335495354 \tabularnewline
33 & 0.700851755279119 & 0.598296489441762 & 0.299148244720881 \tabularnewline
34 & 0.606725253896383 & 0.786549492207235 & 0.393274746103617 \tabularnewline
35 & 0.586614701690863 & 0.826770596618274 & 0.413385298309137 \tabularnewline
36 & 0.584302678767652 & 0.831394642464696 & 0.415697321232348 \tabularnewline
37 & 0.482774355044958 & 0.965548710089915 & 0.517225644955042 \tabularnewline
38 & 0.473367806625608 & 0.946735613251216 & 0.526632193374392 \tabularnewline
39 & 0.397621329780572 & 0.795242659561144 & 0.602378670219428 \tabularnewline
40 & 0.304458614427719 & 0.608917228855438 & 0.695541385572281 \tabularnewline
41 & 0.212422598193353 & 0.424845196386706 & 0.787577401806647 \tabularnewline
42 & 0.141968129352314 & 0.283936258704628 & 0.858031870647686 \tabularnewline
43 & 0.772355392355263 & 0.455289215289474 & 0.227644607644737 \tabularnewline
44 & 0.675704713059511 & 0.648590573880979 & 0.324295286940489 \tabularnewline
\hline
\end{tabular}
%Source: https://freestatistics.org/blog/index.php?pk=158588&T=5

[TABLE]
[ROW][C]Goldfeld-Quandt test for Heteroskedasticity[/C][/ROW]
[ROW][C]p-values[/C][C]Alternative Hypothesis[/C][/ROW]
[ROW][C]breakpoint index[/C][C]greater[/C][C]2-sided[/C][C]less[/C][/ROW]
[ROW][C]16[/C][C]0.654143857015374[/C][C]0.691712285969251[/C][C]0.345856142984626[/C][/ROW]
[ROW][C]17[/C][C]0.49374705219003[/C][C]0.987494104380059[/C][C]0.50625294780997[/C][/ROW]
[ROW][C]18[/C][C]0.345516609326804[/C][C]0.691033218653609[/C][C]0.654483390673196[/C][/ROW]
[ROW][C]19[/C][C]0.228897739953919[/C][C]0.457795479907838[/C][C]0.771102260046081[/C][/ROW]
[ROW][C]20[/C][C]0.212728235795152[/C][C]0.425456471590304[/C][C]0.787271764204848[/C][/ROW]
[ROW][C]21[/C][C]0.134961615089513[/C][C]0.269923230179026[/C][C]0.865038384910487[/C][/ROW]
[ROW][C]22[/C][C]0.081991797095322[/C][C]0.163983594190644[/C][C]0.918008202904678[/C][/ROW]
[ROW][C]23[/C][C]0.0485654648733196[/C][C]0.0971309297466393[/C][C]0.95143453512668[/C][/ROW]
[ROW][C]24[/C][C]0.0707908898667512[/C][C]0.141581779733502[/C][C]0.929209110133249[/C][/ROW]
[ROW][C]25[/C][C]0.0831790842488103[/C][C]0.166358168497621[/C][C]0.91682091575119[/C][/ROW]
[ROW][C]26[/C][C]0.342709126512932[/C][C]0.685418253025863[/C][C]0.657290873487068[/C][/ROW]
[ROW][C]27[/C][C]0.859678900479847[/C][C]0.280642199040305[/C][C]0.140321099520153[/C][/ROW]
[ROW][C]28[/C][C]0.799030598040192[/C][C]0.401938803919617[/C][C]0.200969401959808[/C][/ROW]
[ROW][C]29[/C][C]0.756523711464001[/C][C]0.486952577071997[/C][C]0.243476288535999[/C][/ROW]
[ROW][C]30[/C][C]0.682188657341875[/C][C]0.635622685316251[/C][C]0.317811342658125[/C][/ROW]
[ROW][C]31[/C][C]0.786822807764205[/C][C]0.426354384471591[/C][C]0.213177192235795[/C][/ROW]
[ROW][C]32[/C][C]0.758492664504646[/C][C]0.483014670990707[/C][C]0.241507335495354[/C][/ROW]
[ROW][C]33[/C][C]0.700851755279119[/C][C]0.598296489441762[/C][C]0.299148244720881[/C][/ROW]
[ROW][C]34[/C][C]0.606725253896383[/C][C]0.786549492207235[/C][C]0.393274746103617[/C][/ROW]
[ROW][C]35[/C][C]0.586614701690863[/C][C]0.826770596618274[/C][C]0.413385298309137[/C][/ROW]
[ROW][C]36[/C][C]0.584302678767652[/C][C]0.831394642464696[/C][C]0.415697321232348[/C][/ROW]
[ROW][C]37[/C][C]0.482774355044958[/C][C]0.965548710089915[/C][C]0.517225644955042[/C][/ROW]
[ROW][C]38[/C][C]0.473367806625608[/C][C]0.946735613251216[/C][C]0.526632193374392[/C][/ROW]
[ROW][C]39[/C][C]0.397621329780572[/C][C]0.795242659561144[/C][C]0.602378670219428[/C][/ROW]
[ROW][C]40[/C][C]0.304458614427719[/C][C]0.608917228855438[/C][C]0.695541385572281[/C][/ROW]
[ROW][C]41[/C][C]0.212422598193353[/C][C]0.424845196386706[/C][C]0.787577401806647[/C][/ROW]
[ROW][C]42[/C][C]0.141968129352314[/C][C]0.283936258704628[/C][C]0.858031870647686[/C][/ROW]
[ROW][C]43[/C][C]0.772355392355263[/C][C]0.455289215289474[/C][C]0.227644607644737[/C][/ROW]
[ROW][C]44[/C][C]0.675704713059511[/C][C]0.648590573880979[/C][C]0.324295286940489[/C][/ROW]
[/TABLE]
Source: https://freestatistics.org/blog/index.php?pk=158588&T=5

Globally Unique Identifier (entire table): ba.freestatistics.org/blog/index.php?pk=158588&T=5

As an alternative you can also use a QR Code:  

The GUIDs for individual cells are displayed in the table below:

Goldfeld-Quandt test for Heteroskedasticity
p-valuesAlternative Hypothesis
breakpoint indexgreater2-sidedless
160.6541438570153740.6917122859692510.345856142984626
170.493747052190030.9874941043800590.50625294780997
180.3455166093268040.6910332186536090.654483390673196
190.2288977399539190.4577954799078380.771102260046081
200.2127282357951520.4254564715903040.787271764204848
210.1349616150895130.2699232301790260.865038384910487
220.0819917970953220.1639835941906440.918008202904678
230.04856546487331960.09713092974663930.95143453512668
240.07079088986675120.1415817797335020.929209110133249
250.08317908424881030.1663581684976210.91682091575119
260.3427091265129320.6854182530258630.657290873487068
270.8596789004798470.2806421990403050.140321099520153
280.7990305980401920.4019388039196170.200969401959808
290.7565237114640010.4869525770719970.243476288535999
300.6821886573418750.6356226853162510.317811342658125
310.7868228077642050.4263543844715910.213177192235795
320.7584926645046460.4830146709907070.241507335495354
330.7008517552791190.5982964894417620.299148244720881
340.6067252538963830.7865494922072350.393274746103617
350.5866147016908630.8267705966182740.413385298309137
360.5843026787676520.8313946424646960.415697321232348
370.4827743550449580.9655487100899150.517225644955042
380.4733678066256080.9467356132512160.526632193374392
390.3976213297805720.7952426595611440.602378670219428
400.3044586144277190.6089172288554380.695541385572281
410.2124225981933530.4248451963867060.787577401806647
420.1419681293523140.2839362587046280.858031870647686
430.7723553923552630.4552892152894740.227644607644737
440.6757047130595110.6485905738809790.324295286940489


Meta Analysis of Goldfeld-Quandt test for Heteroskedasticity
Description# significant tests% significant testsOK/NOK
1% type I error level00OK
5% type I error level00OK
10% type I error level10.0344827586206897OK

\begin{tabular}{lllllllll}
\hline
Meta Analysis of Goldfeld-Quandt test for Heteroskedasticity \tabularnewline
Description & # significant tests & % significant tests & OK/NOK \tabularnewline
1% type I error level & 0 & 0 & OK \tabularnewline
5% type I error level & 0 & 0 & OK \tabularnewline
10% type I error level & 1 & 0.0344827586206897 & OK \tabularnewline
\hline
\end{tabular}
%Source: https://freestatistics.org/blog/index.php?pk=158588&T=6

[TABLE]
[ROW][C]Meta Analysis of Goldfeld-Quandt test for Heteroskedasticity[/C][/ROW]
[ROW][C]Description[/C][C]# significant tests[/C][C]% significant tests[/C][C]OK/NOK[/C][/ROW]
[ROW][C]1% type I error level[/C][C]0[/C][C]0[/C][C]OK[/C][/ROW]
[ROW][C]5% type I error level[/C][C]0[/C][C]0[/C][C]OK[/C][/ROW]
[ROW][C]10% type I error level[/C][C]1[/C][C]0.0344827586206897[/C][C]OK[/C][/ROW]
[/TABLE]
Source: https://freestatistics.org/blog/index.php?pk=158588&T=6

Globally Unique Identifier (entire table): ba.freestatistics.org/blog/index.php?pk=158588&T=6

As an alternative you can also use a QR Code:  

The GUIDs for individual cells are displayed in the table below:

Meta Analysis of Goldfeld-Quandt test for Heteroskedasticity
Description# significant tests% significant testsOK/NOK
1% type I error level00OK
5% type I error level00OK
10% type I error level10.0344827586206897OK


Parameters (Session):
par1 = 1 ; par2 = Include Monthly Dummies ; par3 = Linear Trend ;
Parameters (R input):
par1 = 1 ; par2 = Include Monthly Dummies ; par3 = Linear Trend ;
R code (references can be found in the software module):
library(lattice)
library(lmtest)
n25 <- 25 #minimum number of obs. for Goldfeld-Quandt test
par1 <- as.numeric(par1)
x <- t(y)
k <- length(x[1,])
n <- length(x[,1])
x1 <- cbind(x[,par1], x[,1:k!=par1])
mycolnames <- c(colnames(x)[par1], colnames(x)[1:k!=par1])
colnames(x1) <- mycolnames #colnames(x)[par1]
x <- x1
if (par3 == 'First Differences'){
x2 <- array(0, dim=c(n-1,k), dimnames=list(1:(n-1), paste('(1-B)',colnames(x),sep='')))
for (i in 1:n-1) {
for (j in 1:k) {
x2[i,j] <- x[i+1,j] - x[i,j]
}
}
x <- x2
}
if (par2 == 'Include Monthly Dummies'){
x2 <- array(0, dim=c(n,11), dimnames=list(1:n, paste('M', seq(1:11), sep ='')))
for (i in 1:11){
x2[seq(i,n,12),i] <- 1
}
x <- cbind(x, x2)
}
if (par2 == 'Include Quarterly Dummies'){
x2 <- array(0, dim=c(n,3), dimnames=list(1:n, paste('Q', seq(1:3), sep ='')))
for (i in 1:3){
x2[seq(i,n,4),i] <- 1
}
x <- cbind(x, x2)
}
k <- length(x[1,])
if (par3 == 'Linear Trend'){
x <- cbind(x, c(1:n))
colnames(x)[k+1] <- 't'
}
x
k <- length(x[1,])
df <- as.data.frame(x)
(mylm <- lm(df))
(mysum <- summary(mylm))
if (n > n25) {
kp3 <- k + 3
nmkm3 <- n - k - 3
gqarr <- array(NA, dim=c(nmkm3-kp3+1,3))
numgqtests <- 0
numsignificant1 <- 0
numsignificant5 <- 0
numsignificant10 <- 0
for (mypoint in kp3:nmkm3) {
j <- 0
numgqtests <- numgqtests + 1
for (myalt in c('greater', 'two.sided', 'less')) {
j <- j + 1
gqarr[mypoint-kp3+1,j] <- gqtest(mylm, point=mypoint, alternative=myalt)$p.value
}
if (gqarr[mypoint-kp3+1,2] < 0.01) numsignificant1 <- numsignificant1 + 1
if (gqarr[mypoint-kp3+1,2] < 0.05) numsignificant5 <- numsignificant5 + 1
if (gqarr[mypoint-kp3+1,2] < 0.10) numsignificant10 <- numsignificant10 + 1
}
gqarr
}
bitmap(file='test0.png')
plot(x[,1], type='l', main='Actuals and Interpolation', ylab='value of Actuals and Interpolation (dots)', xlab='time or index')
points(x[,1]-mysum$resid)
grid()
dev.off()
bitmap(file='test1.png')
plot(mysum$resid, type='b', pch=19, main='Residuals', ylab='value of Residuals', xlab='time or index')
grid()
dev.off()
bitmap(file='test2.png')
hist(mysum$resid, main='Residual Histogram', xlab='values of Residuals')
grid()
dev.off()
bitmap(file='test3.png')
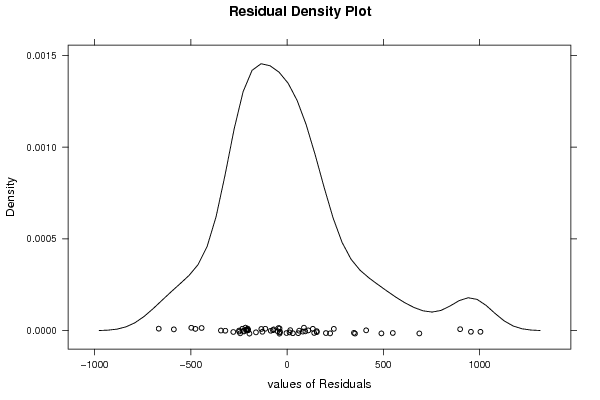
densityplot(~mysum$resid,col='black',main='Residual Density Plot', xlab='values of Residuals')
dev.off()
bitmap(file='test4.png')
qqnorm(mysum$resid, main='Residual Normal Q-Q Plot')
qqline(mysum$resid)
grid()
dev.off()
(myerror <- as.ts(mysum$resid))
bitmap(file='test5.png')
dum <- cbind(lag(myerror,k=1),myerror)
dum
dum1 <- dum[2:length(myerror),]
dum1
z <- as.data.frame(dum1)
z
plot(z,main=paste('Residual Lag plot, lowess, and regression line'), ylab='values of Residuals', xlab='lagged values of Residuals')
lines(lowess(z))
abline(lm(z))
grid()
dev.off()
bitmap(file='test6.png')
acf(mysum$resid, lag.max=length(mysum$resid)/2, main='Residual Autocorrelation Function')
grid()
dev.off()
bitmap(file='test7.png')
pacf(mysum$resid, lag.max=length(mysum$resid)/2, main='Residual Partial Autocorrelation Function')
grid()
dev.off()
bitmap(file='test8.png')
opar <- par(mfrow = c(2,2), oma = c(0, 0, 1.1, 0))
plot(mylm, las = 1, sub='Residual Diagnostics')
par(opar)
dev.off()
if (n > n25) {
bitmap(file='test9.png')
plot(kp3:nmkm3,gqarr[,2], main='Goldfeld-Quandt test',ylab='2-sided p-value',xlab='breakpoint')
grid()
dev.off()
}
load(file='createtable')
a<-table.start()
a<-table.row.start(a)
a<-table.element(a, 'Multiple Linear Regression - Estimated Regression Equation', 1, TRUE)
a<-table.row.end(a)
myeq <- colnames(x)[1]
myeq <- paste(myeq, '[t] = ', sep='')
for (i in 1:k){
if (mysum$coefficients[i,1] > 0) myeq <- paste(myeq, '+', '')
myeq <- paste(myeq, mysum$coefficients[i,1], sep=' ')
if (rownames(mysum$coefficients)[i] != '(Intercept)') {
myeq <- paste(myeq, rownames(mysum$coefficients)[i], sep='')
if (rownames(mysum$coefficients)[i] != 't') myeq <- paste(myeq, '[t]', sep='')
}
}
myeq <- paste(myeq, ' + e[t]')
a<-table.row.start(a)
a<-table.element(a, myeq)
a<-table.row.end(a)
a<-table.end(a)
table.save(a,file='mytable1.tab')
a<-table.start()
a<-table.row.start(a)
a<-table.element(a,hyperlink('ols1.htm','Multiple Linear Regression - Ordinary Least Squares',''), 6, TRUE)
a<-table.row.end(a)
a<-table.row.start(a)
a<-table.element(a,'Variable',header=TRUE)
a<-table.element(a,'Parameter',header=TRUE)
a<-table.element(a,'S.D.',header=TRUE)
a<-table.element(a,'T-STAT
H0: parameter = 0',header=TRUE)
a<-table.element(a,'2-tail p-value',header=TRUE)
a<-table.element(a,'1-tail p-value',header=TRUE)
a<-table.row.end(a)
for (i in 1:k){
a<-table.row.start(a)
a<-table.element(a,rownames(mysum$coefficients)[i],header=TRUE)
a<-table.element(a,mysum$coefficients[i,1])
a<-table.element(a, round(mysum$coefficients[i,2],6))
a<-table.element(a, round(mysum$coefficients[i,3],4))
a<-table.element(a, round(mysum$coefficients[i,4],6))
a<-table.element(a, round(mysum$coefficients[i,4]/2,6))
a<-table.row.end(a)
}
a<-table.end(a)
table.save(a,file='mytable2.tab')
a<-table.start()
a<-table.row.start(a)
a<-table.element(a, 'Multiple Linear Regression - Regression Statistics', 2, TRUE)
a<-table.row.end(a)
a<-table.row.start(a)
a<-table.element(a, 'Multiple R',1,TRUE)
a<-table.element(a, sqrt(mysum$r.squared))
a<-table.row.end(a)
a<-table.row.start(a)
a<-table.element(a, 'R-squared',1,TRUE)
a<-table.element(a, mysum$r.squared)
a<-table.row.end(a)
a<-table.row.start(a)
a<-table.element(a, 'Adjusted R-squared',1,TRUE)
a<-table.element(a, mysum$adj.r.squared)
a<-table.row.end(a)
a<-table.row.start(a)
a<-table.element(a, 'F-TEST (value)',1,TRUE)
a<-table.element(a, mysum$fstatistic[1])
a<-table.row.end(a)
a<-table.row.start(a)
a<-table.element(a, 'F-TEST (DF numerator)',1,TRUE)
a<-table.element(a, mysum$fstatistic[2])
a<-table.row.end(a)
a<-table.row.start(a)
a<-table.element(a, 'F-TEST (DF denominator)',1,TRUE)
a<-table.element(a, mysum$fstatistic[3])
a<-table.row.end(a)
a<-table.row.start(a)
a<-table.element(a, 'p-value',1,TRUE)
a<-table.element(a, 1-pf(mysum$fstatistic[1],mysum$fstatistic[2],mysum$fstatistic[3]))
a<-table.row.end(a)
a<-table.row.start(a)
a<-table.element(a, 'Multiple Linear Regression - Residual Statistics', 2, TRUE)
a<-table.row.end(a)
a<-table.row.start(a)
a<-table.element(a, 'Residual Standard Deviation',1,TRUE)
a<-table.element(a, mysum$sigma)
a<-table.row.end(a)
a<-table.row.start(a)
a<-table.element(a, 'Sum Squared Residuals',1,TRUE)
a<-table.element(a, sum(myerror*myerror))
a<-table.row.end(a)
a<-table.end(a)
table.save(a,file='mytable3.tab')
a<-table.start()
a<-table.row.start(a)
a<-table.element(a, 'Multiple Linear Regression - Actuals, Interpolation, and Residuals', 4, TRUE)
a<-table.row.end(a)
a<-table.row.start(a)
a<-table.element(a, 'Time or Index', 1, TRUE)
a<-table.element(a, 'Actuals', 1, TRUE)
a<-table.element(a, 'Interpolation
Forecast', 1, TRUE)
a<-table.element(a, 'Residuals
Prediction Error', 1, TRUE)
a<-table.row.end(a)
for (i in 1:n) {
a<-table.row.start(a)
a<-table.element(a,i, 1, TRUE)
a<-table.element(a,x[i])
a<-table.element(a,x[i]-mysum$resid[i])
a<-table.element(a,mysum$resid[i])
a<-table.row.end(a)
}
a<-table.end(a)
table.save(a,file='mytable4.tab')
if (n > n25) {
a<-table.start()
a<-table.row.start(a)
a<-table.element(a,'Goldfeld-Quandt test for Heteroskedasticity',4,TRUE)
a<-table.row.end(a)
a<-table.row.start(a)
a<-table.element(a,'p-values',header=TRUE)
a<-table.element(a,'Alternative Hypothesis',3,header=TRUE)
a<-table.row.end(a)
a<-table.row.start(a)
a<-table.element(a,'breakpoint index',header=TRUE)
a<-table.element(a,'greater',header=TRUE)
a<-table.element(a,'2-sided',header=TRUE)
a<-table.element(a,'less',header=TRUE)
a<-table.row.end(a)
for (mypoint in kp3:nmkm3) {
a<-table.row.start(a)
a<-table.element(a,mypoint,header=TRUE)
a<-table.element(a,gqarr[mypoint-kp3+1,1])
a<-table.element(a,gqarr[mypoint-kp3+1,2])
a<-table.element(a,gqarr[mypoint-kp3+1,3])
a<-table.row.end(a)
}
a<-table.end(a)
table.save(a,file='mytable5.tab')
a<-table.start()
a<-table.row.start(a)
a<-table.element(a,'Meta Analysis of Goldfeld-Quandt test for Heteroskedasticity',4,TRUE)
a<-table.row.end(a)
a<-table.row.start(a)
a<-table.element(a,'Description',header=TRUE)
a<-table.element(a,'# significant tests',header=TRUE)
a<-table.element(a,'% significant tests',header=TRUE)
a<-table.element(a,'OK/NOK',header=TRUE)
a<-table.row.end(a)
a<-table.row.start(a)
a<-table.element(a,'1% type I error level',header=TRUE)
a<-table.element(a,numsignificant1)
a<-table.element(a,numsignificant1/numgqtests)
if (numsignificant1/numgqtests < 0.01) dum <- 'OK' else dum <- 'NOK'
a<-table.element(a,dum)
a<-table.row.end(a)
a<-table.row.start(a)
a<-table.element(a,'5% type I error level',header=TRUE)
a<-table.element(a,numsignificant5)
a<-table.element(a,numsignificant5/numgqtests)
if (numsignificant5/numgqtests < 0.05) dum <- 'OK' else dum <- 'NOK'
a<-table.element(a,dum)
a<-table.row.end(a)
a<-table.row.start(a)
a<-table.element(a,'10% type I error level',header=TRUE)
a<-table.element(a,numsignificant10)
a<-table.element(a,numsignificant10/numgqtests)
if (numsignificant10/numgqtests < 0.1) dum <- 'OK' else dum <- 'NOK'
a<-table.element(a,dum)
a<-table.row.end(a)
a<-table.end(a)
table.save(a,file='mytable6.tab')
}