Free Statistics

of Irreproducible Research!

Author's title

Author*The author of this computation has been verified*
R Software Modulerwasp_exponentialsmoothing.wasp
Title produced by softwareExponential Smoothing
Date of computationWed, 21 Dec 2011 07:24:49 -0500
Cite this page as followsStatistical Computations at FreeStatistics.org, Office for Research Development and Education, URL https://freestatistics.org/blog/index.php?v=date/2011/Dec/21/t13244703196s3el8b7n8cvde4.htm/, Retrieved Tue, 07 May 2024 22:34:17 +0000
Statistical Computations at FreeStatistics.org, Office for Research Development and Education, URL https://freestatistics.org/blog/index.php?pk=158586, Retrieved Tue, 07 May 2024 22:34:17 +0000
QR Codes:

Original text written by user:
IsPrivate?No (this computation is public)
User-defined keywords
Estimated Impact71
Family? (F = Feedback message, R = changed R code, M = changed R Module, P = changed Parameters, D = changed Data)
-       [Exponential Smoothing] [Exponential smoot...] [2011-12-21 12:24:49] [2fa2d22b72a9c62ab85a23406d5dc0a0] [Current]
Feedback Forum

Post a new message
Dataseries X:
9911
8915
9452
9112
8472
8230
8384
8625
8221
8649
8625
10443
10357
8586
8892
8329
8101
7922
8120
7838
7735
8406
8209
9451
10041
9411
10405
8467
8464
8102
7627
7513
7510
8291
8064
9383
9706
8579
9474
8318
8213
8059
9111
7708
7680
8014
8007
8718
9486
9113
9025
8476
7952
7759
7835
7600
7651
8319
8812
8630


Summary of computational transaction
Raw Inputview raw input (R code)
Raw Outputview raw output of R engine
Computing time2 seconds
R Server'Gwilym Jenkins' @ jenkins.wessa.net

\begin{tabular}{lllllllll}
\hline
Summary of computational transaction \tabularnewline
Raw Input & view raw input (R code)  \tabularnewline
Raw Output & view raw output of R engine  \tabularnewline
Computing time & 2 seconds \tabularnewline
R Server & 'Gwilym Jenkins' @ jenkins.wessa.net \tabularnewline
\hline
\end{tabular}
%Source: https://freestatistics.org/blog/index.php?pk=158586&T=0

[TABLE]
[ROW][C]Summary of computational transaction[/C][/ROW]
[ROW][C]Raw Input[/C][C]view raw input (R code) [/C][/ROW]
[ROW][C]Raw Output[/C][C]view raw output of R engine [/C][/ROW]
[ROW][C]Computing time[/C][C]2 seconds[/C][/ROW]
[ROW][C]R Server[/C][C]'Gwilym Jenkins' @ jenkins.wessa.net[/C][/ROW]
[/TABLE]
Source: https://freestatistics.org/blog/index.php?pk=158586&T=0

Globally Unique Identifier (entire table): ba.freestatistics.org/blog/index.php?pk=158586&T=0

As an alternative you can also use a QR Code:  

The GUIDs for individual cells are displayed in the table below:

Summary of computational transaction
Raw Inputview raw input (R code)
Raw Outputview raw output of R engine
Computing time2 seconds
R Server'Gwilym Jenkins' @ jenkins.wessa.net


Estimated Parameters of Exponential Smoothing
ParameterValue
alpha0.0694632456829113
beta0.0885776433478735
gamma0.436999348997286

\begin{tabular}{lllllllll}
\hline
Estimated Parameters of Exponential Smoothing \tabularnewline
Parameter & Value \tabularnewline
alpha & 0.0694632456829113 \tabularnewline
beta & 0.0885776433478735 \tabularnewline
gamma & 0.436999348997286 \tabularnewline
\hline
\end{tabular}
%Source: https://freestatistics.org/blog/index.php?pk=158586&T=1

[TABLE]
[ROW][C]Estimated Parameters of Exponential Smoothing[/C][/ROW]
[ROW][C]Parameter[/C][C]Value[/C][/ROW]
[ROW][C]alpha[/C][C]0.0694632456829113[/C][/ROW]
[ROW][C]beta[/C][C]0.0885776433478735[/C][/ROW]
[ROW][C]gamma[/C][C]0.436999348997286[/C][/ROW]
[/TABLE]
Source: https://freestatistics.org/blog/index.php?pk=158586&T=1

Globally Unique Identifier (entire table): ba.freestatistics.org/blog/index.php?pk=158586&T=1

As an alternative you can also use a QR Code:  

The GUIDs for individual cells are displayed in the table below:

Estimated Parameters of Exponential Smoothing
ParameterValue
alpha0.0694632456829113
beta0.0885776433478735
gamma0.436999348997286


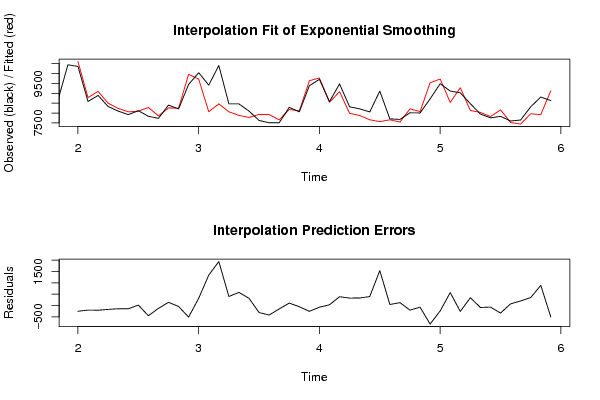
Interpolation Forecasts of Exponential Smoothing
tObservedFittedResiduals
131035710605.4670208206-248.467020820563
1485868783.22666265052-197.226662650515
1588929096.25623046977-204.256230469766
1683298496.82767224943-167.827672249428
1781018239.05329129534-138.053291295337
1879228062.5063050396-140.506305039596
1981208097.6716184881922.3283815118066
2078388284.72752910465-446.727529104646
2177357856.24343913682-121.243439136818
2284068261.68382338031144.316176619694
2382098247.66791568051-38.6679156805058
2494519958.72712230677-507.727122306775
25100419715.79966549411325.200334505895
2694118069.874068610511341.12593138949
27104058465.242492583281939.75750741672
2884678065.9298462513401.070153748702
2984647883.2172551862580.782744813801
3081027779.58993598048322.410064019523
3176277932.84926850053-305.849268500528
3275137926.31893748016-413.318937480158
3375107658.30586195388-148.305861953883
3482918181.20651162231109.79348837769
3580648113.31557929033-49.3155792903299
3693839635.47470410537-252.474704105365
3797069774.98023907322-68.9802390732202
3885798543.5205950243735.4794049756329
3994749083.46623976826390.533760231745
4083187987.66578301673330.334216983267
4182137878.60839803014334.391601969863
4280597661.2840489808397.715951019203
4391117569.274530230271541.72546976973
4477087660.2518010614847.7481989385242
4576807548.78362007696131.21637992304
4680148212.55932917365-198.559329173648
4780078076.03532431288-69.0353243128793
4887189530.5954290766-812.595429076597
4994869721.60730769928-235.60730769928
5091138539.45680505177573.543194948226
5190259281.03560502744-256.03560502744
5284768129.17471214673346.82528785327
5379528035.26545058339-83.2654505833943
5477597824.31033617256-65.3103361725616
5578358162.63164870407-327.631648704074
5676007523.8896235379476.1103764620575
5776517445.49225543182205.507744568177
5883197965.63342162489353.366578375112
5988127920.40041724079891.599582759211
6086309134.52471281817-504.524712818169

\begin{tabular}{lllllllll}
\hline
Interpolation Forecasts of Exponential Smoothing \tabularnewline
t & Observed & Fitted & Residuals \tabularnewline
13 & 10357 & 10605.4670208206 & -248.467020820563 \tabularnewline
14 & 8586 & 8783.22666265052 & -197.226662650515 \tabularnewline
15 & 8892 & 9096.25623046977 & -204.256230469766 \tabularnewline
16 & 8329 & 8496.82767224943 & -167.827672249428 \tabularnewline
17 & 8101 & 8239.05329129534 & -138.053291295337 \tabularnewline
18 & 7922 & 8062.5063050396 & -140.506305039596 \tabularnewline
19 & 8120 & 8097.67161848819 & 22.3283815118066 \tabularnewline
20 & 7838 & 8284.72752910465 & -446.727529104646 \tabularnewline
21 & 7735 & 7856.24343913682 & -121.243439136818 \tabularnewline
22 & 8406 & 8261.68382338031 & 144.316176619694 \tabularnewline
23 & 8209 & 8247.66791568051 & -38.6679156805058 \tabularnewline
24 & 9451 & 9958.72712230677 & -507.727122306775 \tabularnewline
25 & 10041 & 9715.79966549411 & 325.200334505895 \tabularnewline
26 & 9411 & 8069.87406861051 & 1341.12593138949 \tabularnewline
27 & 10405 & 8465.24249258328 & 1939.75750741672 \tabularnewline
28 & 8467 & 8065.9298462513 & 401.070153748702 \tabularnewline
29 & 8464 & 7883.2172551862 & 580.782744813801 \tabularnewline
30 & 8102 & 7779.58993598048 & 322.410064019523 \tabularnewline
31 & 7627 & 7932.84926850053 & -305.849268500528 \tabularnewline
32 & 7513 & 7926.31893748016 & -413.318937480158 \tabularnewline
33 & 7510 & 7658.30586195388 & -148.305861953883 \tabularnewline
34 & 8291 & 8181.20651162231 & 109.79348837769 \tabularnewline
35 & 8064 & 8113.31557929033 & -49.3155792903299 \tabularnewline
36 & 9383 & 9635.47470410537 & -252.474704105365 \tabularnewline
37 & 9706 & 9774.98023907322 & -68.9802390732202 \tabularnewline
38 & 8579 & 8543.52059502437 & 35.4794049756329 \tabularnewline
39 & 9474 & 9083.46623976826 & 390.533760231745 \tabularnewline
40 & 8318 & 7987.66578301673 & 330.334216983267 \tabularnewline
41 & 8213 & 7878.60839803014 & 334.391601969863 \tabularnewline
42 & 8059 & 7661.2840489808 & 397.715951019203 \tabularnewline
43 & 9111 & 7569.27453023027 & 1541.72546976973 \tabularnewline
44 & 7708 & 7660.25180106148 & 47.7481989385242 \tabularnewline
45 & 7680 & 7548.78362007696 & 131.21637992304 \tabularnewline
46 & 8014 & 8212.55932917365 & -198.559329173648 \tabularnewline
47 & 8007 & 8076.03532431288 & -69.0353243128793 \tabularnewline
48 & 8718 & 9530.5954290766 & -812.595429076597 \tabularnewline
49 & 9486 & 9721.60730769928 & -235.60730769928 \tabularnewline
50 & 9113 & 8539.45680505177 & 573.543194948226 \tabularnewline
51 & 9025 & 9281.03560502744 & -256.03560502744 \tabularnewline
52 & 8476 & 8129.17471214673 & 346.82528785327 \tabularnewline
53 & 7952 & 8035.26545058339 & -83.2654505833943 \tabularnewline
54 & 7759 & 7824.31033617256 & -65.3103361725616 \tabularnewline
55 & 7835 & 8162.63164870407 & -327.631648704074 \tabularnewline
56 & 7600 & 7523.88962353794 & 76.1103764620575 \tabularnewline
57 & 7651 & 7445.49225543182 & 205.507744568177 \tabularnewline
58 & 8319 & 7965.63342162489 & 353.366578375112 \tabularnewline
59 & 8812 & 7920.40041724079 & 891.599582759211 \tabularnewline
60 & 8630 & 9134.52471281817 & -504.524712818169 \tabularnewline
\hline
\end{tabular}
%Source: https://freestatistics.org/blog/index.php?pk=158586&T=2

[TABLE]
[ROW][C]Interpolation Forecasts of Exponential Smoothing[/C][/ROW]
[ROW][C]t[/C][C]Observed[/C][C]Fitted[/C][C]Residuals[/C][/ROW]
[ROW][C]13[/C][C]10357[/C][C]10605.4670208206[/C][C]-248.467020820563[/C][/ROW]
[ROW][C]14[/C][C]8586[/C][C]8783.22666265052[/C][C]-197.226662650515[/C][/ROW]
[ROW][C]15[/C][C]8892[/C][C]9096.25623046977[/C][C]-204.256230469766[/C][/ROW]
[ROW][C]16[/C][C]8329[/C][C]8496.82767224943[/C][C]-167.827672249428[/C][/ROW]
[ROW][C]17[/C][C]8101[/C][C]8239.05329129534[/C][C]-138.053291295337[/C][/ROW]
[ROW][C]18[/C][C]7922[/C][C]8062.5063050396[/C][C]-140.506305039596[/C][/ROW]
[ROW][C]19[/C][C]8120[/C][C]8097.67161848819[/C][C]22.3283815118066[/C][/ROW]
[ROW][C]20[/C][C]7838[/C][C]8284.72752910465[/C][C]-446.727529104646[/C][/ROW]
[ROW][C]21[/C][C]7735[/C][C]7856.24343913682[/C][C]-121.243439136818[/C][/ROW]
[ROW][C]22[/C][C]8406[/C][C]8261.68382338031[/C][C]144.316176619694[/C][/ROW]
[ROW][C]23[/C][C]8209[/C][C]8247.66791568051[/C][C]-38.6679156805058[/C][/ROW]
[ROW][C]24[/C][C]9451[/C][C]9958.72712230677[/C][C]-507.727122306775[/C][/ROW]
[ROW][C]25[/C][C]10041[/C][C]9715.79966549411[/C][C]325.200334505895[/C][/ROW]
[ROW][C]26[/C][C]9411[/C][C]8069.87406861051[/C][C]1341.12593138949[/C][/ROW]
[ROW][C]27[/C][C]10405[/C][C]8465.24249258328[/C][C]1939.75750741672[/C][/ROW]
[ROW][C]28[/C][C]8467[/C][C]8065.9298462513[/C][C]401.070153748702[/C][/ROW]
[ROW][C]29[/C][C]8464[/C][C]7883.2172551862[/C][C]580.782744813801[/C][/ROW]
[ROW][C]30[/C][C]8102[/C][C]7779.58993598048[/C][C]322.410064019523[/C][/ROW]
[ROW][C]31[/C][C]7627[/C][C]7932.84926850053[/C][C]-305.849268500528[/C][/ROW]
[ROW][C]32[/C][C]7513[/C][C]7926.31893748016[/C][C]-413.318937480158[/C][/ROW]
[ROW][C]33[/C][C]7510[/C][C]7658.30586195388[/C][C]-148.305861953883[/C][/ROW]
[ROW][C]34[/C][C]8291[/C][C]8181.20651162231[/C][C]109.79348837769[/C][/ROW]
[ROW][C]35[/C][C]8064[/C][C]8113.31557929033[/C][C]-49.3155792903299[/C][/ROW]
[ROW][C]36[/C][C]9383[/C][C]9635.47470410537[/C][C]-252.474704105365[/C][/ROW]
[ROW][C]37[/C][C]9706[/C][C]9774.98023907322[/C][C]-68.9802390732202[/C][/ROW]
[ROW][C]38[/C][C]8579[/C][C]8543.52059502437[/C][C]35.4794049756329[/C][/ROW]
[ROW][C]39[/C][C]9474[/C][C]9083.46623976826[/C][C]390.533760231745[/C][/ROW]
[ROW][C]40[/C][C]8318[/C][C]7987.66578301673[/C][C]330.334216983267[/C][/ROW]
[ROW][C]41[/C][C]8213[/C][C]7878.60839803014[/C][C]334.391601969863[/C][/ROW]
[ROW][C]42[/C][C]8059[/C][C]7661.2840489808[/C][C]397.715951019203[/C][/ROW]
[ROW][C]43[/C][C]9111[/C][C]7569.27453023027[/C][C]1541.72546976973[/C][/ROW]
[ROW][C]44[/C][C]7708[/C][C]7660.25180106148[/C][C]47.7481989385242[/C][/ROW]
[ROW][C]45[/C][C]7680[/C][C]7548.78362007696[/C][C]131.21637992304[/C][/ROW]
[ROW][C]46[/C][C]8014[/C][C]8212.55932917365[/C][C]-198.559329173648[/C][/ROW]
[ROW][C]47[/C][C]8007[/C][C]8076.03532431288[/C][C]-69.0353243128793[/C][/ROW]
[ROW][C]48[/C][C]8718[/C][C]9530.5954290766[/C][C]-812.595429076597[/C][/ROW]
[ROW][C]49[/C][C]9486[/C][C]9721.60730769928[/C][C]-235.60730769928[/C][/ROW]
[ROW][C]50[/C][C]9113[/C][C]8539.45680505177[/C][C]573.543194948226[/C][/ROW]
[ROW][C]51[/C][C]9025[/C][C]9281.03560502744[/C][C]-256.03560502744[/C][/ROW]
[ROW][C]52[/C][C]8476[/C][C]8129.17471214673[/C][C]346.82528785327[/C][/ROW]
[ROW][C]53[/C][C]7952[/C][C]8035.26545058339[/C][C]-83.2654505833943[/C][/ROW]
[ROW][C]54[/C][C]7759[/C][C]7824.31033617256[/C][C]-65.3103361725616[/C][/ROW]
[ROW][C]55[/C][C]7835[/C][C]8162.63164870407[/C][C]-327.631648704074[/C][/ROW]
[ROW][C]56[/C][C]7600[/C][C]7523.88962353794[/C][C]76.1103764620575[/C][/ROW]
[ROW][C]57[/C][C]7651[/C][C]7445.49225543182[/C][C]205.507744568177[/C][/ROW]
[ROW][C]58[/C][C]8319[/C][C]7965.63342162489[/C][C]353.366578375112[/C][/ROW]
[ROW][C]59[/C][C]8812[/C][C]7920.40041724079[/C][C]891.599582759211[/C][/ROW]
[ROW][C]60[/C][C]8630[/C][C]9134.52471281817[/C][C]-504.524712818169[/C][/ROW]
[/TABLE]
Source: https://freestatistics.org/blog/index.php?pk=158586&T=2

Globally Unique Identifier (entire table): ba.freestatistics.org/blog/index.php?pk=158586&T=2

As an alternative you can also use a QR Code:  

The GUIDs for individual cells are displayed in the table below:

Interpolation Forecasts of Exponential Smoothing
tObservedFittedResiduals
131035710605.4670208206-248.467020820563
1485868783.22666265052-197.226662650515
1588929096.25623046977-204.256230469766
1683298496.82767224943-167.827672249428
1781018239.05329129534-138.053291295337
1879228062.5063050396-140.506305039596
1981208097.6716184881922.3283815118066
2078388284.72752910465-446.727529104646
2177357856.24343913682-121.243439136818
2284068261.68382338031144.316176619694
2382098247.66791568051-38.6679156805058
2494519958.72712230677-507.727122306775
25100419715.79966549411325.200334505895
2694118069.874068610511341.12593138949
27104058465.242492583281939.75750741672
2884678065.9298462513401.070153748702
2984647883.2172551862580.782744813801
3081027779.58993598048322.410064019523
3176277932.84926850053-305.849268500528
3275137926.31893748016-413.318937480158
3375107658.30586195388-148.305861953883
3482918181.20651162231109.79348837769
3580648113.31557929033-49.3155792903299
3693839635.47470410537-252.474704105365
3797069774.98023907322-68.9802390732202
3885798543.5205950243735.4794049756329
3994749083.46623976826390.533760231745
4083187987.66578301673330.334216983267
4182137878.60839803014334.391601969863
4280597661.2840489808397.715951019203
4391117569.274530230271541.72546976973
4477087660.2518010614847.7481989385242
4576807548.78362007696131.21637992304
4680148212.55932917365-198.559329173648
4780078076.03532431288-69.0353243128793
4887189530.5954290766-812.595429076597
4994869721.60730769928-235.60730769928
5091138539.45680505177573.543194948226
5190259281.03560502744-256.03560502744
5284768129.17471214673346.82528785327
5379528035.26545058339-83.2654505833943
5477597824.31033617256-65.3103361725616
5578358162.63164870407-327.631648704074
5676007523.8896235379476.1103764620575
5776517445.49225543182205.507744568177
5883197965.63342162489353.366578375112
5988127920.40041724079891.599582759211
6086309134.52471281817-504.524712818169


Extrapolation Forecasts of Exponential Smoothing
tForecast95% Lower Bound95% Upper Bound
619587.11032471979107.813125934210066.4075235052
628759.915866494248275.592033808949244.23969917954
639127.187630204558635.068956260319619.3063041488
648247.121774204077750.833688042278743.40986036586
657959.723717237817456.731460007158462.71597446847
667766.996831665377256.333187716988277.66047561375
678006.844322303717483.653543813458530.03510079396
687561.472955030927032.604780214148090.3411298477
697536.223007378996995.938429356838076.50758540114
708106.289934562637542.479924801788670.09994432349
718254.943915574267672.847888025568837.03994312296
728829.267415936138432.093442286589226.44138958568

\begin{tabular}{lllllllll}
\hline
Extrapolation Forecasts of Exponential Smoothing \tabularnewline
t & Forecast & 95% Lower Bound & 95% Upper Bound \tabularnewline
61 & 9587.1103247197 & 9107.8131259342 & 10066.4075235052 \tabularnewline
62 & 8759.91586649424 & 8275.59203380894 & 9244.23969917954 \tabularnewline
63 & 9127.18763020455 & 8635.06895626031 & 9619.3063041488 \tabularnewline
64 & 8247.12177420407 & 7750.83368804227 & 8743.40986036586 \tabularnewline
65 & 7959.72371723781 & 7456.73146000715 & 8462.71597446847 \tabularnewline
66 & 7766.99683166537 & 7256.33318771698 & 8277.66047561375 \tabularnewline
67 & 8006.84432230371 & 7483.65354381345 & 8530.03510079396 \tabularnewline
68 & 7561.47295503092 & 7032.60478021414 & 8090.3411298477 \tabularnewline
69 & 7536.22300737899 & 6995.93842935683 & 8076.50758540114 \tabularnewline
70 & 8106.28993456263 & 7542.47992480178 & 8670.09994432349 \tabularnewline
71 & 8254.94391557426 & 7672.84788802556 & 8837.03994312296 \tabularnewline
72 & 8829.26741593613 & 8432.09344228658 & 9226.44138958568 \tabularnewline
\hline
\end{tabular}
%Source: https://freestatistics.org/blog/index.php?pk=158586&T=3

[TABLE]
[ROW][C]Extrapolation Forecasts of Exponential Smoothing[/C][/ROW]
[ROW][C]t[/C][C]Forecast[/C][C]95% Lower Bound[/C][C]95% Upper Bound[/C][/ROW]
[ROW][C]61[/C][C]9587.1103247197[/C][C]9107.8131259342[/C][C]10066.4075235052[/C][/ROW]
[ROW][C]62[/C][C]8759.91586649424[/C][C]8275.59203380894[/C][C]9244.23969917954[/C][/ROW]
[ROW][C]63[/C][C]9127.18763020455[/C][C]8635.06895626031[/C][C]9619.3063041488[/C][/ROW]
[ROW][C]64[/C][C]8247.12177420407[/C][C]7750.83368804227[/C][C]8743.40986036586[/C][/ROW]
[ROW][C]65[/C][C]7959.72371723781[/C][C]7456.73146000715[/C][C]8462.71597446847[/C][/ROW]
[ROW][C]66[/C][C]7766.99683166537[/C][C]7256.33318771698[/C][C]8277.66047561375[/C][/ROW]
[ROW][C]67[/C][C]8006.84432230371[/C][C]7483.65354381345[/C][C]8530.03510079396[/C][/ROW]
[ROW][C]68[/C][C]7561.47295503092[/C][C]7032.60478021414[/C][C]8090.3411298477[/C][/ROW]
[ROW][C]69[/C][C]7536.22300737899[/C][C]6995.93842935683[/C][C]8076.50758540114[/C][/ROW]
[ROW][C]70[/C][C]8106.28993456263[/C][C]7542.47992480178[/C][C]8670.09994432349[/C][/ROW]
[ROW][C]71[/C][C]8254.94391557426[/C][C]7672.84788802556[/C][C]8837.03994312296[/C][/ROW]
[ROW][C]72[/C][C]8829.26741593613[/C][C]8432.09344228658[/C][C]9226.44138958568[/C][/ROW]
[/TABLE]
Source: https://freestatistics.org/blog/index.php?pk=158586&T=3

Globally Unique Identifier (entire table): ba.freestatistics.org/blog/index.php?pk=158586&T=3

As an alternative you can also use a QR Code:  

The GUIDs for individual cells are displayed in the table below:

Extrapolation Forecasts of Exponential Smoothing
tForecast95% Lower Bound95% Upper Bound
619587.11032471979107.813125934210066.4075235052
628759.915866494248275.592033808949244.23969917954
639127.187630204558635.068956260319619.3063041488
648247.121774204077750.833688042278743.40986036586
657959.723717237817456.731460007158462.71597446847
667766.996831665377256.333187716988277.66047561375
678006.844322303717483.653543813458530.03510079396
687561.472955030927032.604780214148090.3411298477
697536.223007378996995.938429356838076.50758540114
708106.289934562637542.479924801788670.09994432349
718254.943915574267672.847888025568837.03994312296
728829.267415936138432.093442286589226.44138958568


Parameters (Session):
par1 = 12 ; par2 = Triple ; par3 = multiplicative ;
Parameters (R input):
par1 = 12 ; par2 = Triple ; par3 = multiplicative ;
R code (references can be found in the software module):
par1 <- as.numeric(par1)
if (par2 == 'Single') K <- 1
if (par2 == 'Double') K <- 2
if (par2 == 'Triple') K <- par1
nx <- length(x)
nxmK <- nx - K
x <- ts(x, frequency = par1)
if (par2 == 'Single') fit <- HoltWinters(x, gamma=F, beta=F)
if (par2 == 'Double') fit <- HoltWinters(x, gamma=F)
if (par2 == 'Triple') fit <- HoltWinters(x, seasonal=par3)
fit
myresid <- x - fit$fitted[,'xhat']
bitmap(file='test1.png')
op <- par(mfrow=c(2,1))
plot(fit,ylab='Observed (black) / Fitted (red)',main='Interpolation Fit of Exponential Smoothing')
plot(myresid,ylab='Residuals',main='Interpolation Prediction Errors')
par(op)
dev.off()
bitmap(file='test2.png')
p <- predict(fit, par1, prediction.interval=TRUE)
np <- length(p[,1])
plot(fit,p,ylab='Observed (black) / Fitted (red)',main='Extrapolation Fit of Exponential Smoothing')
dev.off()
bitmap(file='test3.png')
op <- par(mfrow = c(2,2))
acf(as.numeric(myresid),lag.max = nx/2,main='Residual ACF')
spectrum(myresid,main='Residals Periodogram')
cpgram(myresid,main='Residal Cumulative Periodogram')
qqnorm(myresid,main='Residual Normal QQ Plot')
qqline(myresid)
par(op)
dev.off()
load(file='createtable')
a<-table.start()
a<-table.row.start(a)
a<-table.element(a,'Estimated Parameters of Exponential Smoothing',2,TRUE)
a<-table.row.end(a)
a<-table.row.start(a)
a<-table.element(a,'Parameter',header=TRUE)
a<-table.element(a,'Value',header=TRUE)
a<-table.row.end(a)
a<-table.row.start(a)
a<-table.element(a,'alpha',header=TRUE)
a<-table.element(a,fit$alpha)
a<-table.row.end(a)
a<-table.row.start(a)
a<-table.element(a,'beta',header=TRUE)
a<-table.element(a,fit$beta)
a<-table.row.end(a)
a<-table.row.start(a)
a<-table.element(a,'gamma',header=TRUE)
a<-table.element(a,fit$gamma)
a<-table.row.end(a)
a<-table.end(a)
table.save(a,file='mytable.tab')
a<-table.start()
a<-table.row.start(a)
a<-table.element(a,'Interpolation Forecasts of Exponential Smoothing',4,TRUE)
a<-table.row.end(a)
a<-table.row.start(a)
a<-table.element(a,'t',header=TRUE)
a<-table.element(a,'Observed',header=TRUE)
a<-table.element(a,'Fitted',header=TRUE)
a<-table.element(a,'Residuals',header=TRUE)
a<-table.row.end(a)
for (i in 1:nxmK) {
a<-table.row.start(a)
a<-table.element(a,i+K,header=TRUE)
a<-table.element(a,x[i+K])
a<-table.element(a,fit$fitted[i,'xhat'])
a<-table.element(a,myresid[i])
a<-table.row.end(a)
}
a<-table.end(a)
table.save(a,file='mytable1.tab')
a<-table.start()
a<-table.row.start(a)
a<-table.element(a,'Extrapolation Forecasts of Exponential Smoothing',4,TRUE)
a<-table.row.end(a)
a<-table.row.start(a)
a<-table.element(a,'t',header=TRUE)
a<-table.element(a,'Forecast',header=TRUE)
a<-table.element(a,'95% Lower Bound',header=TRUE)
a<-table.element(a,'95% Upper Bound',header=TRUE)
a<-table.row.end(a)
for (i in 1:np) {
a<-table.row.start(a)
a<-table.element(a,nx+i,header=TRUE)
a<-table.element(a,p[i,'fit'])
a<-table.element(a,p[i,'lwr'])
a<-table.element(a,p[i,'upr'])
a<-table.row.end(a)
}
a<-table.end(a)
table.save(a,file='mytable2.tab')