Free Statistics
of Irreproducible Research!
Description of Statistical Computation | |||||||||||||||||||||||||||||||||
|---|---|---|---|---|---|---|---|---|---|---|---|---|---|---|---|---|---|---|---|---|---|---|---|---|---|---|---|---|---|---|---|---|---|
| Author's title | |||||||||||||||||||||||||||||||||
| Author | *The author of this computation has been verified* | ||||||||||||||||||||||||||||||||
| R Software Module | rwasp_meanversusmedian.wasp | ||||||||||||||||||||||||||||||||
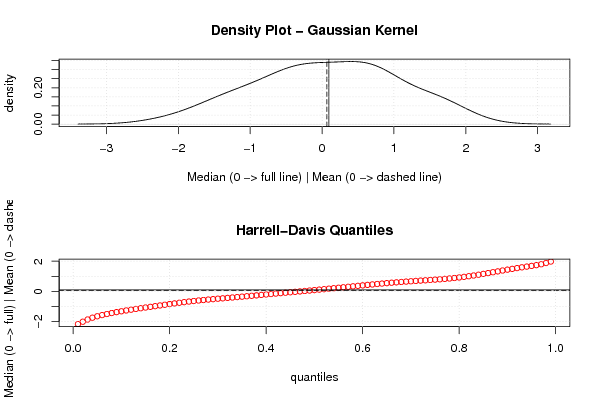
| Title produced by software | Mean versus Median | ||||||||||||||||||||||||||||||||
| Date of computation | Wed, 21 Dec 2011 07:15:11 -0500 | ||||||||||||||||||||||||||||||||
| Cite this page as follows | Statistical Computations at FreeStatistics.org, Office for Research Development and Education, URL https://freestatistics.org/blog/index.php?v=date/2011/Dec/21/t132446978546yg2lsgdq6ixyg.htm/, Retrieved Tue, 07 May 2024 18:04:23 +0000 | ||||||||||||||||||||||||||||||||
| Statistical Computations at FreeStatistics.org, Office for Research Development and Education, URL https://freestatistics.org/blog/index.php?pk=158566, Retrieved Tue, 07 May 2024 18:04:23 +0000 | |||||||||||||||||||||||||||||||||
| QR Codes: | |||||||||||||||||||||||||||||||||
|
| |||||||||||||||||||||||||||||||||
| Original text written by user: | |||||||||||||||||||||||||||||||||
| IsPrivate? | No (this computation is public) | ||||||||||||||||||||||||||||||||
| User-defined keywords | |||||||||||||||||||||||||||||||||
| Estimated Impact | 110 | ||||||||||||||||||||||||||||||||
Tree of Dependent Computations | |||||||||||||||||||||||||||||||||
| Family? (F = Feedback message, R = changed R code, M = changed R Module, P = changed Parameters, D = changed Data) | |||||||||||||||||||||||||||||||||
| - [Recursive Partitioning (Regression Trees)] [] [2010-12-05 18:59:57] [b98453cac15ba1066b407e146608df68] - RMP [Kendall tau Correlation Matrix] [ws10.1] [2011-12-14 12:44:38] [8ae0a4da1b3ee81f40dbba5e42914d07] - D [Kendall tau Correlation Matrix] [ws10.3] [2011-12-14 14:10:41] [8ae0a4da1b3ee81f40dbba5e42914d07] - RMP [Recursive Partitioning (Regression Trees)] [ws10.6] [2011-12-14 15:11:12] [8ae0a4da1b3ee81f40dbba5e42914d07] - PD [Recursive Partitioning (Regression Trees)] [ws10.9] [2011-12-21 10:12:51] [8ae0a4da1b3ee81f40dbba5e42914d07] - RMPD [Mean versus Median] [Paper, DSTSM mean...] [2011-12-21 12:15:11] [242bbde8f74d68805b56d9ecebfdbe63] [Current] | |||||||||||||||||||||||||||||||||
| Feedback Forum | |||||||||||||||||||||||||||||||||
Post a new message | |||||||||||||||||||||||||||||||||
Dataset | |||||||||||||||||||||||||||||||||
| Dataseries X: | |||||||||||||||||||||||||||||||||
0 -1.94834264125015 -1.35938514876797 1.35795496412481 -1.70069468175497 1.44996900849938 1.31903815630069 2.05149160604926 -0.133535063101566 1.03724496156112 0.63142261575917 -1.63792541267238 -0.867991128955308 -1.07958030968515 -0.672654981836742 -1.05064354962543 0.333390996185739 0.487322267446532 -0.570817054401088 -0.499534007121835 0.115264994351102 1.74691902012461 0.739021637104409 0.738226066304609 -0.41299927393743 -1.58336341056381 -0.181363817381967 0.105418963881337 -0.463545967786301 -1.21612196637376 1.64060386180114 -0.0528713661577582 1.52368500476979 1.08334468835021 -0.469412703827005 0.721118803353077 -0.943920679048537 -0.522581909811403 0.359348877235232 -0.247868668824745 0.562507597657474 0.64814873561941 -1.27010850628161 -0.447026313045732 1.78025952002197 0.731000413630024 1.58105415816898 -0.0984553656677268 -0.585819712707743 0.397301065018393 0.0963073674180238 -1.03366376752918 -0.793451126625965 0.871673983985699 0.80325982935323 1.24994658683419 -0.295993912664426 -1.45005328321816 0.767875715674426 0.609240092225543 0.933296632597031 -0.679282808379915 -1.19659266892572 0.418815651594879 -0.181297827175938 0.432789884150497 -0.065942989884464 1.73980299717976 0.328406731705262 0.120753615482844 -0.369205392526939 0.791445739642711 0.866899132578154 0.0740812251511718 -2.26488583771179 | |||||||||||||||||||||||||||||||||
Tables (Output of Computation) | |||||||||||||||||||||||||||||||||
| |||||||||||||||||||||||||||||||||
Figures (Output of Computation) | |||||||||||||||||||||||||||||||||
Input Parameters & R Code | |||||||||||||||||||||||||||||||||
| Parameters (Session): | |||||||||||||||||||||||||||||||||
| Parameters (R input): | |||||||||||||||||||||||||||||||||
| R code (references can be found in the software module): | |||||||||||||||||||||||||||||||||
library(Hmisc) | |||||||||||||||||||||||||||||||||