| Multiple Linear Regression - Estimated Regression Equation |
| Werkloosheid[t] = + 0.134592914445752 -0.0173353381347893HIPC[t] + 0.995652877920009`<25jaar`[t] + 0.999674998984029`>25jaar `[t] + 0.413885569121824M1[t] + 0.394264665980179M2[t] + 0.197348573151022M3[t] + 0.175125203463487M4[t] + 0.477773512589917M5[t] + 0.481296655114887M6[t] + 0.130781935377879M7[t] + 0.821377672137969M8[t] + 0.472003089811757M9[t] + 0.46589145621565M10[t] + 0.0183742581020222M11[t] + 0.00532474377880197t + e[t] |
| Multiple Linear Regression - Ordinary Least Squares | |||||
| Variable | Parameter | S.D. | T-STAT H0: parameter = 0 | 2-tail p-value | 1-tail p-value |
| (Intercept) | 0.134592914445752 | 1.277747 | 0.1053 | 0.916507 | 0.458253 |
| HIPC | -0.0173353381347893 | 0.06441 | -0.2691 | 0.788866 | 0.394433 |
| `<25jaar` | 0.995652877920009 | 0.019057 | 52.2472 | 0 | 0 |
| `>25jaar ` | 0.999674998984029 | 0.004868 | 205.3464 | 0 | 0 |
| M1 | 0.413885569121824 | 0.281854 | 1.4684 | 0.147895 | 0.073948 |
| M2 | 0.394264665980179 | 0.298414 | 1.3212 | 0.19211 | 0.096055 |
| M3 | 0.197348573151022 | 0.340227 | 0.58 | 0.564339 | 0.28217 |
| M4 | 0.175125203463487 | 0.37337 | 0.469 | 0.640965 | 0.320483 |
| M5 | 0.477773512589917 | 0.437854 | 1.0912 | 0.280134 | 0.140067 |
| M6 | 0.481296655114887 | 0.413914 | 1.1628 | 0.250122 | 0.125061 |
| M7 | 0.130781935377879 | 0.385958 | 0.3389 | 0.736062 | 0.368031 |
| M8 | 0.821377672137969 | 0.487373 | 1.6853 | 0.097807 | 0.048904 |
| M9 | 0.472003089811757 | 0.483698 | 0.9758 | 0.333585 | 0.166793 |
| M10 | 0.46589145621565 | 0.36735 | 1.2682 | 0.210252 | 0.105126 |
| M11 | 0.0183742581020222 | 0.298377 | 0.0616 | 0.951128 | 0.475564 |
| t | 0.00532474377880197 | 0.010974 | 0.4852 | 0.629517 | 0.314758 |
| Multiple Linear Regression - Regression Statistics | |
| Multiple R | 0.999950939884969 |
| R-squared | 0.999901882176833 |
| Adjusted R-squared | 0.999874112981597 |
| F-TEST (value) | 36007.5930785003 |
| F-TEST (DF numerator) | 15 |
| F-TEST (DF denominator) | 53 |
| p-value | 0 |
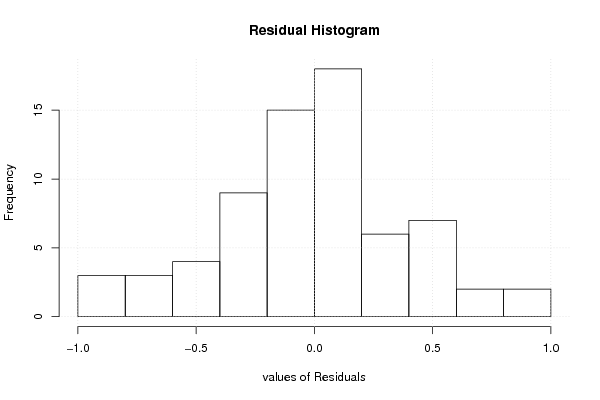
| Multiple Linear Regression - Residual Statistics | |
| Residual Standard Deviation | 0.454218614247044 |
| Sum Squared Residuals | 10.9346711250107 |
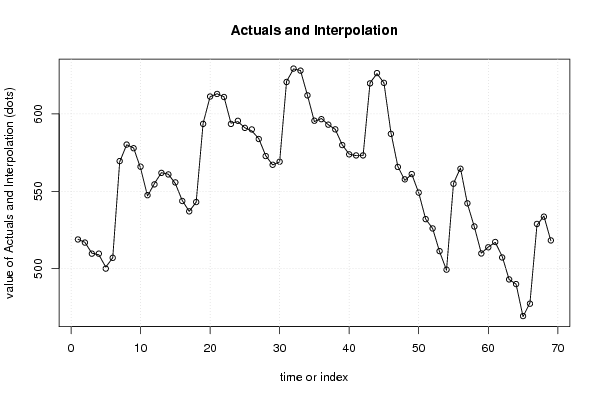
| Multiple Linear Regression - Actuals, Interpolation, and Residuals | |||
| Time or Index | Actuals | Interpolation Forecast | Residuals Prediction Error |
| 1 | 519 | 518.853515919166 | 0.146484080834441 |
| 2 | 517 | 516.849024110837 | 0.150975889163371 |
| 3 | 510 | 509.678084840405 | 0.321915159595295 |
| 4 | 509 | 509.680741766379 | -0.680741766379011 |
| 5 | 501 | 500.026498758709 | 0.973501241291069 |
| 6 | 507 | 507.010604071828 | -0.0106040718279739 |
| 7 | 569 | 569.485787723116 | -0.485787723116279 |
| 8 | 580 | 580.142814157356 | -0.142814157356346 |
| 9 | 578 | 577.801702908091 | 0.198297091908581 |
| 10 | 565 | 565.850237842546 | -0.850237842546395 |
| 11 | 547 | 547.447182481885 | -0.447182481885324 |
| 12 | 555 | 554.437613615328 | 0.562386384672181 |
| 13 | 562 | 561.863771643621 | 0.136228356378897 |
| 14 | 561 | 560.865333916093 | 0.13466608390675 |
| 15 | 555 | 555.706989487198 | -0.706989487197849 |
| 16 | 544 | 543.705988863171 | 0.294011136829467 |
| 17 | 537 | 537.028234912877 | -0.0282349128773297 |
| 18 | 543 | 543.034022686211 | -0.0340226862111535 |
| 19 | 594 | 593.521705645256 | 0.47829435474379 |
| 20 | 611 | 611.177635552761 | -0.17763555276089 |
| 21 | 613 | 612.840424900873 | 0.159575099127481 |
| 22 | 611 | 610.872951661534 | 0.127048338465896 |
| 23 | 594 | 593.483439570365 | 0.516560429635109 |
| 24 | 595 | 595.49276267352 | -0.492762673519718 |
| 25 | 591 | 590.931975063007 | 0.068024936993182 |
| 26 | 589 | 589.924869666412 | -0.924869666411577 |
| 27 | 584 | 583.74667125971 | 0.253328740290244 |
| 28 | 573 | 572.760392385551 | 0.239607614449283 |
| 29 | 567 | 567.092159583685 | -0.0921595836853566 |
| 30 | 569 | 569.089401211639 | -0.0894012116392466 |
| 31 | 621 | 620.582514824546 | 0.417485175454156 |
| 32 | 629 | 629.240191260818 | -0.240191260817835 |
| 33 | 628 | 627.894732889473 | 0.10526711052707 |
| 34 | 612 | 611.953235497059 | 0.0467645029408216 |
| 35 | 595 | 595.554730735807 | -0.554730735806614 |
| 36 | 597 | 596.55279915672 | 0.447200843279874 |
| 37 | 593 | 593.001464321133 | -0.0014643211327818 |
| 38 | 590 | 589.996187406946 | 0.00381259305411177 |
| 39 | 580 | 579.84237999732 | 0.157620002679757 |
| 40 | 574 | 573.832563605445 | 0.167436394554527 |
| 41 | 573 | 573.149460954932 | -0.149460954931777 |
| 42 | 573 | 573.159487321612 | -0.159487321611974 |
| 43 | 620 | 619.672047957668 | 0.327952042332039 |
| 44 | 626 | 626.34361923954 | -0.343619239540386 |
| 45 | 620 | 620.012475663407 | -0.0124756634067432 |
| 46 | 588 | 587.086212690704 | 0.913787309296267 |
| 47 | 566 | 565.689887987968 | 0.310112012031919 |
| 48 | 557 | 557.705859795407 | -0.705859795407286 |
| 49 | 561 | 561.12700711945 | -0.127007119449892 |
| 50 | 549 | 549.139010164849 | -0.139010164849344 |
| 51 | 532 | 531.977076559455 | 0.0229234405453909 |
| 52 | 526 | 525.974194302834 | 0.0258056971662345 |
| 53 | 511 | 511.323864887494 | -0.323864887494093 |
| 54 | 499 | 499.344657028118 | -0.344657028117554 |
| 55 | 555 | 554.85658124228 | 0.143418757719642 |
| 56 | 565 | 564.527177521105 | 0.472822478895128 |
| 57 | 542 | 542.210943363666 | -0.210943363665982 |
| 58 | 527 | 527.237362308157 | -0.23736230815659 |
| 59 | 510 | 509.824759223975 | 0.175240776024909 |
| 60 | 514 | 513.810964759025 | 0.189035240974948 |
| 61 | 517 | 517.222265933624 | -0.222265933623846 |
| 62 | 508 | 507.225574734863 | 0.774425265136689 |
| 63 | 493 | 493.048797855913 | -0.0487978559128375 |
| 64 | 490 | 490.046119076621 | -0.0461190766205004 |
| 65 | 469 | 469.379780902303 | -0.379780902302513 |
| 66 | 478 | 477.361827680592 | 0.638172319407902 |
| 67 | 528 | 528.881362607133 | -0.881362607133348 |
| 68 | 534 | 533.56856226842 | 0.431437731580329 |
| 69 | 518 | 518.23972027449 | -0.239720274490408 |
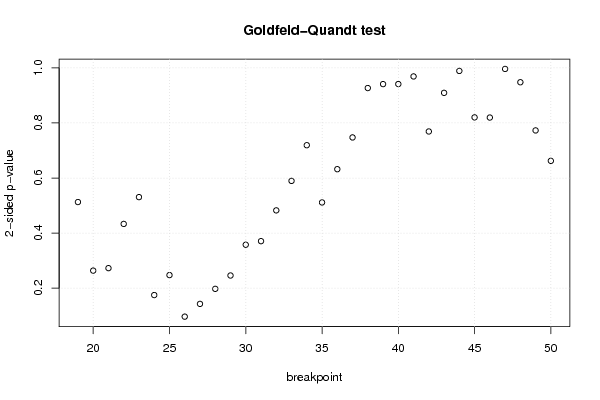
| Goldfeld-Quandt test for Heteroskedasticity | |||
| p-values | Alternative Hypothesis | ||
| breakpoint index | greater | 2-sided | less |
| 19 | 0.256377376576549 | 0.512754753153097 | 0.743622623423451 |
| 20 | 0.131799723572978 | 0.263599447145955 | 0.868200276427022 |
| 21 | 0.136285766235867 | 0.272571532471735 | 0.863714233764133 |
| 22 | 0.783380275755495 | 0.433239448489011 | 0.216619724244505 |
| 23 | 0.734683817396694 | 0.530632365206612 | 0.265316182603306 |
| 24 | 0.91256475255338 | 0.174870494893241 | 0.0874352474466203 |
| 25 | 0.876363899224203 | 0.247272201551595 | 0.123636100775797 |
| 26 | 0.951810296749297 | 0.0963794065014062 | 0.0481897032507031 |
| 27 | 0.928653080596334 | 0.142693838807331 | 0.0713469194036656 |
| 28 | 0.901280446022351 | 0.197439107955297 | 0.0987195539776487 |
| 29 | 0.877070184153862 | 0.245859631692277 | 0.122929815846138 |
| 30 | 0.821214809834594 | 0.357570380330813 | 0.178785190165406 |
| 31 | 0.814662679484058 | 0.370674641031883 | 0.185337320515942 |
| 32 | 0.7587970224945 | 0.482405955011 | 0.2412029775055 |
| 33 | 0.705243380794284 | 0.589513238411433 | 0.294756619205716 |
| 34 | 0.640435767999177 | 0.719128464001647 | 0.359564232000823 |
| 35 | 0.744414139406771 | 0.511171721186458 | 0.255585860593229 |
| 36 | 0.683973809415651 | 0.632052381168697 | 0.316026190584348 |
| 37 | 0.626313902401912 | 0.747372195196177 | 0.373686097598088 |
| 38 | 0.536582152126375 | 0.92683569574725 | 0.463417847873625 |
| 39 | 0.470581410531836 | 0.941162821063671 | 0.529418589468164 |
| 40 | 0.470624333922056 | 0.941248667844112 | 0.529375666077944 |
| 41 | 0.484488174033507 | 0.968976348067013 | 0.515511825966493 |
| 42 | 0.384515935224116 | 0.769031870448232 | 0.615484064775884 |
| 43 | 0.454684560559389 | 0.909369121118778 | 0.545315439440611 |
| 44 | 0.50551077991921 | 0.988978440161581 | 0.49448922008079 |
| 45 | 0.589837754315135 | 0.82032449136973 | 0.410162245684865 |
| 46 | 0.590191948954747 | 0.819616102090505 | 0.409808051045253 |
| 47 | 0.501909697124783 | 0.996180605750434 | 0.498090302875217 |
| 48 | 0.526042925816957 | 0.947914148366085 | 0.473957074183043 |
| 49 | 0.386437329749664 | 0.772874659499328 | 0.613562670250336 |
| 50 | 0.331164266241646 | 0.662328532483292 | 0.668835733758354 |
| Meta Analysis of Goldfeld-Quandt test for Heteroskedasticity | |||
| Description | # significant tests | % significant tests | OK/NOK |
| 1% type I error level | 0 | 0 | OK |
| 5% type I error level | 0 | 0 | OK |
| 10% type I error level | 1 | 0.03125 | OK |