| Multiple Linear Regression - Estimated Regression Equation |
| X[t] = + 25.7267919840376 -0.00823946509526631Y[t] + 1.23002986579692Y1[t] -0.467759327195805Y2[t] + 0.0460425932424228t + e[t] |
| Multiple Linear Regression - Ordinary Least Squares | |||||
| Variable | Parameter | S.D. | T-STAT H0: parameter = 0 | 2-tail p-value | 1-tail p-value |
| (Intercept) | 25.7267919840376 | 4.255304 | 6.0458 | 0 | 0 |
| Y | -0.00823946509526631 | 0.002317 | -3.5568 | 0.000832 | 0.000416 |
| Y1 | 1.23002986579692 | 0.157414 | 7.814 | 0 | 0 |
| Y2 | -0.467759327195805 | 0.163279 | -2.8648 | 0.006087 | 0.003043 |
| t | 0.0460425932424228 | 0.004376 | 10.5206 | 0 | 0 |
| Multiple Linear Regression - Regression Statistics | |
| Multiple R | 0.996714490043566 |
| R-squared | 0.993439774662806 |
| Adjusted R-squared | 0.99291495663583 |
| F-TEST (value) | 1892.9223532734 |
| F-TEST (DF numerator) | 4 |
| F-TEST (DF denominator) | 50 |
| p-value | 0 |
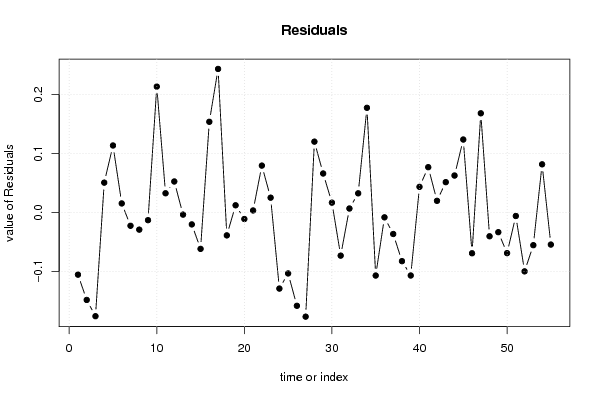
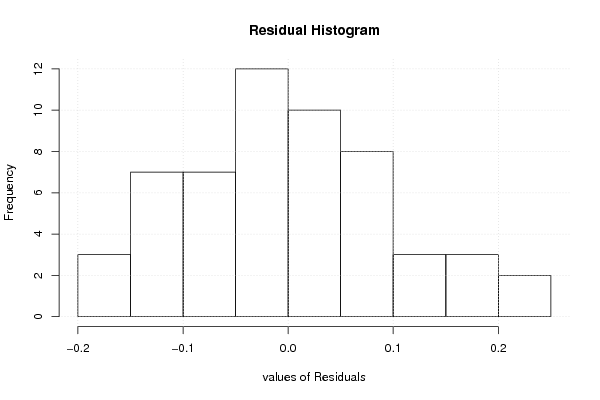
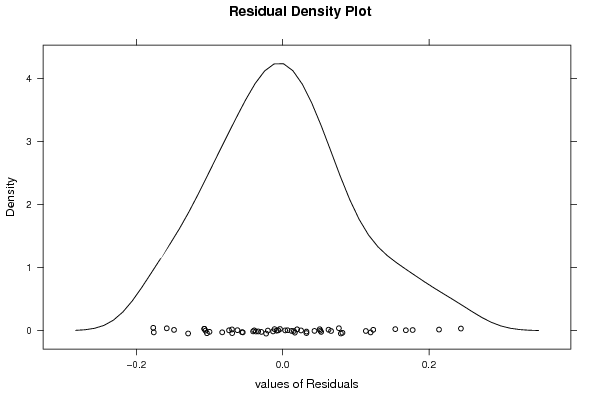
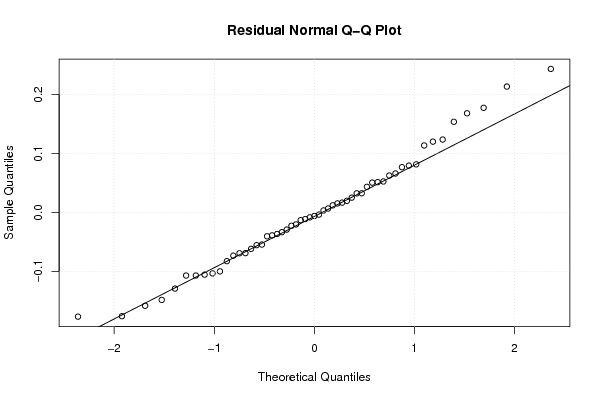
| Multiple Linear Regression - Residual Statistics | |
| Residual Standard Deviation | 0.0992785185599964 |
| Sum Squared Residuals | 0.492811212373378 |
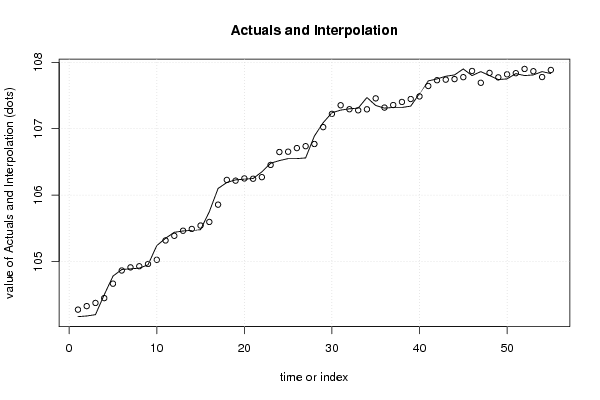
| Multiple Linear Regression - Actuals, Interpolation, and Residuals | |||
| Time or Index | Actuals | Interpolation Forecast | Residuals Prediction Error |
| 1 | 104.17 | 104.275639259676 | -0.105639259676094 |
| 2 | 104.18 | 104.328551832149 | -0.148551832148692 |
| 3 | 104.2 | 104.376216629256 | -0.176216629256249 |
| 4 | 104.5 | 104.449390558328 | 0.0506094416718705 |
| 5 | 104.78 | 104.666314424533 | 0.11368557546681 |
| 6 | 104.88 | 104.864714215988 | 0.0152857840116471 |
| 7 | 104.89 | 104.912662220941 | -0.0226622209412982 |
| 8 | 104.9 | 104.929198548333 | -0.0291985483331952 |
| 9 | 104.95 | 104.963148029718 | -0.0131480297179208 |
| 10 | 105.24 | 105.026316802706 | 0.213683197294379 |
| 11 | 105.35 | 105.317456834459 | 0.0325431655409587 |
| 12 | 105.44 | 105.387449009061 | 0.0525509909394802 |
| 13 | 105.46 | 105.463695449599 | -0.00369544959942088 |
| 14 | 105.47 | 105.490326321906 | -0.0203263219058953 |
| 15 | 105.48 | 105.541844765776 | -0.0618447657758781 |
| 16 | 105.75 | 105.596067925129 | 0.153932074871353 |
| 17 | 106.1 | 105.856366461414 | 0.243633538586029 |
| 18 | 106.19 | 106.228948112561 | -0.0389481125614406 |
| 19 | 106.23 | 106.217857896659 | 0.0121421033406027 |
| 20 | 106.24 | 106.251169729873 | -0.0111697298725329 |
| 21 | 106.25 | 106.246634121941 | 0.00336587805922372 |
| 22 | 106.35 | 106.270489058411 | 0.0795109415890903 |
| 23 | 106.48 | 106.454923536129 | 0.025076463871186 |
| 24 | 106.52 | 106.649288183175 | -0.129288183175192 |
| 25 | 106.55 | 106.653536533278 | -0.103536533277762 |
| 26 | 106.55 | 106.708499051001 | -0.15849905100119 |
| 27 | 106.56 | 106.736946992604 | -0.176946992604427 |
| 28 | 106.89 | 106.769806441694 | 0.120193558305575 |
| 29 | 107.09 | 107.023894569673 | 0.0661054303269172 |
| 30 | 107.24 | 107.223363504961 | 0.0166364950394013 |
| 31 | 107.28 | 107.353357567648 | -0.0733575676481975 |
| 32 | 107.3 | 107.293338090008 | 0.00666190999230533 |
| 33 | 107.31 | 107.277559005882 | 0.0324409941183069 |
| 34 | 107.47 | 107.292350530747 | 0.177649469252969 |
| 35 | 107.35 | 107.457128090206 | -0.107128090206176 |
| 36 | 107.31 | 107.318323050332 | -0.00832305033209918 |
| 37 | 107.32 | 107.356608018158 | -0.0366080181584469 |
| 38 | 107.32 | 107.402701989709 | -0.0827019897087135 |
| 39 | 107.34 | 107.447096689932 | -0.107096689932073 |
| 40 | 107.53 | 107.486547711098 | 0.0434522889017152 |
| 41 | 107.72 | 107.643175194293 | 0.076824805707429 |
| 42 | 107.75 | 107.730281227271 | 0.0197187727293465 |
| 43 | 107.79 | 107.738611299398 | 0.051388700601715 |
| 44 | 107.81 | 107.747340703772 | 0.0626592962277002 |
| 45 | 107.9 | 107.776203018976 | 0.123796981023928 |
| 46 | 107.8 | 107.869330441937 | -0.0693304419374058 |
| 47 | 107.86 | 107.6916516283 | 0.168348371699751 |
| 48 | 107.8 | 107.840460506387 | -0.0404605063874901 |
| 49 | 107.74 | 107.773530958288 | -0.0335309582883204 |
| 50 | 107.75 | 107.819087957577 | -0.0690879575766127 |
| 51 | 107.83 | 107.836052026354 | -0.00605202635432783 |
| 52 | 107.8 | 107.900044745852 | -0.100044745851548 |
| 53 | 107.81 | 107.865609386931 | -0.055609386931089 |
| 54 | 107.86 | 107.778314052048 | 0.0816859479520487 |
| 55 | 107.83 | 107.884579087962 | -0.0545790879620511 |
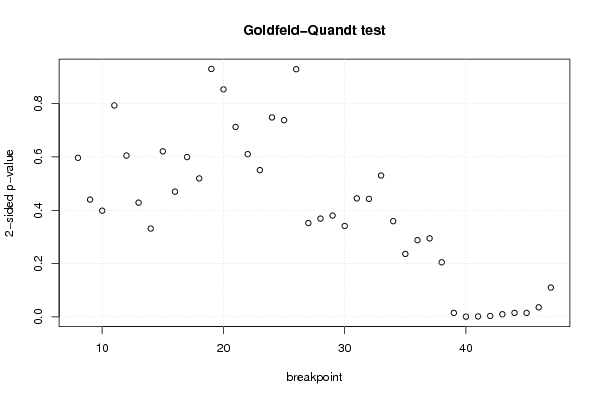
| Goldfeld-Quandt test for Heteroskedasticity | |||
| p-values | Alternative Hypothesis | ||
| breakpoint index | greater | 2-sided | less |
| 8 | 0.298429858298508 | 0.596859716597015 | 0.701570141701492 |
| 9 | 0.219985427784869 | 0.439970855569738 | 0.780014572215131 |
| 10 | 0.199185290155082 | 0.398370580310165 | 0.800814709844918 |
| 11 | 0.396651714677678 | 0.793303429355355 | 0.603348285322322 |
| 12 | 0.302660559761817 | 0.605321119523635 | 0.697339440238183 |
| 13 | 0.214264623106671 | 0.428529246213342 | 0.785735376893329 |
| 14 | 0.165717216432383 | 0.331434432864765 | 0.834282783567618 |
| 15 | 0.310558800216652 | 0.621117600433305 | 0.689441199783348 |
| 16 | 0.23488793915442 | 0.46977587830884 | 0.76511206084558 |
| 17 | 0.299781612672298 | 0.599563225344596 | 0.700218387327702 |
| 18 | 0.259734300348109 | 0.519468600696219 | 0.740265699651891 |
| 19 | 0.465147029729899 | 0.930294059459798 | 0.534852970270101 |
| 20 | 0.426889965357867 | 0.853779930715735 | 0.573110034642133 |
| 21 | 0.356378067002497 | 0.712756134004995 | 0.643621932997503 |
| 22 | 0.305305948672438 | 0.610611897344876 | 0.694694051327562 |
| 23 | 0.275277823288412 | 0.550555646576824 | 0.724722176711588 |
| 24 | 0.374136247882152 | 0.748272495764304 | 0.625863752117848 |
| 25 | 0.369049459594723 | 0.738098919189445 | 0.630950540405277 |
| 26 | 0.535338425912686 | 0.929323148174629 | 0.464661574087314 |
| 27 | 0.824045002821466 | 0.351909994357067 | 0.175954997178534 |
| 28 | 0.815684783386359 | 0.368630433227283 | 0.184315216613641 |
| 29 | 0.809991759838703 | 0.380016480322594 | 0.190008240161297 |
| 30 | 0.829566346781312 | 0.340867306437376 | 0.170433653218688 |
| 31 | 0.777720363663319 | 0.444559272673362 | 0.222279636336681 |
| 32 | 0.77867596164427 | 0.442648076711461 | 0.22132403835573 |
| 33 | 0.734845772368149 | 0.530308455263703 | 0.265154227631851 |
| 34 | 0.820549678207008 | 0.358900643585985 | 0.179450321792992 |
| 35 | 0.881955821616107 | 0.236088356767786 | 0.118044178383893 |
| 36 | 0.856090610574506 | 0.287818778850988 | 0.143909389425494 |
| 37 | 0.852749143526537 | 0.294501712946926 | 0.147250856473463 |
| 38 | 0.89764607714641 | 0.204707845707181 | 0.10235392285359 |
| 39 | 0.992587634848458 | 0.0148247303030845 | 0.00741236515154226 |
| 40 | 0.999651433617108 | 0.000697132765784526 | 0.000348566382892263 |
| 41 | 0.99919914557771 | 0.00160170884457977 | 0.000800854422289883 |
| 42 | 0.99835162010041 | 0.00329675979918061 | 0.00164837989959031 |
| 43 | 0.995124887062692 | 0.00975022587461678 | 0.00487511293730839 |
| 44 | 0.9925743493609 | 0.0148513012782007 | 0.00742565063910034 |
| 45 | 0.992623885338347 | 0.0147522293233067 | 0.00737611466165335 |
| 46 | 0.982112848344395 | 0.0357743033112107 | 0.0178871516556053 |
| 47 | 0.945021915079631 | 0.109956169840738 | 0.0549780849203692 |
| Meta Analysis of Goldfeld-Quandt test for Heteroskedasticity | |||
| Description | # significant tests | % significant tests | OK/NOK |
| 1% type I error level | 4 | 0.1 | NOK |
| 5% type I error level | 8 | 0.2 | NOK |
| 10% type I error level | 8 | 0.2 | NOK |