Free Statistics

of Irreproducible Research!

Author's title

Author*The author of this computation has been verified*
R Software Modulerwasp_smp.wasp
Title produced by softwareStandard Deviation-Mean Plot
Date of computationTue, 20 Dec 2011 09:39:46 -0500
Cite this page as followsStatistical Computations at FreeStatistics.org, Office for Research Development and Education, URL https://freestatistics.org/blog/index.php?v=date/2011/Dec/20/t13243920147i6qmsqvq1mgebt.htm/, Retrieved Mon, 06 May 2024 04:05:50 +0000
Statistical Computations at FreeStatistics.org, Office for Research Development and Education, URL https://freestatistics.org/blog/index.php?pk=157976, Retrieved Mon, 06 May 2024 04:05:50 +0000
QR Codes:

Original text written by user:
IsPrivate?No (this computation is public)
User-defined keywords
Estimated Impact107
Family? (F = Feedback message, R = changed R code, M = changed R Module, P = changed Parameters, D = changed Data)
-     [(Partial) Autocorrelation Function] [] [2011-12-05 11:42:22] [aba4febe8a2e49e81bdc61a6c01f5c21]
- RMPD  [Variance Reduction Matrix] [Variance Reductio...] [2011-12-20 13:59:28] [aba4febe8a2e49e81bdc61a6c01f5c21]
- RMP     [Standard Deviation-Mean Plot] [] [2011-12-20 14:38:17] [aba4febe8a2e49e81bdc61a6c01f5c21]
- R           [Standard Deviation-Mean Plot] [Standard Deviatio...] [2011-12-20 14:39:46] [3627de22d386f4cb93d383ef7c1ade7f] [Current]
Feedback Forum

Post a new message
Dataseries X:
1418
869
1530
2172
901
463
3201
371
1192
1583
1439
1764
1495
1373
2187
1491
4041
1706
2152
1036
1882
1929
2242
1220
1289
2515
2147
2352
1638
1222
1812
1677
1579
1731
807
2452
829
1940
2662
186
1499
865
1793
2527
2747
1324
2702
1383
1179
2099
4308
918
1831
3373
1713
1438
496
2253
744
1161
2352
2144
4691
1112
2694
1973
1769
3148
2474
2084
1954
1226
1389
1496
2269
1833
1268
1943
893
1762
1403
1425
1857
1840
1502
1441
1420
1416
2970
1317
1644
870
1654
1054
937
3004
2008
2547
1885
1626
1468
2445
1964
1381
1369
1659
2888
1290
2845
1982
1904
1391
602
1743
1559
2014
2143
2146
874
1590
1590
1210
2072
1281
1401
834
1105
1272
1944
391
761
1605
530
1988
1386
2395
387
1742
620
449
800
1684
1050
2699
1606
1502
1204
1138
568
1459
2158
1111
1421
2833
1955
2922
1002
1060
956
2186
3604
1035
1417
3261
1587
1424
1701
1249
946
1926
3352
1641
2035
2312
1369
1577
2201
961
1900
1254
1335
1597
207
1645
2429
151
474
141
1639
872
1318
1018
1383
1314
1335
1403
910
616
1407
771
766
473
1376
1232
1521
572
1059
1544
1230
1206
1205
1255
613
721
1109
740
1126
728
689
592
995
1613
2048
705
301
1803
799
861
1186
1451
628
1161
1463
742
979
675
1241
676
1049
620
1081
1688
736
617
812
1051
1656
705
945
554
1597
982
222
1212
1143
435
532
882
608
459
578
826
509
717
637
857
830
652
707
954
1461
672
778
1141
680
1090
616
285
1145
733
888
849
1182
528
642
947
819
757
894


Summary of computational transaction
Raw Inputview raw input (R code)
Raw Outputview raw output of R engine
Computing time1 seconds
R Server'Gertrude Mary Cox' @ cox.wessa.net

\begin{tabular}{lllllllll}
\hline
Summary of computational transaction \tabularnewline
Raw Input & view raw input (R code)  \tabularnewline
Raw Output & view raw output of R engine  \tabularnewline
Computing time & 1 seconds \tabularnewline
R Server & 'Gertrude Mary Cox' @ cox.wessa.net \tabularnewline
\hline
\end{tabular}
%Source: https://freestatistics.org/blog/index.php?pk=157976&T=0

[TABLE]
[ROW][C]Summary of computational transaction[/C][/ROW]
[ROW][C]Raw Input[/C][C]view raw input (R code) [/C][/ROW]
[ROW][C]Raw Output[/C][C]view raw output of R engine [/C][/ROW]
[ROW][C]Computing time[/C][C]1 seconds[/C][/ROW]
[ROW][C]R Server[/C][C]'Gertrude Mary Cox' @ cox.wessa.net[/C][/ROW]
[/TABLE]
Source: https://freestatistics.org/blog/index.php?pk=157976&T=0

Globally Unique Identifier (entire table): ba.freestatistics.org/blog/index.php?pk=157976&T=0

As an alternative you can also use a QR Code:  

The GUIDs for individual cells are displayed in the table below:

Summary of computational transaction
Raw Inputview raw input (R code)
Raw Outputview raw output of R engine
Computing time1 seconds
R Server'Gertrude Mary Cox' @ cox.wessa.net


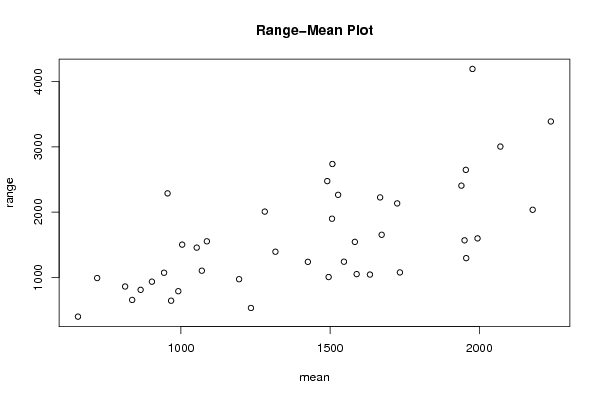
Standard Deviation-Mean Plot
SectionMeanStandard DeviationRange
11507.71428571429929.5629285289072738
21316.71428571429452.9182097927891393
32070.71428571429955.4656306893363005
41956.28571428571512.3292282265751295
51495.14285714286356.9983326625061005
61490.42857142857915.5662832627792476
71950.71428571429691.1455983331141568
822401184.348766200233390
91977.285714285711413.623678622394195
102179.14285714286664.4873785035172036
111633.57142857143392.5798675186391043
121589373.2688932481071050
131672.85714285714580.6474629157321653
141724.85714285714836.5469559587252134
151734391.8919919229451076
161994.14285714286645.9012898194861598
171583620.1542818793831544
181425.42857142857385.1137741598181238
191086.85714285714568.3694304972861553
201281805.4783257998532008
211506.42857142857614.0743324014491899
221526.85714285714748.7450452972252265
2319551033.995970333862648
241667.71428571429735.3100738884952226
251940.14285714286768.6380657959092406
261546.42857142857414.3090059134031240
27955.142857142857932.4259449721162288
281234.71428571429204.985946092014531
29902.714285714286360.845171916209934
301194.85714285714325.938863680204972
31967265.328098775836642
321052.85714285714559.5734770255611456
331004.14285714286511.4347232936731502
34991309.679942306031788
35943.285714285714377.6946360424491071
361070417.200191754511102
37719.142857142857370.663561994535990
38654.714285714286152.683457176074398
39864.857142857143282.699150200013809
40812.857142857143325.632424967902860
41836.428571428571211.225674846326654

\begin{tabular}{lllllllll}
\hline
Standard Deviation-Mean Plot \tabularnewline
Section & Mean & Standard Deviation & Range \tabularnewline
1 & 1507.71428571429 & 929.562928528907 & 2738 \tabularnewline
2 & 1316.71428571429 & 452.918209792789 & 1393 \tabularnewline
3 & 2070.71428571429 & 955.465630689336 & 3005 \tabularnewline
4 & 1956.28571428571 & 512.329228226575 & 1295 \tabularnewline
5 & 1495.14285714286 & 356.998332662506 & 1005 \tabularnewline
6 & 1490.42857142857 & 915.566283262779 & 2476 \tabularnewline
7 & 1950.71428571429 & 691.145598333114 & 1568 \tabularnewline
8 & 2240 & 1184.34876620023 & 3390 \tabularnewline
9 & 1977.28571428571 & 1413.62367862239 & 4195 \tabularnewline
10 & 2179.14285714286 & 664.487378503517 & 2036 \tabularnewline
11 & 1633.57142857143 & 392.579867518639 & 1043 \tabularnewline
12 & 1589 & 373.268893248107 & 1050 \tabularnewline
13 & 1672.85714285714 & 580.647462915732 & 1653 \tabularnewline
14 & 1724.85714285714 & 836.546955958725 & 2134 \tabularnewline
15 & 1734 & 391.891991922945 & 1076 \tabularnewline
16 & 1994.14285714286 & 645.901289819486 & 1598 \tabularnewline
17 & 1583 & 620.154281879383 & 1544 \tabularnewline
18 & 1425.42857142857 & 385.113774159818 & 1238 \tabularnewline
19 & 1086.85714285714 & 568.369430497286 & 1553 \tabularnewline
20 & 1281 & 805.478325799853 & 2008 \tabularnewline
21 & 1506.42857142857 & 614.074332401449 & 1899 \tabularnewline
22 & 1526.85714285714 & 748.745045297225 & 2265 \tabularnewline
23 & 1955 & 1033.99597033386 & 2648 \tabularnewline
24 & 1667.71428571429 & 735.310073888495 & 2226 \tabularnewline
25 & 1940.14285714286 & 768.638065795909 & 2406 \tabularnewline
26 & 1546.42857142857 & 414.309005913403 & 1240 \tabularnewline
27 & 955.142857142857 & 932.425944972116 & 2288 \tabularnewline
28 & 1234.71428571429 & 204.985946092014 & 531 \tabularnewline
29 & 902.714285714286 & 360.845171916209 & 934 \tabularnewline
30 & 1194.85714285714 & 325.938863680204 & 972 \tabularnewline
31 & 967 & 265.328098775836 & 642 \tabularnewline
32 & 1052.85714285714 & 559.573477025561 & 1456 \tabularnewline
33 & 1004.14285714286 & 511.434723293673 & 1502 \tabularnewline
34 & 991 & 309.679942306031 & 788 \tabularnewline
35 & 943.285714285714 & 377.694636042449 & 1071 \tabularnewline
36 & 1070 & 417.20019175451 & 1102 \tabularnewline
37 & 719.142857142857 & 370.663561994535 & 990 \tabularnewline
38 & 654.714285714286 & 152.683457176074 & 398 \tabularnewline
39 & 864.857142857143 & 282.699150200013 & 809 \tabularnewline
40 & 812.857142857143 & 325.632424967902 & 860 \tabularnewline
41 & 836.428571428571 & 211.225674846326 & 654 \tabularnewline
\hline
\end{tabular}
%Source: https://freestatistics.org/blog/index.php?pk=157976&T=1

[TABLE]
[ROW][C]Standard Deviation-Mean Plot[/C][/ROW]
[ROW][C]Section[/C][C]Mean[/C][C]Standard Deviation[/C][C]Range[/C][/ROW]
[ROW][C]1[/C][C]1507.71428571429[/C][C]929.562928528907[/C][C]2738[/C][/ROW]
[ROW][C]2[/C][C]1316.71428571429[/C][C]452.918209792789[/C][C]1393[/C][/ROW]
[ROW][C]3[/C][C]2070.71428571429[/C][C]955.465630689336[/C][C]3005[/C][/ROW]
[ROW][C]4[/C][C]1956.28571428571[/C][C]512.329228226575[/C][C]1295[/C][/ROW]
[ROW][C]5[/C][C]1495.14285714286[/C][C]356.998332662506[/C][C]1005[/C][/ROW]
[ROW][C]6[/C][C]1490.42857142857[/C][C]915.566283262779[/C][C]2476[/C][/ROW]
[ROW][C]7[/C][C]1950.71428571429[/C][C]691.145598333114[/C][C]1568[/C][/ROW]
[ROW][C]8[/C][C]2240[/C][C]1184.34876620023[/C][C]3390[/C][/ROW]
[ROW][C]9[/C][C]1977.28571428571[/C][C]1413.62367862239[/C][C]4195[/C][/ROW]
[ROW][C]10[/C][C]2179.14285714286[/C][C]664.487378503517[/C][C]2036[/C][/ROW]
[ROW][C]11[/C][C]1633.57142857143[/C][C]392.579867518639[/C][C]1043[/C][/ROW]
[ROW][C]12[/C][C]1589[/C][C]373.268893248107[/C][C]1050[/C][/ROW]
[ROW][C]13[/C][C]1672.85714285714[/C][C]580.647462915732[/C][C]1653[/C][/ROW]
[ROW][C]14[/C][C]1724.85714285714[/C][C]836.546955958725[/C][C]2134[/C][/ROW]
[ROW][C]15[/C][C]1734[/C][C]391.891991922945[/C][C]1076[/C][/ROW]
[ROW][C]16[/C][C]1994.14285714286[/C][C]645.901289819486[/C][C]1598[/C][/ROW]
[ROW][C]17[/C][C]1583[/C][C]620.154281879383[/C][C]1544[/C][/ROW]
[ROW][C]18[/C][C]1425.42857142857[/C][C]385.113774159818[/C][C]1238[/C][/ROW]
[ROW][C]19[/C][C]1086.85714285714[/C][C]568.369430497286[/C][C]1553[/C][/ROW]
[ROW][C]20[/C][C]1281[/C][C]805.478325799853[/C][C]2008[/C][/ROW]
[ROW][C]21[/C][C]1506.42857142857[/C][C]614.074332401449[/C][C]1899[/C][/ROW]
[ROW][C]22[/C][C]1526.85714285714[/C][C]748.745045297225[/C][C]2265[/C][/ROW]
[ROW][C]23[/C][C]1955[/C][C]1033.99597033386[/C][C]2648[/C][/ROW]
[ROW][C]24[/C][C]1667.71428571429[/C][C]735.310073888495[/C][C]2226[/C][/ROW]
[ROW][C]25[/C][C]1940.14285714286[/C][C]768.638065795909[/C][C]2406[/C][/ROW]
[ROW][C]26[/C][C]1546.42857142857[/C][C]414.309005913403[/C][C]1240[/C][/ROW]
[ROW][C]27[/C][C]955.142857142857[/C][C]932.425944972116[/C][C]2288[/C][/ROW]
[ROW][C]28[/C][C]1234.71428571429[/C][C]204.985946092014[/C][C]531[/C][/ROW]
[ROW][C]29[/C][C]902.714285714286[/C][C]360.845171916209[/C][C]934[/C][/ROW]
[ROW][C]30[/C][C]1194.85714285714[/C][C]325.938863680204[/C][C]972[/C][/ROW]
[ROW][C]31[/C][C]967[/C][C]265.328098775836[/C][C]642[/C][/ROW]
[ROW][C]32[/C][C]1052.85714285714[/C][C]559.573477025561[/C][C]1456[/C][/ROW]
[ROW][C]33[/C][C]1004.14285714286[/C][C]511.434723293673[/C][C]1502[/C][/ROW]
[ROW][C]34[/C][C]991[/C][C]309.679942306031[/C][C]788[/C][/ROW]
[ROW][C]35[/C][C]943.285714285714[/C][C]377.694636042449[/C][C]1071[/C][/ROW]
[ROW][C]36[/C][C]1070[/C][C]417.20019175451[/C][C]1102[/C][/ROW]
[ROW][C]37[/C][C]719.142857142857[/C][C]370.663561994535[/C][C]990[/C][/ROW]
[ROW][C]38[/C][C]654.714285714286[/C][C]152.683457176074[/C][C]398[/C][/ROW]
[ROW][C]39[/C][C]864.857142857143[/C][C]282.699150200013[/C][C]809[/C][/ROW]
[ROW][C]40[/C][C]812.857142857143[/C][C]325.632424967902[/C][C]860[/C][/ROW]
[ROW][C]41[/C][C]836.428571428571[/C][C]211.225674846326[/C][C]654[/C][/ROW]
[/TABLE]
Source: https://freestatistics.org/blog/index.php?pk=157976&T=1

Globally Unique Identifier (entire table): ba.freestatistics.org/blog/index.php?pk=157976&T=1

As an alternative you can also use a QR Code:  

The GUIDs for individual cells are displayed in the table below:

Standard Deviation-Mean Plot
SectionMeanStandard DeviationRange
11507.71428571429929.5629285289072738
21316.71428571429452.9182097927891393
32070.71428571429955.4656306893363005
41956.28571428571512.3292282265751295
51495.14285714286356.9983326625061005
61490.42857142857915.5662832627792476
71950.71428571429691.1455983331141568
822401184.348766200233390
91977.285714285711413.623678622394195
102179.14285714286664.4873785035172036
111633.57142857143392.5798675186391043
121589373.2688932481071050
131672.85714285714580.6474629157321653
141724.85714285714836.5469559587252134
151734391.8919919229451076
161994.14285714286645.9012898194861598
171583620.1542818793831544
181425.42857142857385.1137741598181238
191086.85714285714568.3694304972861553
201281805.4783257998532008
211506.42857142857614.0743324014491899
221526.85714285714748.7450452972252265
2319551033.995970333862648
241667.71428571429735.3100738884952226
251940.14285714286768.6380657959092406
261546.42857142857414.3090059134031240
27955.142857142857932.4259449721162288
281234.71428571429204.985946092014531
29902.714285714286360.845171916209934
301194.85714285714325.938863680204972
31967265.328098775836642
321052.85714285714559.5734770255611456
331004.14285714286511.4347232936731502
34991309.679942306031788
35943.285714285714377.6946360424491071
361070417.200191754511102
37719.142857142857370.663561994535990
38654.714285714286152.683457176074398
39864.857142857143282.699150200013809
40812.857142857143325.632424967902860
41836.428571428571211.225674846326654


Regression: S.E.(k) = alpha + beta * Mean(k)
alpha-12.9802941906851
beta0.414241094356447
S.D.0.0798174271924948
T-STAT5.18985776574114
p-value6.86825446267188e-06

\begin{tabular}{lllllllll}
\hline
Regression: S.E.(k) = alpha + beta * Mean(k) \tabularnewline
alpha & -12.9802941906851 \tabularnewline
beta & 0.414241094356447 \tabularnewline
S.D. & 0.0798174271924948 \tabularnewline
T-STAT & 5.18985776574114 \tabularnewline
p-value & 6.86825446267188e-06 \tabularnewline
\hline
\end{tabular}
%Source: https://freestatistics.org/blog/index.php?pk=157976&T=2

[TABLE]
[ROW][C]Regression: S.E.(k) = alpha + beta * Mean(k)[/C][/ROW]
[ROW][C]alpha[/C][C]-12.9802941906851[/C][/ROW]
[ROW][C]beta[/C][C]0.414241094356447[/C][/ROW]
[ROW][C]S.D.[/C][C]0.0798174271924948[/C][/ROW]
[ROW][C]T-STAT[/C][C]5.18985776574114[/C][/ROW]
[ROW][C]p-value[/C][C]6.86825446267188e-06[/C][/ROW]
[/TABLE]
Source: https://freestatistics.org/blog/index.php?pk=157976&T=2

Globally Unique Identifier (entire table): ba.freestatistics.org/blog/index.php?pk=157976&T=2

As an alternative you can also use a QR Code:  

The GUIDs for individual cells are displayed in the table below:

Regression: S.E.(k) = alpha + beta * Mean(k)
alpha-12.9802941906851
beta0.414241094356447
S.D.0.0798174271924948
T-STAT5.18985776574114
p-value6.86825446267188e-06


Regression: ln S.E.(k) = alpha + beta * ln Mean(k)
alpha-1.22098290100937
beta1.03436955711916
S.D.0.180587195535887
T-STAT5.7278122850831
p-value1.23681779502209e-06
Lambda-0.03436955711916

\begin{tabular}{lllllllll}
\hline
Regression: ln S.E.(k) = alpha + beta * ln Mean(k) \tabularnewline
alpha & -1.22098290100937 \tabularnewline
beta & 1.03436955711916 \tabularnewline
S.D. & 0.180587195535887 \tabularnewline
T-STAT & 5.7278122850831 \tabularnewline
p-value & 1.23681779502209e-06 \tabularnewline
Lambda & -0.03436955711916 \tabularnewline
\hline
\end{tabular}
%Source: https://freestatistics.org/blog/index.php?pk=157976&T=3

[TABLE]
[ROW][C]Regression: ln S.E.(k) = alpha + beta * ln Mean(k)[/C][/ROW]
[ROW][C]alpha[/C][C]-1.22098290100937[/C][/ROW]
[ROW][C]beta[/C][C]1.03436955711916[/C][/ROW]
[ROW][C]S.D.[/C][C]0.180587195535887[/C][/ROW]
[ROW][C]T-STAT[/C][C]5.7278122850831[/C][/ROW]
[ROW][C]p-value[/C][C]1.23681779502209e-06[/C][/ROW]
[ROW][C]Lambda[/C][C]-0.03436955711916[/C][/ROW]
[/TABLE]
Source: https://freestatistics.org/blog/index.php?pk=157976&T=3

Globally Unique Identifier (entire table): ba.freestatistics.org/blog/index.php?pk=157976&T=3

As an alternative you can also use a QR Code:  

The GUIDs for individual cells are displayed in the table below:

Regression: ln S.E.(k) = alpha + beta * ln Mean(k)
alpha-1.22098290100937
beta1.03436955711916
S.D.0.180587195535887
T-STAT5.7278122850831
p-value1.23681779502209e-06
Lambda-0.03436955711916


Parameters (Session):
par1 = 4 ;
Parameters (R input):
par1 = 4 ;
R code (references can be found in the software module):
par1 <- 7
(n <- length(x))
(np <- floor(n / par1))
arr <- array(NA,dim=c(par1,np))
j <- 0
k <- 1
for (i in 1:(np*par1))
{
j = j + 1
arr[j,k] <- x[i]
if (j == par1) {
j = 0
k=k+1
}
}
arr
arr.mean <- array(NA,dim=np)
arr.sd <- array(NA,dim=np)
arr.range <- array(NA,dim=np)
for (j in 1:np)
{
arr.mean[j] <- mean(arr[,j],na.rm=TRUE)
arr.sd[j] <- sd(arr[,j],na.rm=TRUE)
arr.range[j] <- max(arr[,j],na.rm=TRUE) - min(arr[,j],na.rm=TRUE)
}
arr.mean
arr.sd
arr.range
(lm1 <- lm(arr.sd~arr.mean))
(lnlm1 <- lm(log(arr.sd)~log(arr.mean)))
(lm2 <- lm(arr.range~arr.mean))
bitmap(file='test1.png')
plot(arr.mean,arr.sd,main='Standard Deviation-Mean Plot',xlab='mean',ylab='standard deviation')
dev.off()
bitmap(file='test2.png')
plot(arr.mean,arr.range,main='Range-Mean Plot',xlab='mean',ylab='range')
dev.off()
load(file='createtable')
a<-table.start()
a<-table.row.start(a)
a<-table.element(a,'Standard Deviation-Mean Plot',4,TRUE)
a<-table.row.end(a)
a<-table.row.start(a)
a<-table.element(a,'Section',header=TRUE)
a<-table.element(a,'Mean',header=TRUE)
a<-table.element(a,'Standard Deviation',header=TRUE)
a<-table.element(a,'Range',header=TRUE)
a<-table.row.end(a)
for (j in 1:np) {
a<-table.row.start(a)
a<-table.element(a,j,header=TRUE)
a<-table.element(a,arr.mean[j])
a<-table.element(a,arr.sd[j] )
a<-table.element(a,arr.range[j] )
a<-table.row.end(a)
}
a<-table.end(a)
table.save(a,file='mytable.tab')
a<-table.start()
a<-table.row.start(a)
a<-table.element(a,'Regression: S.E.(k) = alpha + beta * Mean(k)',2,TRUE)
a<-table.row.end(a)
a<-table.row.start(a)
a<-table.element(a,'alpha',header=TRUE)
a<-table.element(a,lm1$coefficients[[1]])
a<-table.row.end(a)
a<-table.row.start(a)
a<-table.element(a,'beta',header=TRUE)
a<-table.element(a,lm1$coefficients[[2]])
a<-table.row.end(a)
a<-table.row.start(a)
a<-table.element(a,'S.D.',header=TRUE)
a<-table.element(a,summary(lm1)$coefficients[2,2])
a<-table.row.end(a)
a<-table.row.start(a)
a<-table.element(a,'T-STAT',header=TRUE)
a<-table.element(a,summary(lm1)$coefficients[2,3])
a<-table.row.end(a)
a<-table.row.start(a)
a<-table.element(a,'p-value',header=TRUE)
a<-table.element(a,summary(lm1)$coefficients[2,4])
a<-table.row.end(a)
a<-table.end(a)
table.save(a,file='mytable1.tab')
a<-table.start()
a<-table.row.start(a)
a<-table.element(a,'Regression: ln S.E.(k) = alpha + beta * ln Mean(k)',2,TRUE)
a<-table.row.end(a)
a<-table.row.start(a)
a<-table.element(a,'alpha',header=TRUE)
a<-table.element(a,lnlm1$coefficients[[1]])
a<-table.row.end(a)
a<-table.row.start(a)
a<-table.element(a,'beta',header=TRUE)
a<-table.element(a,lnlm1$coefficients[[2]])
a<-table.row.end(a)
a<-table.row.start(a)
a<-table.element(a,'S.D.',header=TRUE)
a<-table.element(a,summary(lnlm1)$coefficients[2,2])
a<-table.row.end(a)
a<-table.row.start(a)
a<-table.element(a,'T-STAT',header=TRUE)
a<-table.element(a,summary(lnlm1)$coefficients[2,3])
a<-table.row.end(a)
a<-table.row.start(a)
a<-table.element(a,'p-value',header=TRUE)
a<-table.element(a,summary(lnlm1)$coefficients[2,4])
a<-table.row.end(a)
a<-table.row.start(a)
a<-table.element(a,'Lambda',header=TRUE)
a<-table.element(a,1-lnlm1$coefficients[[2]])
a<-table.row.end(a)
a<-table.end(a)
table.save(a,file='mytable2.tab')