Free Statistics

of Irreproducible Research!

Author's title

Author*The author of this computation has been verified*
R Software Modulerwasp_arimabackwardselection.wasp
Title produced by softwareARIMA Backward Selection
Date of computationTue, 20 Dec 2011 09:00:47 -0500
Cite this page as followsStatistical Computations at FreeStatistics.org, Office for Research Development and Education, URL https://freestatistics.org/blog/index.php?v=date/2011/Dec/20/t1324389693vb6602tco18t4o3.htm/, Retrieved Mon, 06 May 2024 08:46:42 +0000
Statistical Computations at FreeStatistics.org, Office for Research Development and Education, URL https://freestatistics.org/blog/index.php?pk=157966, Retrieved Mon, 06 May 2024 08:46:42 +0000
QR Codes:

Original text written by user:
IsPrivate?No (this computation is public)
User-defined keywords
Estimated Impact134
Family? (F = Feedback message, R = changed R code, M = changed R Module, P = changed Parameters, D = changed Data)
-     [Univariate Data Series] [data set] [2008-12-01 19:54:57] [b98453cac15ba1066b407e146608df68]
- RMP   [Standard Deviation-Mean Plot] [Unemployment] [2010-11-29 10:34:47] [b98453cac15ba1066b407e146608df68]
- RMP     [ARIMA Backward Selection] [Unemployment] [2010-11-29 17:10:28] [b98453cac15ba1066b407e146608df68]
-    D      [ARIMA Backward Selection] [WS 9 ARMA Parameters] [2010-12-03 21:54:01] [8081b8996d5947580de3eb171e82db4f]
-   PD        [ARIMA Backward Selection] [Workshop 9, ARIMA] [2010-12-05 19:24:43] [3635fb7041b1998c5a1332cf9de22bce]
-   P           [ARIMA Backward Selection] [Workshop 9, ARIMA] [2010-12-06 22:46:35] [3635fb7041b1998c5a1332cf9de22bce]
-   PD            [ARIMA Backward Selection] [Paper ARIMA] [2010-12-19 17:42:04] [3635fb7041b1998c5a1332cf9de22bce]
-   PD              [ARIMA Backward Selection] [Paper ARIMA 2] [2010-12-19 21:44:21] [3635fb7041b1998c5a1332cf9de22bce]
-   PD                  [ARIMA Backward Selection] [paper] [2011-12-20 14:00:47] [6e647d331a8f33aa61a2d78ef323178e] [Current]
Feedback Forum

Post a new message
Dataseries X:
589
559
623
617
603
558
609
583
570
543
598
569
552
514
569
529
515
481
536
498
446
503
470
458
437
502
482
474
457
522
513
515
506
576
556
559
541
606
600
588
570
626
601
588
573
622
570
547
512
554
517
506
479
527
508
532
532
588
566
573
545
597
555
548
524
572


Summary of computational transaction
Raw Inputview raw input (R code)
Raw Outputview raw output of R engine
Computing time3 seconds
R Server'Gertrude Mary Cox' @ cox.wessa.net

\begin{tabular}{lllllllll}
\hline
Summary of computational transaction \tabularnewline
Raw Input & view raw input (R code)  \tabularnewline
Raw Output & view raw output of R engine  \tabularnewline
Computing time & 3 seconds \tabularnewline
R Server & 'Gertrude Mary Cox' @ cox.wessa.net \tabularnewline
\hline
\end{tabular}
%Source: https://freestatistics.org/blog/index.php?pk=157966&T=0

[TABLE]
[ROW][C]Summary of computational transaction[/C][/ROW]
[ROW][C]Raw Input[/C][C]view raw input (R code) [/C][/ROW]
[ROW][C]Raw Output[/C][C]view raw output of R engine [/C][/ROW]
[ROW][C]Computing time[/C][C]3 seconds[/C][/ROW]
[ROW][C]R Server[/C][C]'Gertrude Mary Cox' @ cox.wessa.net[/C][/ROW]
[/TABLE]
Source: https://freestatistics.org/blog/index.php?pk=157966&T=0

Globally Unique Identifier (entire table): ba.freestatistics.org/blog/index.php?pk=157966&T=0

As an alternative you can also use a QR Code:  

The GUIDs for individual cells are displayed in the table below:

Summary of computational transaction
Raw Inputview raw input (R code)
Raw Outputview raw output of R engine
Computing time3 seconds
R Server'Gertrude Mary Cox' @ cox.wessa.net


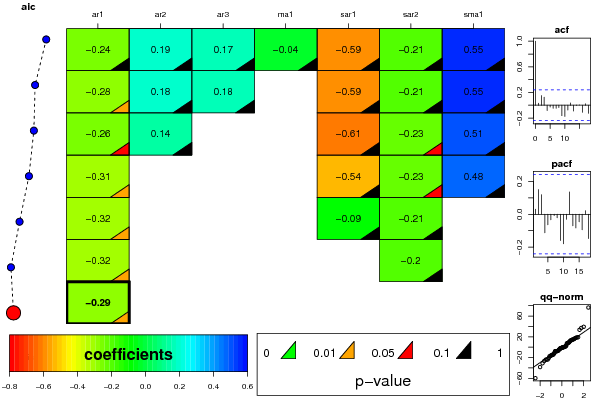
ARIMA Parameter Estimation and Backward Selection
Iterationar1ar2ar3ma1sar1sar2sma1
Estimates ( 1 )-0.2430.19120.172-0.0396-0.5947-0.21170.5468
(p-val)(0.7283 )(0.4181 )(0.3462 )(0.9546 )(0.129 )(0.1566 )(0.1648 )
Estimates ( 2 )-0.28210.18010.17880-0.591-0.20820.55
(p-val)(0.0312 )(0.1839 )(0.1851 )(NA )(0.1249 )(0.1246 )(0.1537 )
Estimates ( 3 )-0.2550.142400-0.609-0.22890.5121
(p-val)(0.0536 )(0.291 )(NA )(NA )(0.1838 )(0.0787 )(0.2712 )
Estimates ( 4 )-0.306000-0.5362-0.23450.4775
(p-val)(0.0158 )(NA )(NA )(NA )(0.2633 )(0.0784 )(0.3361 )
Estimates ( 5 )-0.3154000-0.0856-0.21030
(p-val)(0.0126 )(NA )(NA )(NA )(0.5041 )(0.1054 )(NA )
Estimates ( 6 )-0.31890000-0.20440
(p-val)(0.0115 )(NA )(NA )(NA )(NA )(0.116 )(NA )
Estimates ( 7 )-0.288000000
(p-val)(0.0211 )(NA )(NA )(NA )(NA )(NA )(NA )
Estimates ( 8 )NANANANANANANA
(p-val)(NA )(NA )(NA )(NA )(NA )(NA )(NA )
Estimates ( 9 )NANANANANANANA
(p-val)(NA )(NA )(NA )(NA )(NA )(NA )(NA )
Estimates ( 10 )NANANANANANANA
(p-val)(NA )(NA )(NA )(NA )(NA )(NA )(NA )
Estimates ( 11 )NANANANANANANA
(p-val)(NA )(NA )(NA )(NA )(NA )(NA )(NA )
Estimates ( 12 )NANANANANANANA
(p-val)(NA )(NA )(NA )(NA )(NA )(NA )(NA )
Estimates ( 13 )NANANANANANANA
(p-val)(NA )(NA )(NA )(NA )(NA )(NA )(NA )

\begin{tabular}{lllllllll}
\hline
ARIMA Parameter Estimation and Backward Selection \tabularnewline
Iteration & ar1 & ar2 & ar3 & ma1 & sar1 & sar2 & sma1 \tabularnewline
Estimates ( 1 ) & -0.243 & 0.1912 & 0.172 & -0.0396 & -0.5947 & -0.2117 & 0.5468 \tabularnewline
(p-val) & (0.7283 ) & (0.4181 ) & (0.3462 ) & (0.9546 ) & (0.129 ) & (0.1566 ) & (0.1648 ) \tabularnewline
Estimates ( 2 ) & -0.2821 & 0.1801 & 0.1788 & 0 & -0.591 & -0.2082 & 0.55 \tabularnewline
(p-val) & (0.0312 ) & (0.1839 ) & (0.1851 ) & (NA ) & (0.1249 ) & (0.1246 ) & (0.1537 ) \tabularnewline
Estimates ( 3 ) & -0.255 & 0.1424 & 0 & 0 & -0.609 & -0.2289 & 0.5121 \tabularnewline
(p-val) & (0.0536 ) & (0.291 ) & (NA ) & (NA ) & (0.1838 ) & (0.0787 ) & (0.2712 ) \tabularnewline
Estimates ( 4 ) & -0.306 & 0 & 0 & 0 & -0.5362 & -0.2345 & 0.4775 \tabularnewline
(p-val) & (0.0158 ) & (NA ) & (NA ) & (NA ) & (0.2633 ) & (0.0784 ) & (0.3361 ) \tabularnewline
Estimates ( 5 ) & -0.3154 & 0 & 0 & 0 & -0.0856 & -0.2103 & 0 \tabularnewline
(p-val) & (0.0126 ) & (NA ) & (NA ) & (NA ) & (0.5041 ) & (0.1054 ) & (NA ) \tabularnewline
Estimates ( 6 ) & -0.3189 & 0 & 0 & 0 & 0 & -0.2044 & 0 \tabularnewline
(p-val) & (0.0115 ) & (NA ) & (NA ) & (NA ) & (NA ) & (0.116 ) & (NA ) \tabularnewline
Estimates ( 7 ) & -0.288 & 0 & 0 & 0 & 0 & 0 & 0 \tabularnewline
(p-val) & (0.0211 ) & (NA ) & (NA ) & (NA ) & (NA ) & (NA ) & (NA ) \tabularnewline
Estimates ( 8 ) & NA & NA & NA & NA & NA & NA & NA \tabularnewline
(p-val) & (NA ) & (NA ) & (NA ) & (NA ) & (NA ) & (NA ) & (NA ) \tabularnewline
Estimates ( 9 ) & NA & NA & NA & NA & NA & NA & NA \tabularnewline
(p-val) & (NA ) & (NA ) & (NA ) & (NA ) & (NA ) & (NA ) & (NA ) \tabularnewline
Estimates ( 10 ) & NA & NA & NA & NA & NA & NA & NA \tabularnewline
(p-val) & (NA ) & (NA ) & (NA ) & (NA ) & (NA ) & (NA ) & (NA ) \tabularnewline
Estimates ( 11 ) & NA & NA & NA & NA & NA & NA & NA \tabularnewline
(p-val) & (NA ) & (NA ) & (NA ) & (NA ) & (NA ) & (NA ) & (NA ) \tabularnewline
Estimates ( 12 ) & NA & NA & NA & NA & NA & NA & NA \tabularnewline
(p-val) & (NA ) & (NA ) & (NA ) & (NA ) & (NA ) & (NA ) & (NA ) \tabularnewline
Estimates ( 13 ) & NA & NA & NA & NA & NA & NA & NA \tabularnewline
(p-val) & (NA ) & (NA ) & (NA ) & (NA ) & (NA ) & (NA ) & (NA ) \tabularnewline
\hline
\end{tabular}
%Source: https://freestatistics.org/blog/index.php?pk=157966&T=1

[TABLE]
[ROW][C]ARIMA Parameter Estimation and Backward Selection[/C][/ROW]
[ROW][C]Iteration[/C][C]ar1[/C][C]ar2[/C][C]ar3[/C][C]ma1[/C][C]sar1[/C][C]sar2[/C][C]sma1[/C][/ROW]
[ROW][C]Estimates ( 1 )[/C][C]-0.243[/C][C]0.1912[/C][C]0.172[/C][C]-0.0396[/C][C]-0.5947[/C][C]-0.2117[/C][C]0.5468[/C][/ROW]
[ROW][C](p-val)[/C][C](0.7283 )[/C][C](0.4181 )[/C][C](0.3462 )[/C][C](0.9546 )[/C][C](0.129 )[/C][C](0.1566 )[/C][C](0.1648 )[/C][/ROW]
[ROW][C]Estimates ( 2 )[/C][C]-0.2821[/C][C]0.1801[/C][C]0.1788[/C][C]0[/C][C]-0.591[/C][C]-0.2082[/C][C]0.55[/C][/ROW]
[ROW][C](p-val)[/C][C](0.0312 )[/C][C](0.1839 )[/C][C](0.1851 )[/C][C](NA )[/C][C](0.1249 )[/C][C](0.1246 )[/C][C](0.1537 )[/C][/ROW]
[ROW][C]Estimates ( 3 )[/C][C]-0.255[/C][C]0.1424[/C][C]0[/C][C]0[/C][C]-0.609[/C][C]-0.2289[/C][C]0.5121[/C][/ROW]
[ROW][C](p-val)[/C][C](0.0536 )[/C][C](0.291 )[/C][C](NA )[/C][C](NA )[/C][C](0.1838 )[/C][C](0.0787 )[/C][C](0.2712 )[/C][/ROW]
[ROW][C]Estimates ( 4 )[/C][C]-0.306[/C][C]0[/C][C]0[/C][C]0[/C][C]-0.5362[/C][C]-0.2345[/C][C]0.4775[/C][/ROW]
[ROW][C](p-val)[/C][C](0.0158 )[/C][C](NA )[/C][C](NA )[/C][C](NA )[/C][C](0.2633 )[/C][C](0.0784 )[/C][C](0.3361 )[/C][/ROW]
[ROW][C]Estimates ( 5 )[/C][C]-0.3154[/C][C]0[/C][C]0[/C][C]0[/C][C]-0.0856[/C][C]-0.2103[/C][C]0[/C][/ROW]
[ROW][C](p-val)[/C][C](0.0126 )[/C][C](NA )[/C][C](NA )[/C][C](NA )[/C][C](0.5041 )[/C][C](0.1054 )[/C][C](NA )[/C][/ROW]
[ROW][C]Estimates ( 6 )[/C][C]-0.3189[/C][C]0[/C][C]0[/C][C]0[/C][C]0[/C][C]-0.2044[/C][C]0[/C][/ROW]
[ROW][C](p-val)[/C][C](0.0115 )[/C][C](NA )[/C][C](NA )[/C][C](NA )[/C][C](NA )[/C][C](0.116 )[/C][C](NA )[/C][/ROW]
[ROW][C]Estimates ( 7 )[/C][C]-0.288[/C][C]0[/C][C]0[/C][C]0[/C][C]0[/C][C]0[/C][C]0[/C][/ROW]
[ROW][C](p-val)[/C][C](0.0211 )[/C][C](NA )[/C][C](NA )[/C][C](NA )[/C][C](NA )[/C][C](NA )[/C][C](NA )[/C][/ROW]
[ROW][C]Estimates ( 8 )[/C][C]NA[/C][C]NA[/C][C]NA[/C][C]NA[/C][C]NA[/C][C]NA[/C][C]NA[/C][/ROW]
[ROW][C](p-val)[/C][C](NA )[/C][C](NA )[/C][C](NA )[/C][C](NA )[/C][C](NA )[/C][C](NA )[/C][C](NA )[/C][/ROW]
[ROW][C]Estimates ( 9 )[/C][C]NA[/C][C]NA[/C][C]NA[/C][C]NA[/C][C]NA[/C][C]NA[/C][C]NA[/C][/ROW]
[ROW][C](p-val)[/C][C](NA )[/C][C](NA )[/C][C](NA )[/C][C](NA )[/C][C](NA )[/C][C](NA )[/C][C](NA )[/C][/ROW]
[ROW][C]Estimates ( 10 )[/C][C]NA[/C][C]NA[/C][C]NA[/C][C]NA[/C][C]NA[/C][C]NA[/C][C]NA[/C][/ROW]
[ROW][C](p-val)[/C][C](NA )[/C][C](NA )[/C][C](NA )[/C][C](NA )[/C][C](NA )[/C][C](NA )[/C][C](NA )[/C][/ROW]
[ROW][C]Estimates ( 11 )[/C][C]NA[/C][C]NA[/C][C]NA[/C][C]NA[/C][C]NA[/C][C]NA[/C][C]NA[/C][/ROW]
[ROW][C](p-val)[/C][C](NA )[/C][C](NA )[/C][C](NA )[/C][C](NA )[/C][C](NA )[/C][C](NA )[/C][C](NA )[/C][/ROW]
[ROW][C]Estimates ( 12 )[/C][C]NA[/C][C]NA[/C][C]NA[/C][C]NA[/C][C]NA[/C][C]NA[/C][C]NA[/C][/ROW]
[ROW][C](p-val)[/C][C](NA )[/C][C](NA )[/C][C](NA )[/C][C](NA )[/C][C](NA )[/C][C](NA )[/C][C](NA )[/C][/ROW]
[ROW][C]Estimates ( 13 )[/C][C]NA[/C][C]NA[/C][C]NA[/C][C]NA[/C][C]NA[/C][C]NA[/C][C]NA[/C][/ROW]
[ROW][C](p-val)[/C][C](NA )[/C][C](NA )[/C][C](NA )[/C][C](NA )[/C][C](NA )[/C][C](NA )[/C][C](NA )[/C][/ROW]
[/TABLE]
Source: https://freestatistics.org/blog/index.php?pk=157966&T=1

Globally Unique Identifier (entire table): ba.freestatistics.org/blog/index.php?pk=157966&T=1

As an alternative you can also use a QR Code:  

The GUIDs for individual cells are displayed in the table below:

ARIMA Parameter Estimation and Backward Selection
Iterationar1ar2ar3ma1sar1sar2sma1
Estimates ( 1 )-0.2430.19120.172-0.0396-0.5947-0.21170.5468
(p-val)(0.7283 )(0.4181 )(0.3462 )(0.9546 )(0.129 )(0.1566 )(0.1648 )
Estimates ( 2 )-0.28210.18010.17880-0.591-0.20820.55
(p-val)(0.0312 )(0.1839 )(0.1851 )(NA )(0.1249 )(0.1246 )(0.1537 )
Estimates ( 3 )-0.2550.142400-0.609-0.22890.5121
(p-val)(0.0536 )(0.291 )(NA )(NA )(0.1838 )(0.0787 )(0.2712 )
Estimates ( 4 )-0.306000-0.5362-0.23450.4775
(p-val)(0.0158 )(NA )(NA )(NA )(0.2633 )(0.0784 )(0.3361 )
Estimates ( 5 )-0.3154000-0.0856-0.21030
(p-val)(0.0126 )(NA )(NA )(NA )(0.5041 )(0.1054 )(NA )
Estimates ( 6 )-0.31890000-0.20440
(p-val)(0.0115 )(NA )(NA )(NA )(NA )(0.116 )(NA )
Estimates ( 7 )-0.288000000
(p-val)(0.0211 )(NA )(NA )(NA )(NA )(NA )(NA )
Estimates ( 8 )NANANANANANANA
(p-val)(NA )(NA )(NA )(NA )(NA )(NA )(NA )
Estimates ( 9 )NANANANANANANA
(p-val)(NA )(NA )(NA )(NA )(NA )(NA )(NA )
Estimates ( 10 )NANANANANANANA
(p-val)(NA )(NA )(NA )(NA )(NA )(NA )(NA )
Estimates ( 11 )NANANANANANANA
(p-val)(NA )(NA )(NA )(NA )(NA )(NA )(NA )
Estimates ( 12 )NANANANANANANA
(p-val)(NA )(NA )(NA )(NA )(NA )(NA )(NA )
Estimates ( 13 )NANANANANANANA
(p-val)(NA )(NA )(NA )(NA )(NA )(NA )(NA )


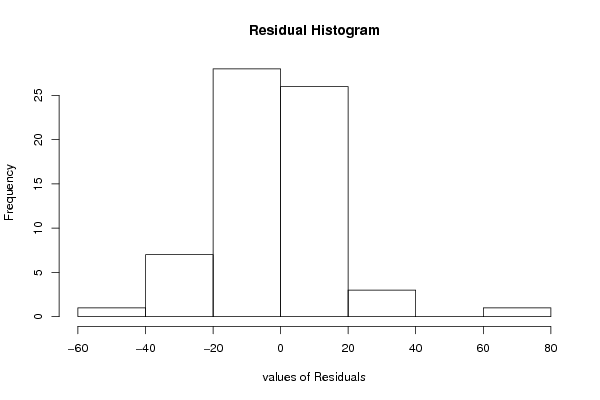
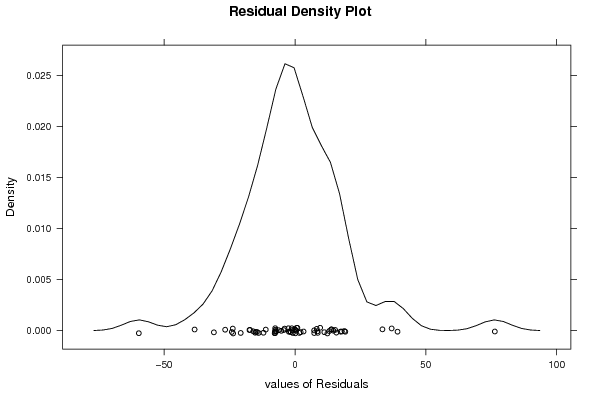
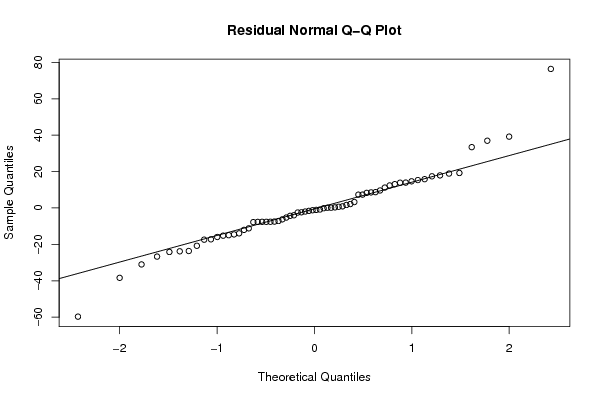
Estimated ARIMA Residuals
Value
-1.2409656344391
-13.9179724340754
-17.4070670717823
-23.6386496333089
-5.25556060568256
17.9040999744066
9.62161520228117
-1.96333877989044
-3.9966025778968
-14.9618748567038
-7.14294467710022
-15.9355699738319
-1.60715517835031
8.70122236366801
3.26655024547407
1.64751566863911
-38.3753949339071
76.372700798547
-59.6974502304062
-4.31138614038896
39.1874989967025
18.8989808976028
15.81191263362
8.55447148337112
-2.3615554117009
17.3997000367129
-1.05608055525261
13.086189142564
19.2204315604824
11.2071751424715
-6.22673007669431
-0.842823268320866
-7.60273036333344
-7.60932862040504
14.6540075154285
-7.77433057856166
-2.49633184129957
-7.4564784255213
-23.7926337879094
-7.57166190600989
0.906614694904964
-7.65201701111163
-26.6964863116156
-20.7637387725508
-24.1667414889867
-15.2176047175251
8.29730269799811
15.3405236377071
12.3747980727024
7.31587014025076
13.9380622869429
36.9360588827642
33.4213642878055
13.8756478799727
2.1609999176901
-14.5260151470383
-31.003754790616
-11.181173464063
-17.205128098367
-12.0503125141919
7.33594730971457
0.670848686269202

\begin{tabular}{lllllllll}
\hline
Estimated ARIMA Residuals \tabularnewline
Value \tabularnewline
-1.2409656344391 \tabularnewline
-13.9179724340754 \tabularnewline
-17.4070670717823 \tabularnewline
-23.6386496333089 \tabularnewline
-5.25556060568256 \tabularnewline
17.9040999744066 \tabularnewline
9.62161520228117 \tabularnewline
-1.96333877989044 \tabularnewline
-3.9966025778968 \tabularnewline
-14.9618748567038 \tabularnewline
-7.14294467710022 \tabularnewline
-15.9355699738319 \tabularnewline
-1.60715517835031 \tabularnewline
8.70122236366801 \tabularnewline
3.26655024547407 \tabularnewline
1.64751566863911 \tabularnewline
-38.3753949339071 \tabularnewline
76.372700798547 \tabularnewline
-59.6974502304062 \tabularnewline
-4.31138614038896 \tabularnewline
39.1874989967025 \tabularnewline
18.8989808976028 \tabularnewline
15.81191263362 \tabularnewline
8.55447148337112 \tabularnewline
-2.3615554117009 \tabularnewline
17.3997000367129 \tabularnewline
-1.05608055525261 \tabularnewline
13.086189142564 \tabularnewline
19.2204315604824 \tabularnewline
11.2071751424715 \tabularnewline
-6.22673007669431 \tabularnewline
-0.842823268320866 \tabularnewline
-7.60273036333344 \tabularnewline
-7.60932862040504 \tabularnewline
14.6540075154285 \tabularnewline
-7.77433057856166 \tabularnewline
-2.49633184129957 \tabularnewline
-7.4564784255213 \tabularnewline
-23.7926337879094 \tabularnewline
-7.57166190600989 \tabularnewline
0.906614694904964 \tabularnewline
-7.65201701111163 \tabularnewline
-26.6964863116156 \tabularnewline
-20.7637387725508 \tabularnewline
-24.1667414889867 \tabularnewline
-15.2176047175251 \tabularnewline
8.29730269799811 \tabularnewline
15.3405236377071 \tabularnewline
12.3747980727024 \tabularnewline
7.31587014025076 \tabularnewline
13.9380622869429 \tabularnewline
36.9360588827642 \tabularnewline
33.4213642878055 \tabularnewline
13.8756478799727 \tabularnewline
2.1609999176901 \tabularnewline
-14.5260151470383 \tabularnewline
-31.003754790616 \tabularnewline
-11.181173464063 \tabularnewline
-17.205128098367 \tabularnewline
-12.0503125141919 \tabularnewline
7.33594730971457 \tabularnewline
0.670848686269202 \tabularnewline
\hline
\end{tabular}
%Source: https://freestatistics.org/blog/index.php?pk=157966&T=2

[TABLE]
[ROW][C]Estimated ARIMA Residuals[/C][/ROW]
[ROW][C]Value[/C][/ROW]
[ROW][C]-1.2409656344391[/C][/ROW]
[ROW][C]-13.9179724340754[/C][/ROW]
[ROW][C]-17.4070670717823[/C][/ROW]
[ROW][C]-23.6386496333089[/C][/ROW]
[ROW][C]-5.25556060568256[/C][/ROW]
[ROW][C]17.9040999744066[/C][/ROW]
[ROW][C]9.62161520228117[/C][/ROW]
[ROW][C]-1.96333877989044[/C][/ROW]
[ROW][C]-3.9966025778968[/C][/ROW]
[ROW][C]-14.9618748567038[/C][/ROW]
[ROW][C]-7.14294467710022[/C][/ROW]
[ROW][C]-15.9355699738319[/C][/ROW]
[ROW][C]-1.60715517835031[/C][/ROW]
[ROW][C]8.70122236366801[/C][/ROW]
[ROW][C]3.26655024547407[/C][/ROW]
[ROW][C]1.64751566863911[/C][/ROW]
[ROW][C]-38.3753949339071[/C][/ROW]
[ROW][C]76.372700798547[/C][/ROW]
[ROW][C]-59.6974502304062[/C][/ROW]
[ROW][C]-4.31138614038896[/C][/ROW]
[ROW][C]39.1874989967025[/C][/ROW]
[ROW][C]18.8989808976028[/C][/ROW]
[ROW][C]15.81191263362[/C][/ROW]
[ROW][C]8.55447148337112[/C][/ROW]
[ROW][C]-2.3615554117009[/C][/ROW]
[ROW][C]17.3997000367129[/C][/ROW]
[ROW][C]-1.05608055525261[/C][/ROW]
[ROW][C]13.086189142564[/C][/ROW]
[ROW][C]19.2204315604824[/C][/ROW]
[ROW][C]11.2071751424715[/C][/ROW]
[ROW][C]-6.22673007669431[/C][/ROW]
[ROW][C]-0.842823268320866[/C][/ROW]
[ROW][C]-7.60273036333344[/C][/ROW]
[ROW][C]-7.60932862040504[/C][/ROW]
[ROW][C]14.6540075154285[/C][/ROW]
[ROW][C]-7.77433057856166[/C][/ROW]
[ROW][C]-2.49633184129957[/C][/ROW]
[ROW][C]-7.4564784255213[/C][/ROW]
[ROW][C]-23.7926337879094[/C][/ROW]
[ROW][C]-7.57166190600989[/C][/ROW]
[ROW][C]0.906614694904964[/C][/ROW]
[ROW][C]-7.65201701111163[/C][/ROW]
[ROW][C]-26.6964863116156[/C][/ROW]
[ROW][C]-20.7637387725508[/C][/ROW]
[ROW][C]-24.1667414889867[/C][/ROW]
[ROW][C]-15.2176047175251[/C][/ROW]
[ROW][C]8.29730269799811[/C][/ROW]
[ROW][C]15.3405236377071[/C][/ROW]
[ROW][C]12.3747980727024[/C][/ROW]
[ROW][C]7.31587014025076[/C][/ROW]
[ROW][C]13.9380622869429[/C][/ROW]
[ROW][C]36.9360588827642[/C][/ROW]
[ROW][C]33.4213642878055[/C][/ROW]
[ROW][C]13.8756478799727[/C][/ROW]
[ROW][C]2.1609999176901[/C][/ROW]
[ROW][C]-14.5260151470383[/C][/ROW]
[ROW][C]-31.003754790616[/C][/ROW]
[ROW][C]-11.181173464063[/C][/ROW]
[ROW][C]-17.205128098367[/C][/ROW]
[ROW][C]-12.0503125141919[/C][/ROW]
[ROW][C]7.33594730971457[/C][/ROW]
[ROW][C]0.670848686269202[/C][/ROW]
[/TABLE]
Source: https://freestatistics.org/blog/index.php?pk=157966&T=2

Globally Unique Identifier (entire table): ba.freestatistics.org/blog/index.php?pk=157966&T=2

As an alternative you can also use a QR Code:  

The GUIDs for individual cells are displayed in the table below:

Estimated ARIMA Residuals
Value
-1.2409656344391
-13.9179724340754
-17.4070670717823
-23.6386496333089
-5.25556060568256
17.9040999744066
9.62161520228117
-1.96333877989044
-3.9966025778968
-14.9618748567038
-7.14294467710022
-15.9355699738319
-1.60715517835031
8.70122236366801
3.26655024547407
1.64751566863911
-38.3753949339071
76.372700798547
-59.6974502304062
-4.31138614038896
39.1874989967025
18.8989808976028
15.81191263362
8.55447148337112
-2.3615554117009
17.3997000367129
-1.05608055525261
13.086189142564
19.2204315604824
11.2071751424715
-6.22673007669431
-0.842823268320866
-7.60273036333344
-7.60932862040504
14.6540075154285
-7.77433057856166
-2.49633184129957
-7.4564784255213
-23.7926337879094
-7.57166190600989
0.906614694904964
-7.65201701111163
-26.6964863116156
-20.7637387725508
-24.1667414889867
-15.2176047175251
8.29730269799811
15.3405236377071
12.3747980727024
7.31587014025076
13.9380622869429
36.9360588827642
33.4213642878055
13.8756478799727
2.1609999176901
-14.5260151470383
-31.003754790616
-11.181173464063
-17.205128098367
-12.0503125141919
7.33594730971457
0.670848686269202


Parameters (Session):
par1 = FALSE ; par2 = 1 ; par3 = 1 ; par4 = 1 ; par5 = 4 ; par6 = 3 ; par7 = 1 ; par8 = 2 ; par9 = 1 ;
Parameters (R input):
par1 = FALSE ; par2 = 1 ; par3 = 1 ; par4 = 1 ; par5 = 4 ; par6 = 3 ; par7 = 1 ; par8 = 2 ; par9 = 1 ;
R code (references can be found in the software module):
library(lattice)
if (par1 == 'TRUE') par1 <- TRUE
if (par1 == 'FALSE') par1 <- FALSE
par2 <- as.numeric(par2) #Box-Cox lambda transformation parameter
par3 <- as.numeric(par3) #degree of non-seasonal differencing
par4 <- as.numeric(par4) #degree of seasonal differencing
par5 <- as.numeric(par5) #seasonal period
par6 <- as.numeric(par6) #degree (p) of the non-seasonal AR(p) polynomial
par7 <- as.numeric(par7) #degree (q) of the non-seasonal MA(q) polynomial
par8 <- as.numeric(par8) #degree (P) of the seasonal AR(P) polynomial
par9 <- as.numeric(par9) #degree (Q) of the seasonal MA(Q) polynomial
armaGR <- function(arima.out, names, n){
try1 <- arima.out$coef
try2 <- sqrt(diag(arima.out$var.coef))
try.data.frame <- data.frame(matrix(NA,ncol=4,nrow=length(names)))
dimnames(try.data.frame) <- list(names,c('coef','std','tstat','pv'))
try.data.frame[,1] <- try1
for(i in 1:length(try2)) try.data.frame[which(rownames(try.data.frame)==names(try2)[i]),2] <- try2[i]
try.data.frame[,3] <- try.data.frame[,1] / try.data.frame[,2]
try.data.frame[,4] <- round((1-pt(abs(try.data.frame[,3]),df=n-(length(try2)+1)))*2,5)
vector <- rep(NA,length(names))
vector[is.na(try.data.frame[,4])] <- 0
maxi <- which.max(try.data.frame[,4])
continue <- max(try.data.frame[,4],na.rm=TRUE) > .05
vector[maxi] <- 0
list(summary=try.data.frame,next.vector=vector,continue=continue)
}
arimaSelect <- function(series, order=c(13,0,0), seasonal=list(order=c(2,0,0),period=12), include.mean=F){
nrc <- order[1]+order[3]+seasonal$order[1]+seasonal$order[3]
coeff <- matrix(NA, nrow=nrc*2, ncol=nrc)
pval <- matrix(NA, nrow=nrc*2, ncol=nrc)
mylist <- rep(list(NULL), nrc)
names <- NULL
if(order[1] > 0) names <- paste('ar',1:order[1],sep='')
if(order[3] > 0) names <- c( names , paste('ma',1:order[3],sep='') )
if(seasonal$order[1] > 0) names <- c(names, paste('sar',1:seasonal$order[1],sep=''))
if(seasonal$order[3] > 0) names <- c(names, paste('sma',1:seasonal$order[3],sep=''))
arima.out <- arima(series, order=order, seasonal=seasonal, include.mean=include.mean, method='ML')
mylist[[1]] <- arima.out
last.arma <- armaGR(arima.out, names, length(series))
mystop <- FALSE
i <- 1
coeff[i,] <- last.arma[[1]][,1]
pval [i,] <- last.arma[[1]][,4]
i <- 2
aic <- arima.out$aic
while(!mystop){
mylist[[i]] <- arima.out
arima.out <- arima(series, order=order, seasonal=seasonal, include.mean=include.mean, method='ML', fixed=last.arma$next.vector)
aic <- c(aic, arima.out$aic)
last.arma <- armaGR(arima.out, names, length(series))
mystop <- !last.arma$continue
coeff[i,] <- last.arma[[1]][,1]
pval [i,] <- last.arma[[1]][,4]
i <- i+1
}
list(coeff, pval, mylist, aic=aic)
}
arimaSelectplot <- function(arimaSelect.out,noms,choix){
noms <- names(arimaSelect.out[[3]][[1]]$coef)
coeff <- arimaSelect.out[[1]]
k <- min(which(is.na(coeff[,1])))-1
coeff <- coeff[1:k,]
pval <- arimaSelect.out[[2]][1:k,]
aic <- arimaSelect.out$aic[1:k]
coeff[coeff==0] <- NA
n <- ncol(coeff)
if(missing(choix)) choix <- k
layout(matrix(c(1,1,1,2,
3,3,3,2,
3,3,3,4,
5,6,7,7),nr=4),
widths=c(10,35,45,15),
heights=c(30,30,15,15))
couleurs <- rainbow(75)[1:50]#(50)
ticks <- pretty(coeff)
par(mar=c(1,1,3,1))
plot(aic,k:1-.5,type='o',pch=21,bg='blue',cex=2,axes=F,lty=2,xpd=NA)
points(aic[choix],k-choix+.5,pch=21,cex=4,bg=2,xpd=NA)
title('aic',line=2)
par(mar=c(3,0,0,0))
plot(0,axes=F,xlab='',ylab='',xlim=range(ticks),ylim=c(.1,1))
rect(xleft = min(ticks) + (0:49)/50*(max(ticks)-min(ticks)),
xright = min(ticks) + (1:50)/50*(max(ticks)-min(ticks)),
ytop = rep(1,50),
ybottom= rep(0,50),col=couleurs,border=NA)
axis(1,ticks)
rect(xleft=min(ticks),xright=max(ticks),ytop=1,ybottom=0)
text(mean(coeff,na.rm=T),.5,'coefficients',cex=2,font=2)
par(mar=c(1,1,3,1))
image(1:n,1:k,t(coeff[k:1,]),axes=F,col=couleurs,zlim=range(ticks))
for(i in 1:n) for(j in 1:k) if(!is.na(coeff[j,i])) {
if(pval[j,i]<.01) symb = 'green'
else if( (pval[j,i]<.05) & (pval[j,i]>=.01)) symb = 'orange'
else if( (pval[j,i]<.1) & (pval[j,i]>=.05)) symb = 'red'
else symb = 'black'
polygon(c(i+.5 ,i+.2 ,i+.5 ,i+.5),
c(k-j+0.5,k-j+0.5,k-j+0.8,k-j+0.5),
col=symb)
if(j==choix) {
rect(xleft=i-.5,
xright=i+.5,
ybottom=k-j+1.5,
ytop=k-j+.5,
lwd=4)
text(i,
k-j+1,
round(coeff[j,i],2),
cex=1.2,
font=2)
}
else{
rect(xleft=i-.5,xright=i+.5,ybottom=k-j+1.5,ytop=k-j+.5)
text(i,k-j+1,round(coeff[j,i],2),cex=1.2,font=1)
}
}
axis(3,1:n,noms)
par(mar=c(0.5,0,0,0.5))
plot(0,axes=F,xlab='',ylab='',type='n',xlim=c(0,8),ylim=c(-.2,.8))
cols <- c('green','orange','red','black')
niv <- c('0','0.01','0.05','0.1')
for(i in 0:3){
polygon(c(1+2*i ,1+2*i ,1+2*i-.5 ,1+2*i),
c(.4 ,.7 , .4 , .4),
col=cols[i+1])
text(2*i,0.5,niv[i+1],cex=1.5)
}
text(8,.5,1,cex=1.5)
text(4,0,'p-value',cex=2)
box()
residus <- arimaSelect.out[[3]][[choix]]$res
par(mar=c(1,2,4,1))
acf(residus,main='')
title('acf',line=.5)
par(mar=c(1,2,4,1))
pacf(residus,main='')
title('pacf',line=.5)
par(mar=c(2,2,4,1))
qqnorm(residus,main='')
title('qq-norm',line=.5)
qqline(residus)
residus
}
if (par2 == 0) x <- log(x)
if (par2 != 0) x <- x^par2
(selection <- arimaSelect(x, order=c(par6,par3,par7), seasonal=list(order=c(par8,par4,par9), period=par5)))
bitmap(file='test1.png')
resid <- arimaSelectplot(selection)
dev.off()
resid
bitmap(file='test2.png')
acf(resid,length(resid)/2, main='Residual Autocorrelation Function')
dev.off()
bitmap(file='test3.png')
pacf(resid,length(resid)/2, main='Residual Partial Autocorrelation Function')
dev.off()
bitmap(file='test4.png')
cpgram(resid, main='Residual Cumulative Periodogram')
dev.off()
bitmap(file='test5.png')
hist(resid, main='Residual Histogram', xlab='values of Residuals')
dev.off()
bitmap(file='test6.png')
densityplot(~resid,col='black',main='Residual Density Plot', xlab='values of Residuals')
dev.off()
bitmap(file='test7.png')
qqnorm(resid, main='Residual Normal Q-Q Plot')
qqline(resid)
dev.off()
ncols <- length(selection[[1]][1,])
nrows <- length(selection[[2]][,1])-1
load(file='createtable')
a<-table.start()
a<-table.row.start(a)
a<-table.element(a,'ARIMA Parameter Estimation and Backward Selection', ncols+1,TRUE)
a<-table.row.end(a)
a<-table.row.start(a)
a<-table.element(a,'Iteration', header=TRUE)
for (i in 1:ncols) {
a<-table.element(a,names(selection[[3]][[1]]$coef)[i],header=TRUE)
}
a<-table.row.end(a)
for (j in 1:nrows) {
a<-table.row.start(a)
mydum <- 'Estimates ('
mydum <- paste(mydum,j)
mydum <- paste(mydum,')')
a<-table.element(a,mydum, header=TRUE)
for (i in 1:ncols) {
a<-table.element(a,round(selection[[1]][j,i],4))
}
a<-table.row.end(a)
a<-table.row.start(a)
a<-table.element(a,'(p-val)', header=TRUE)
for (i in 1:ncols) {
mydum <- '('
mydum <- paste(mydum,round(selection[[2]][j,i],4),sep='')
mydum <- paste(mydum,')')
a<-table.element(a,mydum)
}
a<-table.row.end(a)
}
a<-table.end(a)
table.save(a,file='mytable.tab')
a<-table.start()
a<-table.row.start(a)
a<-table.element(a,'Estimated ARIMA Residuals', 1,TRUE)
a<-table.row.end(a)
a<-table.row.start(a)
a<-table.element(a,'Value', 1,TRUE)
a<-table.row.end(a)
for (i in (par4*par5+par3):length(resid)) {
a<-table.row.start(a)
a<-table.element(a,resid[i])
a<-table.row.end(a)
}
a<-table.end(a)
table.save(a,file='mytable1.tab')