Free Statistics

of Irreproducible Research!

Author's title

Author*The author of this computation has been verified*
R Software Modulerwasp_smp.wasp
Title produced by softwareStandard Deviation-Mean Plot
Date of computationTue, 20 Dec 2011 08:36:10 -0500
Cite this page as followsStatistical Computations at FreeStatistics.org, Office for Research Development and Education, URL https://freestatistics.org/blog/index.php?v=date/2011/Dec/20/t1324388194yx8vyol3lr57jmw.htm/, Retrieved Mon, 06 May 2024 04:49:21 +0000
Statistical Computations at FreeStatistics.org, Office for Research Development and Education, URL https://freestatistics.org/blog/index.php?pk=157958, Retrieved Mon, 06 May 2024 04:49:21 +0000
QR Codes:

Original text written by user:
IsPrivate?No (this computation is public)
User-defined keywords
Estimated Impact146
Family? (F = Feedback message, R = changed R code, M = changed R Module, P = changed Parameters, D = changed Data)
-     [Spectral Analysis] [Paper] [2011-12-20 12:55:33] [43239ed98a62e091c70785d80176537f]
- RMP     [Standard Deviation-Mean Plot] [paper] [2011-12-20 13:36:10] [6e647d331a8f33aa61a2d78ef323178e] [Current]
Feedback Forum

Post a new message
Dataseries X:
589
559
623
617
603
558
609
583
570
543
598
569
552
514
569
529
515
481
536
498
446
503
470
458
437
502
482
474
457
522
513
515
506
576
556
559
541
606
600
588
570
626
601
588
573
622
570
547
512
554
517
506
479
527
508
532
532
588
566
573
545
597
555
548
524
572


Summary of computational transaction
Raw Inputview raw input (R code)
Raw Outputview raw output of R engine
Computing time1 seconds
R Server'Gertrude Mary Cox' @ cox.wessa.net

\begin{tabular}{lllllllll}
\hline
Summary of computational transaction \tabularnewline
Raw Input & view raw input (R code)  \tabularnewline
Raw Output & view raw output of R engine  \tabularnewline
Computing time & 1 seconds \tabularnewline
R Server & 'Gertrude Mary Cox' @ cox.wessa.net \tabularnewline
\hline
\end{tabular}
%Source: https://freestatistics.org/blog/index.php?pk=157958&T=0

[TABLE]
[ROW][C]Summary of computational transaction[/C][/ROW]
[ROW][C]Raw Input[/C][C]view raw input (R code) [/C][/ROW]
[ROW][C]Raw Output[/C][C]view raw output of R engine [/C][/ROW]
[ROW][C]Computing time[/C][C]1 seconds[/C][/ROW]
[ROW][C]R Server[/C][C]'Gertrude Mary Cox' @ cox.wessa.net[/C][/ROW]
[/TABLE]
Source: https://freestatistics.org/blog/index.php?pk=157958&T=0

Globally Unique Identifier (entire table): ba.freestatistics.org/blog/index.php?pk=157958&T=0

As an alternative you can also use a QR Code:  

The GUIDs for individual cells are displayed in the table below:

Summary of computational transaction
Raw Inputview raw input (R code)
Raw Outputview raw output of R engine
Computing time1 seconds
R Server'Gertrude Mary Cox' @ cox.wessa.net


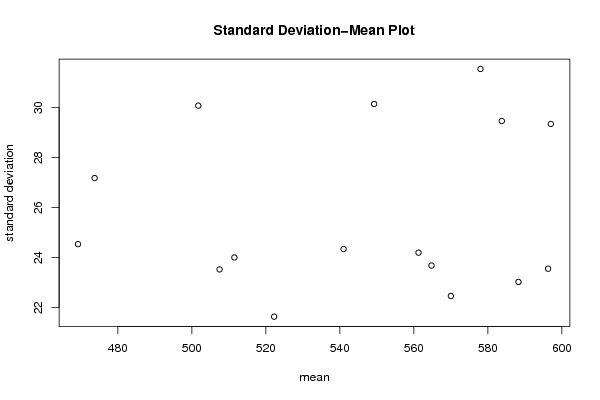
Standard Deviation-Mean Plot
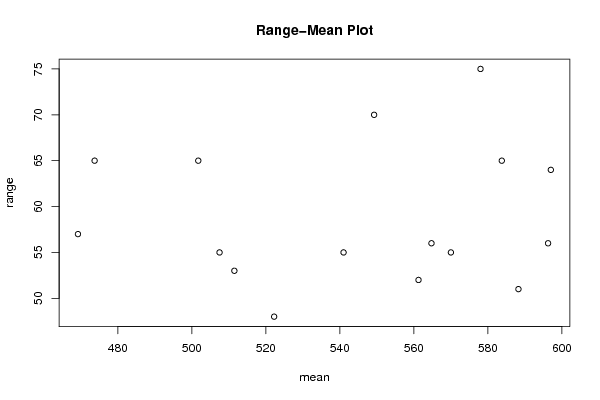
SectionMeanStandard DeviationRange
159729.348480937406964
2588.2523.027157879338951
357022.46478726065955
454124.344746182013655
5507.523.530122538284155
6469.2524.540782383616157
7473.7527.183021661814365
8501.7530.081832834231865
9549.2530.148244835589870
10583.7529.466082196315165
11596.2523.556669260883856
1257831.548903837270475
13522.2521.639085008382448
14511.524.006943440041153
15564.7523.683679331275156
16561.2524.198829172778952

\begin{tabular}{lllllllll}
\hline
Standard Deviation-Mean Plot \tabularnewline
Section & Mean & Standard Deviation & Range \tabularnewline
1 & 597 & 29.3484809374069 & 64 \tabularnewline
2 & 588.25 & 23.0271578793389 & 51 \tabularnewline
3 & 570 & 22.464787260659 & 55 \tabularnewline
4 & 541 & 24.3447461820136 & 55 \tabularnewline
5 & 507.5 & 23.5301225382841 & 55 \tabularnewline
6 & 469.25 & 24.5407823836161 & 57 \tabularnewline
7 & 473.75 & 27.1830216618143 & 65 \tabularnewline
8 & 501.75 & 30.0818328342318 & 65 \tabularnewline
9 & 549.25 & 30.1482448355898 & 70 \tabularnewline
10 & 583.75 & 29.4660821963151 & 65 \tabularnewline
11 & 596.25 & 23.5566692608838 & 56 \tabularnewline
12 & 578 & 31.5489038372704 & 75 \tabularnewline
13 & 522.25 & 21.6390850083824 & 48 \tabularnewline
14 & 511.5 & 24.0069434400411 & 53 \tabularnewline
15 & 564.75 & 23.6836793312751 & 56 \tabularnewline
16 & 561.25 & 24.1988291727789 & 52 \tabularnewline
\hline
\end{tabular}
%Source: https://freestatistics.org/blog/index.php?pk=157958&T=1

[TABLE]
[ROW][C]Standard Deviation-Mean Plot[/C][/ROW]
[ROW][C]Section[/C][C]Mean[/C][C]Standard Deviation[/C][C]Range[/C][/ROW]
[ROW][C]1[/C][C]597[/C][C]29.3484809374069[/C][C]64[/C][/ROW]
[ROW][C]2[/C][C]588.25[/C][C]23.0271578793389[/C][C]51[/C][/ROW]
[ROW][C]3[/C][C]570[/C][C]22.464787260659[/C][C]55[/C][/ROW]
[ROW][C]4[/C][C]541[/C][C]24.3447461820136[/C][C]55[/C][/ROW]
[ROW][C]5[/C][C]507.5[/C][C]23.5301225382841[/C][C]55[/C][/ROW]
[ROW][C]6[/C][C]469.25[/C][C]24.5407823836161[/C][C]57[/C][/ROW]
[ROW][C]7[/C][C]473.75[/C][C]27.1830216618143[/C][C]65[/C][/ROW]
[ROW][C]8[/C][C]501.75[/C][C]30.0818328342318[/C][C]65[/C][/ROW]
[ROW][C]9[/C][C]549.25[/C][C]30.1482448355898[/C][C]70[/C][/ROW]
[ROW][C]10[/C][C]583.75[/C][C]29.4660821963151[/C][C]65[/C][/ROW]
[ROW][C]11[/C][C]596.25[/C][C]23.5566692608838[/C][C]56[/C][/ROW]
[ROW][C]12[/C][C]578[/C][C]31.5489038372704[/C][C]75[/C][/ROW]
[ROW][C]13[/C][C]522.25[/C][C]21.6390850083824[/C][C]48[/C][/ROW]
[ROW][C]14[/C][C]511.5[/C][C]24.0069434400411[/C][C]53[/C][/ROW]
[ROW][C]15[/C][C]564.75[/C][C]23.6836793312751[/C][C]56[/C][/ROW]
[ROW][C]16[/C][C]561.25[/C][C]24.1988291727789[/C][C]52[/C][/ROW]
[/TABLE]
Source: https://freestatistics.org/blog/index.php?pk=157958&T=1

Globally Unique Identifier (entire table): ba.freestatistics.org/blog/index.php?pk=157958&T=1

As an alternative you can also use a QR Code:  

The GUIDs for individual cells are displayed in the table below:

Standard Deviation-Mean Plot
SectionMeanStandard DeviationRange
159729.348480937406964
2588.2523.027157879338951
357022.46478726065955
454124.344746182013655
5507.523.530122538284155
6469.2524.540782383616157
7473.7527.183021661814365
8501.7530.081832834231865
9549.2530.148244835589870
10583.7529.466082196315165
11596.2523.556669260883856
1257831.548903837270475
13522.2521.639085008382448
14511.524.006943440041153
15564.7523.683679331275156
16561.2524.198829172778952


Regression: S.E.(k) = alpha + beta * Mean(k)
alpha21.6165084177119
beta0.00767658012466428
S.D.0.0204377697790969
T-STAT0.375607525069377
p-value0.712838540122474

\begin{tabular}{lllllllll}
\hline
Regression: S.E.(k) = alpha + beta * Mean(k) \tabularnewline
alpha & 21.6165084177119 \tabularnewline
beta & 0.00767658012466428 \tabularnewline
S.D. & 0.0204377697790969 \tabularnewline
T-STAT & 0.375607525069377 \tabularnewline
p-value & 0.712838540122474 \tabularnewline
\hline
\end{tabular}
%Source: https://freestatistics.org/blog/index.php?pk=157958&T=2

[TABLE]
[ROW][C]Regression: S.E.(k) = alpha + beta * Mean(k)[/C][/ROW]
[ROW][C]alpha[/C][C]21.6165084177119[/C][/ROW]
[ROW][C]beta[/C][C]0.00767658012466428[/C][/ROW]
[ROW][C]S.D.[/C][C]0.0204377697790969[/C][/ROW]
[ROW][C]T-STAT[/C][C]0.375607525069377[/C][/ROW]
[ROW][C]p-value[/C][C]0.712838540122474[/C][/ROW]
[/TABLE]
Source: https://freestatistics.org/blog/index.php?pk=157958&T=2

Globally Unique Identifier (entire table): ba.freestatistics.org/blog/index.php?pk=157958&T=2

As an alternative you can also use a QR Code:  

The GUIDs for individual cells are displayed in the table below:

Regression: S.E.(k) = alpha + beta * Mean(k)
alpha21.6165084177119
beta0.00767658012466428
S.D.0.0204377697790969
T-STAT0.375607525069377
p-value0.712838540122474


Regression: ln S.E.(k) = alpha + beta * ln Mean(k)
alpha2.43794614216295
beta0.127855285275246
S.D.0.413110865118434
T-STAT0.309493881838696
p-value0.761504329232279
Lambda0.872144714724754

\begin{tabular}{lllllllll}
\hline
Regression: ln S.E.(k) = alpha + beta * ln Mean(k) \tabularnewline
alpha & 2.43794614216295 \tabularnewline
beta & 0.127855285275246 \tabularnewline
S.D. & 0.413110865118434 \tabularnewline
T-STAT & 0.309493881838696 \tabularnewline
p-value & 0.761504329232279 \tabularnewline
Lambda & 0.872144714724754 \tabularnewline
\hline
\end{tabular}
%Source: https://freestatistics.org/blog/index.php?pk=157958&T=3

[TABLE]
[ROW][C]Regression: ln S.E.(k) = alpha + beta * ln Mean(k)[/C][/ROW]
[ROW][C]alpha[/C][C]2.43794614216295[/C][/ROW]
[ROW][C]beta[/C][C]0.127855285275246[/C][/ROW]
[ROW][C]S.D.[/C][C]0.413110865118434[/C][/ROW]
[ROW][C]T-STAT[/C][C]0.309493881838696[/C][/ROW]
[ROW][C]p-value[/C][C]0.761504329232279[/C][/ROW]
[ROW][C]Lambda[/C][C]0.872144714724754[/C][/ROW]
[/TABLE]
Source: https://freestatistics.org/blog/index.php?pk=157958&T=3

Globally Unique Identifier (entire table): ba.freestatistics.org/blog/index.php?pk=157958&T=3

As an alternative you can also use a QR Code:  

The GUIDs for individual cells are displayed in the table below:

Regression: ln S.E.(k) = alpha + beta * ln Mean(k)
alpha2.43794614216295
beta0.127855285275246
S.D.0.413110865118434
T-STAT0.309493881838696
p-value0.761504329232279
Lambda0.872144714724754


Parameters (Session):
par1 = 4 ;
Parameters (R input):
par1 = 4 ;
R code (references can be found in the software module):
par1 <- as.numeric(par1)
(n <- length(x))
(np <- floor(n / par1))
arr <- array(NA,dim=c(par1,np))
j <- 0
k <- 1
for (i in 1:(np*par1))
{
j = j + 1
arr[j,k] <- x[i]
if (j == par1) {
j = 0
k=k+1
}
}
arr
arr.mean <- array(NA,dim=np)
arr.sd <- array(NA,dim=np)
arr.range <- array(NA,dim=np)
for (j in 1:np)
{
arr.mean[j] <- mean(arr[,j],na.rm=TRUE)
arr.sd[j] <- sd(arr[,j],na.rm=TRUE)
arr.range[j] <- max(arr[,j],na.rm=TRUE) - min(arr[,j],na.rm=TRUE)
}
arr.mean
arr.sd
arr.range
(lm1 <- lm(arr.sd~arr.mean))
(lnlm1 <- lm(log(arr.sd)~log(arr.mean)))
(lm2 <- lm(arr.range~arr.mean))
bitmap(file='test1.png')
plot(arr.mean,arr.sd,main='Standard Deviation-Mean Plot',xlab='mean',ylab='standard deviation')
dev.off()
bitmap(file='test2.png')
plot(arr.mean,arr.range,main='Range-Mean Plot',xlab='mean',ylab='range')
dev.off()
load(file='createtable')
a<-table.start()
a<-table.row.start(a)
a<-table.element(a,'Standard Deviation-Mean Plot',4,TRUE)
a<-table.row.end(a)
a<-table.row.start(a)
a<-table.element(a,'Section',header=TRUE)
a<-table.element(a,'Mean',header=TRUE)
a<-table.element(a,'Standard Deviation',header=TRUE)
a<-table.element(a,'Range',header=TRUE)
a<-table.row.end(a)
for (j in 1:np) {
a<-table.row.start(a)
a<-table.element(a,j,header=TRUE)
a<-table.element(a,arr.mean[j])
a<-table.element(a,arr.sd[j] )
a<-table.element(a,arr.range[j] )
a<-table.row.end(a)
}
a<-table.end(a)
table.save(a,file='mytable.tab')
a<-table.start()
a<-table.row.start(a)
a<-table.element(a,'Regression: S.E.(k) = alpha + beta * Mean(k)',2,TRUE)
a<-table.row.end(a)
a<-table.row.start(a)
a<-table.element(a,'alpha',header=TRUE)
a<-table.element(a,lm1$coefficients[[1]])
a<-table.row.end(a)
a<-table.row.start(a)
a<-table.element(a,'beta',header=TRUE)
a<-table.element(a,lm1$coefficients[[2]])
a<-table.row.end(a)
a<-table.row.start(a)
a<-table.element(a,'S.D.',header=TRUE)
a<-table.element(a,summary(lm1)$coefficients[2,2])
a<-table.row.end(a)
a<-table.row.start(a)
a<-table.element(a,'T-STAT',header=TRUE)
a<-table.element(a,summary(lm1)$coefficients[2,3])
a<-table.row.end(a)
a<-table.row.start(a)
a<-table.element(a,'p-value',header=TRUE)
a<-table.element(a,summary(lm1)$coefficients[2,4])
a<-table.row.end(a)
a<-table.end(a)
table.save(a,file='mytable1.tab')
a<-table.start()
a<-table.row.start(a)
a<-table.element(a,'Regression: ln S.E.(k) = alpha + beta * ln Mean(k)',2,TRUE)
a<-table.row.end(a)
a<-table.row.start(a)
a<-table.element(a,'alpha',header=TRUE)
a<-table.element(a,lnlm1$coefficients[[1]])
a<-table.row.end(a)
a<-table.row.start(a)
a<-table.element(a,'beta',header=TRUE)
a<-table.element(a,lnlm1$coefficients[[2]])
a<-table.row.end(a)
a<-table.row.start(a)
a<-table.element(a,'S.D.',header=TRUE)
a<-table.element(a,summary(lnlm1)$coefficients[2,2])
a<-table.row.end(a)
a<-table.row.start(a)
a<-table.element(a,'T-STAT',header=TRUE)
a<-table.element(a,summary(lnlm1)$coefficients[2,3])
a<-table.row.end(a)
a<-table.row.start(a)
a<-table.element(a,'p-value',header=TRUE)
a<-table.element(a,summary(lnlm1)$coefficients[2,4])
a<-table.row.end(a)
a<-table.row.start(a)
a<-table.element(a,'Lambda',header=TRUE)
a<-table.element(a,1-lnlm1$coefficients[[2]])
a<-table.row.end(a)
a<-table.end(a)
table.save(a,file='mytable2.tab')