Free Statistics

of Irreproducible Research!

Author's title

Author*The author of this computation has been verified*
R Software Modulerwasp_multipleregression.wasp
Title produced by softwareMultiple Regression
Date of computationTue, 20 Dec 2011 05:57:46 -0500
Cite this page as followsStatistical Computations at FreeStatistics.org, Office for Research Development and Education, URL https://freestatistics.org/blog/index.php?v=date/2011/Dec/20/t1324378695wpx59ztjqkx7o9l.htm/, Retrieved Sun, 05 May 2024 23:29:29 +0000
Statistical Computations at FreeStatistics.org, Office for Research Development and Education, URL https://freestatistics.org/blog/index.php?pk=157915, Retrieved Sun, 05 May 2024 23:29:29 +0000
QR Codes:

Original text written by user:
IsPrivate?No (this computation is public)
User-defined keywords
Estimated Impact108
Family? (F = Feedback message, R = changed R code, M = changed R Module, P = changed Parameters, D = changed Data)
-     [Multiple Regression] [Paper] [2007-12-16 17:59:10] [b3bb3ec527e23fa7d74d4348b38c8499]
- RMPD    [Multiple Regression] [paper19] [2011-12-20 10:57:46] [47995d3a8fac585eeb070a274b466f8c] [Current]
Feedback Forum

Post a new message
Dataseries X:
1770	1200
2203	916
2836	878
1976	841
2837	824
2150	819
2180	823
2631	825
1781	773
2327	836
2260	862
2051	886
2250	1010
2102	846
2957	911
2485	856
2871	881
2447	830
2570	830
2622	827
1840	773
2682	797
2369	826
2119	947
2531	1110
2214	896
3206	917
2709	873
2734	845
2348	807
2702	841
2642	829
2064	781
2647	861
2534	831
2297	969
2718	991
2321	891
3112	945
2664	911
2808	847
2668	823
2934	838
2616	862
2228	822
2463	864
2416	862
2407	1044
2582	1035
2101	858
3305	889
2818	832
2401	810
3019	792
2507	812
2948	783
2210	773
2467	840
2596	820
2451	945


Summary of computational transaction
Raw Inputview raw input (R code)
Raw Outputview raw output of R engine
Computing time4 seconds
R Server'Gertrude Mary Cox' @ cox.wessa.net

\begin{tabular}{lllllllll}
\hline
Summary of computational transaction \tabularnewline
Raw Input & view raw input (R code)  \tabularnewline
Raw Output & view raw output of R engine  \tabularnewline
Computing time & 4 seconds \tabularnewline
R Server & 'Gertrude Mary Cox' @ cox.wessa.net \tabularnewline
\hline
\end{tabular}
%Source: https://freestatistics.org/blog/index.php?pk=157915&T=0

[TABLE]
[ROW][C]Summary of computational transaction[/C][/ROW]
[ROW][C]Raw Input[/C][C]view raw input (R code) [/C][/ROW]
[ROW][C]Raw Output[/C][C]view raw output of R engine [/C][/ROW]
[ROW][C]Computing time[/C][C]4 seconds[/C][/ROW]
[ROW][C]R Server[/C][C]'Gertrude Mary Cox' @ cox.wessa.net[/C][/ROW]
[/TABLE]
Source: https://freestatistics.org/blog/index.php?pk=157915&T=0

Globally Unique Identifier (entire table): ba.freestatistics.org/blog/index.php?pk=157915&T=0

As an alternative you can also use a QR Code:  

The GUIDs for individual cells are displayed in the table below:

Summary of computational transaction
Raw Inputview raw input (R code)
Raw Outputview raw output of R engine
Computing time4 seconds
R Server'Gertrude Mary Cox' @ cox.wessa.net


Multiple Linear Regression - Estimated Regression Equation
Scheidingen[t] = + 2471.39483537443 -0.495532903112249Zelfdodingen[t] + 242.222838808377M1[t] -40.2944846290968M2[t] + 860.430446360697M3[t] + 277.677008326408M4[t] + 459.515466547436M5[t] + 234.78072734979M6[t] + 286.759263502237M7[t] + 390.71910081804M8[t] -304.154885861932M9[t] + 208.342286156872M10[t] + 118.983361665747M11[t] + 7.45624423299241t + e[t]

\begin{tabular}{lllllllll}
\hline
Multiple Linear Regression - Estimated Regression Equation \tabularnewline
Scheidingen[t] =  +  2471.39483537443 -0.495532903112249Zelfdodingen[t] +  242.222838808377M1[t] -40.2944846290968M2[t] +  860.430446360697M3[t] +  277.677008326408M4[t] +  459.515466547436M5[t] +  234.78072734979M6[t] +  286.759263502237M7[t] +  390.71910081804M8[t] -304.154885861932M9[t] +  208.342286156872M10[t] +  118.983361665747M11[t] +  7.45624423299241t  + e[t] \tabularnewline
\hline
\end{tabular}
%Source: https://freestatistics.org/blog/index.php?pk=157915&T=1

[TABLE]
[ROW][C]Multiple Linear Regression - Estimated Regression Equation[/C][/ROW]
[ROW][C]Scheidingen[t] =  +  2471.39483537443 -0.495532903112249Zelfdodingen[t] +  242.222838808377M1[t] -40.2944846290968M2[t] +  860.430446360697M3[t] +  277.677008326408M4[t] +  459.515466547436M5[t] +  234.78072734979M6[t] +  286.759263502237M7[t] +  390.71910081804M8[t] -304.154885861932M9[t] +  208.342286156872M10[t] +  118.983361665747M11[t] +  7.45624423299241t  + e[t][/C][/ROW]
[/TABLE]
Source: https://freestatistics.org/blog/index.php?pk=157915&T=1

Globally Unique Identifier (entire table): ba.freestatistics.org/blog/index.php?pk=157915&T=1

As an alternative you can also use a QR Code:  

The GUIDs for individual cells are displayed in the table below:

Multiple Linear Regression - Estimated Regression Equation
Scheidingen[t] = + 2471.39483537443 -0.495532903112249Zelfdodingen[t] + 242.222838808377M1[t] -40.2944846290968M2[t] + 860.430446360697M3[t] + 277.677008326408M4[t] + 459.515466547436M5[t] + 234.78072734979M6[t] + 286.759263502237M7[t] + 390.71910081804M8[t] -304.154885861932M9[t] + 208.342286156872M10[t] + 118.983361665747M11[t] + 7.45624423299241t + e[t]


Multiple Linear Regression - Ordinary Least Squares
VariableParameterS.D.T-STATH0: parameter = 02-tail p-value1-tail p-value
(Intercept)2471.39483537443709.9945793.48090.0011060.000553
Zelfdodingen-0.4955329031122490.729616-0.67920.5004340.250217
M1242.222838808377143.6630741.6860.0985590.049279
M2-40.2944846290968132.301017-0.30460.762070.381035
M3860.430446360697124.9579686.885800
M4277.677008326408138.4010992.00630.0507220.025361
M5459.515466547436146.7308673.13170.0030190.00151
M6234.78072734979159.019791.47640.1466430.073322
M7286.759263502237152.0009731.88660.0655410.03277
M8390.71910081804153.5249252.5450.0143470.007174
M9-304.154885861932173.831497-1.74970.0868370.043419
M10208.342286156872146.8615411.41860.1627470.081373
M11118.983361665747146.5163720.81210.4209270.210464
t7.456244232992411.4293145.21674e-062e-06

\begin{tabular}{lllllllll}
\hline
Multiple Linear Regression - Ordinary Least Squares \tabularnewline
Variable & Parameter & S.D. & T-STATH0: parameter = 0 & 2-tail p-value & 1-tail p-value \tabularnewline
(Intercept) & 2471.39483537443 & 709.994579 & 3.4809 & 0.001106 & 0.000553 \tabularnewline
Zelfdodingen & -0.495532903112249 & 0.729616 & -0.6792 & 0.500434 & 0.250217 \tabularnewline
M1 & 242.222838808377 & 143.663074 & 1.686 & 0.098559 & 0.049279 \tabularnewline
M2 & -40.2944846290968 & 132.301017 & -0.3046 & 0.76207 & 0.381035 \tabularnewline
M3 & 860.430446360697 & 124.957968 & 6.8858 & 0 & 0 \tabularnewline
M4 & 277.677008326408 & 138.401099 & 2.0063 & 0.050722 & 0.025361 \tabularnewline
M5 & 459.515466547436 & 146.730867 & 3.1317 & 0.003019 & 0.00151 \tabularnewline
M6 & 234.78072734979 & 159.01979 & 1.4764 & 0.146643 & 0.073322 \tabularnewline
M7 & 286.759263502237 & 152.000973 & 1.8866 & 0.065541 & 0.03277 \tabularnewline
M8 & 390.71910081804 & 153.524925 & 2.545 & 0.014347 & 0.007174 \tabularnewline
M9 & -304.154885861932 & 173.831497 & -1.7497 & 0.086837 & 0.043419 \tabularnewline
M10 & 208.342286156872 & 146.861541 & 1.4186 & 0.162747 & 0.081373 \tabularnewline
M11 & 118.983361665747 & 146.516372 & 0.8121 & 0.420927 & 0.210464 \tabularnewline
t & 7.45624423299241 & 1.429314 & 5.2167 & 4e-06 & 2e-06 \tabularnewline
\hline
\end{tabular}
%Source: https://freestatistics.org/blog/index.php?pk=157915&T=2

[TABLE]
[ROW][C]Multiple Linear Regression - Ordinary Least Squares[/C][/ROW]
[ROW][C]Variable[/C][C]Parameter[/C][C]S.D.[/C][C]T-STATH0: parameter = 0[/C][C]2-tail p-value[/C][C]1-tail p-value[/C][/ROW]
[ROW][C](Intercept)[/C][C]2471.39483537443[/C][C]709.994579[/C][C]3.4809[/C][C]0.001106[/C][C]0.000553[/C][/ROW]
[ROW][C]Zelfdodingen[/C][C]-0.495532903112249[/C][C]0.729616[/C][C]-0.6792[/C][C]0.500434[/C][C]0.250217[/C][/ROW]
[ROW][C]M1[/C][C]242.222838808377[/C][C]143.663074[/C][C]1.686[/C][C]0.098559[/C][C]0.049279[/C][/ROW]
[ROW][C]M2[/C][C]-40.2944846290968[/C][C]132.301017[/C][C]-0.3046[/C][C]0.76207[/C][C]0.381035[/C][/ROW]
[ROW][C]M3[/C][C]860.430446360697[/C][C]124.957968[/C][C]6.8858[/C][C]0[/C][C]0[/C][/ROW]
[ROW][C]M4[/C][C]277.677008326408[/C][C]138.401099[/C][C]2.0063[/C][C]0.050722[/C][C]0.025361[/C][/ROW]
[ROW][C]M5[/C][C]459.515466547436[/C][C]146.730867[/C][C]3.1317[/C][C]0.003019[/C][C]0.00151[/C][/ROW]
[ROW][C]M6[/C][C]234.78072734979[/C][C]159.01979[/C][C]1.4764[/C][C]0.146643[/C][C]0.073322[/C][/ROW]
[ROW][C]M7[/C][C]286.759263502237[/C][C]152.000973[/C][C]1.8866[/C][C]0.065541[/C][C]0.03277[/C][/ROW]
[ROW][C]M8[/C][C]390.71910081804[/C][C]153.524925[/C][C]2.545[/C][C]0.014347[/C][C]0.007174[/C][/ROW]
[ROW][C]M9[/C][C]-304.154885861932[/C][C]173.831497[/C][C]-1.7497[/C][C]0.086837[/C][C]0.043419[/C][/ROW]
[ROW][C]M10[/C][C]208.342286156872[/C][C]146.861541[/C][C]1.4186[/C][C]0.162747[/C][C]0.081373[/C][/ROW]
[ROW][C]M11[/C][C]118.983361665747[/C][C]146.516372[/C][C]0.8121[/C][C]0.420927[/C][C]0.210464[/C][/ROW]
[ROW][C]t[/C][C]7.45624423299241[/C][C]1.429314[/C][C]5.2167[/C][C]4e-06[/C][C]2e-06[/C][/ROW]
[/TABLE]
Source: https://freestatistics.org/blog/index.php?pk=157915&T=2

Globally Unique Identifier (entire table): ba.freestatistics.org/blog/index.php?pk=157915&T=2

As an alternative you can also use a QR Code:  

The GUIDs for individual cells are displayed in the table below:

Multiple Linear Regression - Ordinary Least Squares
VariableParameterS.D.T-STATH0: parameter = 02-tail p-value1-tail p-value
(Intercept)2471.39483537443709.9945793.48090.0011060.000553
Zelfdodingen-0.4955329031122490.729616-0.67920.5004340.250217
M1242.222838808377143.6630741.6860.0985590.049279
M2-40.2944846290968132.301017-0.30460.762070.381035
M3860.430446360697124.9579686.885800
M4277.677008326408138.4010992.00630.0507220.025361
M5459.515466547436146.7308673.13170.0030190.00151
M6234.78072734979159.019791.47640.1466430.073322
M7286.759263502237152.0009731.88660.0655410.03277
M8390.71910081804153.5249252.5450.0143470.007174
M9-304.154885861932173.831497-1.74970.0868370.043419
M10208.342286156872146.8615411.41860.1627470.081373
M11118.983361665747146.5163720.81210.4209270.210464
t7.456244232992411.4293145.21674e-062e-06


Multiple Linear Regression - Regression Statistics
Multiple R0.873243235710891
R-squared0.762553748714828
Adjusted R-squared0.695449373351627
F-TEST (value)11.363696399639
F-TEST (DF numerator)13
F-TEST (DF denominator)46
p-value2.31135555139872e-10
Multiple Linear Regression - Residual Statistics
Residual Standard Deviation187.305507913243
Sum Squared Residuals1613834.25155334

\begin{tabular}{lllllllll}
\hline
Multiple Linear Regression - Regression Statistics \tabularnewline
Multiple R & 0.873243235710891 \tabularnewline
R-squared & 0.762553748714828 \tabularnewline
Adjusted R-squared & 0.695449373351627 \tabularnewline
F-TEST (value) & 11.363696399639 \tabularnewline
F-TEST (DF numerator) & 13 \tabularnewline
F-TEST (DF denominator) & 46 \tabularnewline
p-value & 2.31135555139872e-10 \tabularnewline
Multiple Linear Regression - Residual Statistics \tabularnewline
Residual Standard Deviation & 187.305507913243 \tabularnewline
Sum Squared Residuals & 1613834.25155334 \tabularnewline
\hline
\end{tabular}
%Source: https://freestatistics.org/blog/index.php?pk=157915&T=3

[TABLE]
[ROW][C]Multiple Linear Regression - Regression Statistics[/C][/ROW]
[ROW][C]Multiple R[/C][C]0.873243235710891[/C][/ROW]
[ROW][C]R-squared[/C][C]0.762553748714828[/C][/ROW]
[ROW][C]Adjusted R-squared[/C][C]0.695449373351627[/C][/ROW]
[ROW][C]F-TEST (value)[/C][C]11.363696399639[/C][/ROW]
[ROW][C]F-TEST (DF numerator)[/C][C]13[/C][/ROW]
[ROW][C]F-TEST (DF denominator)[/C][C]46[/C][/ROW]
[ROW][C]p-value[/C][C]2.31135555139872e-10[/C][/ROW]
[ROW][C]Multiple Linear Regression - Residual Statistics[/C][/ROW]
[ROW][C]Residual Standard Deviation[/C][C]187.305507913243[/C][/ROW]
[ROW][C]Sum Squared Residuals[/C][C]1613834.25155334[/C][/ROW]
[/TABLE]
Source: https://freestatistics.org/blog/index.php?pk=157915&T=3

Globally Unique Identifier (entire table): ba.freestatistics.org/blog/index.php?pk=157915&T=3

As an alternative you can also use a QR Code:  

The GUIDs for individual cells are displayed in the table below:

Multiple Linear Regression - Regression Statistics
Multiple R0.873243235710891
R-squared0.762553748714828
Adjusted R-squared0.695449373351627
F-TEST (value)11.363696399639
F-TEST (DF numerator)13
F-TEST (DF denominator)46
p-value2.31135555139872e-10
Multiple Linear Regression - Residual Statistics
Residual Standard Deviation187.305507913243
Sum Squared Residuals1613834.25155334


Multiple Linear Regression - Actuals, Interpolation, and Residuals
Time or IndexActualsInterpolationForecastResidualsPrediction Error
117702126.4344346811-356.434434681096
222031992.1046999605210.895300039502
328362919.11612550155-83.1161255015498
419762362.15364911541-386.153649115407
528372559.87241092234277.127589077665
621502345.07158047324-195.071580473243
721802402.52422924623-222.524229246233
826312512.9492449888118.050755011195
917811851.29921350366-70.2992135036616
1023272340.03405685939-13.0340568593863
1122602245.2475211203414.7524788796649
1220512121.82761401289-70.8276140128869
1322502310.06061706834-60.0606170683371
1421022116.26693397426-14.2669339742648
1529572992.23847049475-35.2384704947543
1624852444.1955863646340.8044136353681
1728712621.10196624085249.898033759154
1824472429.0956493349217.9043506650825
1925702488.5304297203681.4695702796436
2026222601.4331099784920.566890021511
2118401940.77414429957-100.774144299571
2226822448.83477087667233.165229123327
2323692352.5616364282916.438363571715
2421192181.07503771895-62.0750377189484
2525312349.98225755302181.017742446979
2622142180.9652196145633.0347803854388
2732063078.74020387199127.25979612801
2827092525.24645780763183.753542192367
2927342728.41608154885.58391845120406
3023482529.96783690241-181.967836902408
3127022572.55449858203129.445501417969
3226422689.91697496817-47.9169749681734
3320642026.2848118705837.7151881294183
3426472506.5955958734140.404404126602
3525342439.5589027086394.4410972913673
3622972259.6482446463937.3517553536122
3727182498.42560381929219.574396180712
3823212272.9178149260348.0821850739687
3931123154.34021338076-42.3402133807557
4026642595.8911382852868.108861714724
4128082816.89994653848-8.89994653848041
4226682611.5142412485256.4857587514788
4329342663.51602808728270.483971912724
4426162763.03931996138-147.039319961378
4522282095.44289363889132.557106361112
4624632594.58392795997-131.58392795997
4724162513.67231350806-97.6723135080619
4824072311.9582077088895.041792291122
4925822566.0970868782615.9029131217424
5021012378.74533152464-277.745331524644
5133053271.5649867509533.4350132490494
5228182724.5131684270593.4868315729473
5324012924.70959474954-523.709594749542
5430192716.35069204091302.64930795909
5525072765.8748143641-258.874814364104
5629482891.6613501031556.3386498968451
5722102209.19893668730.801063312702491
5824672695.95164843057-228.951648430573
5925962623.95962623469-27.9596262346853
6024512450.49089591290.509104087100356

\begin{tabular}{lllllllll}
\hline
Multiple Linear Regression - Actuals, Interpolation, and Residuals \tabularnewline
Time or Index & Actuals & InterpolationForecast & ResidualsPrediction Error \tabularnewline
1 & 1770 & 2126.4344346811 & -356.434434681096 \tabularnewline
2 & 2203 & 1992.1046999605 & 210.895300039502 \tabularnewline
3 & 2836 & 2919.11612550155 & -83.1161255015498 \tabularnewline
4 & 1976 & 2362.15364911541 & -386.153649115407 \tabularnewline
5 & 2837 & 2559.87241092234 & 277.127589077665 \tabularnewline
6 & 2150 & 2345.07158047324 & -195.071580473243 \tabularnewline
7 & 2180 & 2402.52422924623 & -222.524229246233 \tabularnewline
8 & 2631 & 2512.9492449888 & 118.050755011195 \tabularnewline
9 & 1781 & 1851.29921350366 & -70.2992135036616 \tabularnewline
10 & 2327 & 2340.03405685939 & -13.0340568593863 \tabularnewline
11 & 2260 & 2245.24752112034 & 14.7524788796649 \tabularnewline
12 & 2051 & 2121.82761401289 & -70.8276140128869 \tabularnewline
13 & 2250 & 2310.06061706834 & -60.0606170683371 \tabularnewline
14 & 2102 & 2116.26693397426 & -14.2669339742648 \tabularnewline
15 & 2957 & 2992.23847049475 & -35.2384704947543 \tabularnewline
16 & 2485 & 2444.19558636463 & 40.8044136353681 \tabularnewline
17 & 2871 & 2621.10196624085 & 249.898033759154 \tabularnewline
18 & 2447 & 2429.09564933492 & 17.9043506650825 \tabularnewline
19 & 2570 & 2488.53042972036 & 81.4695702796436 \tabularnewline
20 & 2622 & 2601.43310997849 & 20.566890021511 \tabularnewline
21 & 1840 & 1940.77414429957 & -100.774144299571 \tabularnewline
22 & 2682 & 2448.83477087667 & 233.165229123327 \tabularnewline
23 & 2369 & 2352.56163642829 & 16.438363571715 \tabularnewline
24 & 2119 & 2181.07503771895 & -62.0750377189484 \tabularnewline
25 & 2531 & 2349.98225755302 & 181.017742446979 \tabularnewline
26 & 2214 & 2180.96521961456 & 33.0347803854388 \tabularnewline
27 & 3206 & 3078.74020387199 & 127.25979612801 \tabularnewline
28 & 2709 & 2525.24645780763 & 183.753542192367 \tabularnewline
29 & 2734 & 2728.4160815488 & 5.58391845120406 \tabularnewline
30 & 2348 & 2529.96783690241 & -181.967836902408 \tabularnewline
31 & 2702 & 2572.55449858203 & 129.445501417969 \tabularnewline
32 & 2642 & 2689.91697496817 & -47.9169749681734 \tabularnewline
33 & 2064 & 2026.28481187058 & 37.7151881294183 \tabularnewline
34 & 2647 & 2506.5955958734 & 140.404404126602 \tabularnewline
35 & 2534 & 2439.55890270863 & 94.4410972913673 \tabularnewline
36 & 2297 & 2259.64824464639 & 37.3517553536122 \tabularnewline
37 & 2718 & 2498.42560381929 & 219.574396180712 \tabularnewline
38 & 2321 & 2272.91781492603 & 48.0821850739687 \tabularnewline
39 & 3112 & 3154.34021338076 & -42.3402133807557 \tabularnewline
40 & 2664 & 2595.89113828528 & 68.108861714724 \tabularnewline
41 & 2808 & 2816.89994653848 & -8.89994653848041 \tabularnewline
42 & 2668 & 2611.51424124852 & 56.4857587514788 \tabularnewline
43 & 2934 & 2663.51602808728 & 270.483971912724 \tabularnewline
44 & 2616 & 2763.03931996138 & -147.039319961378 \tabularnewline
45 & 2228 & 2095.44289363889 & 132.557106361112 \tabularnewline
46 & 2463 & 2594.58392795997 & -131.58392795997 \tabularnewline
47 & 2416 & 2513.67231350806 & -97.6723135080619 \tabularnewline
48 & 2407 & 2311.95820770888 & 95.041792291122 \tabularnewline
49 & 2582 & 2566.09708687826 & 15.9029131217424 \tabularnewline
50 & 2101 & 2378.74533152464 & -277.745331524644 \tabularnewline
51 & 3305 & 3271.56498675095 & 33.4350132490494 \tabularnewline
52 & 2818 & 2724.51316842705 & 93.4868315729473 \tabularnewline
53 & 2401 & 2924.70959474954 & -523.709594749542 \tabularnewline
54 & 3019 & 2716.35069204091 & 302.64930795909 \tabularnewline
55 & 2507 & 2765.8748143641 & -258.874814364104 \tabularnewline
56 & 2948 & 2891.66135010315 & 56.3386498968451 \tabularnewline
57 & 2210 & 2209.1989366873 & 0.801063312702491 \tabularnewline
58 & 2467 & 2695.95164843057 & -228.951648430573 \tabularnewline
59 & 2596 & 2623.95962623469 & -27.9596262346853 \tabularnewline
60 & 2451 & 2450.4908959129 & 0.509104087100356 \tabularnewline
\hline
\end{tabular}
%Source: https://freestatistics.org/blog/index.php?pk=157915&T=4

[TABLE]
[ROW][C]Multiple Linear Regression - Actuals, Interpolation, and Residuals[/C][/ROW]
[ROW][C]Time or Index[/C][C]Actuals[/C][C]InterpolationForecast[/C][C]ResidualsPrediction Error[/C][/ROW]
[ROW][C]1[/C][C]1770[/C][C]2126.4344346811[/C][C]-356.434434681096[/C][/ROW]
[ROW][C]2[/C][C]2203[/C][C]1992.1046999605[/C][C]210.895300039502[/C][/ROW]
[ROW][C]3[/C][C]2836[/C][C]2919.11612550155[/C][C]-83.1161255015498[/C][/ROW]
[ROW][C]4[/C][C]1976[/C][C]2362.15364911541[/C][C]-386.153649115407[/C][/ROW]
[ROW][C]5[/C][C]2837[/C][C]2559.87241092234[/C][C]277.127589077665[/C][/ROW]
[ROW][C]6[/C][C]2150[/C][C]2345.07158047324[/C][C]-195.071580473243[/C][/ROW]
[ROW][C]7[/C][C]2180[/C][C]2402.52422924623[/C][C]-222.524229246233[/C][/ROW]
[ROW][C]8[/C][C]2631[/C][C]2512.9492449888[/C][C]118.050755011195[/C][/ROW]
[ROW][C]9[/C][C]1781[/C][C]1851.29921350366[/C][C]-70.2992135036616[/C][/ROW]
[ROW][C]10[/C][C]2327[/C][C]2340.03405685939[/C][C]-13.0340568593863[/C][/ROW]
[ROW][C]11[/C][C]2260[/C][C]2245.24752112034[/C][C]14.7524788796649[/C][/ROW]
[ROW][C]12[/C][C]2051[/C][C]2121.82761401289[/C][C]-70.8276140128869[/C][/ROW]
[ROW][C]13[/C][C]2250[/C][C]2310.06061706834[/C][C]-60.0606170683371[/C][/ROW]
[ROW][C]14[/C][C]2102[/C][C]2116.26693397426[/C][C]-14.2669339742648[/C][/ROW]
[ROW][C]15[/C][C]2957[/C][C]2992.23847049475[/C][C]-35.2384704947543[/C][/ROW]
[ROW][C]16[/C][C]2485[/C][C]2444.19558636463[/C][C]40.8044136353681[/C][/ROW]
[ROW][C]17[/C][C]2871[/C][C]2621.10196624085[/C][C]249.898033759154[/C][/ROW]
[ROW][C]18[/C][C]2447[/C][C]2429.09564933492[/C][C]17.9043506650825[/C][/ROW]
[ROW][C]19[/C][C]2570[/C][C]2488.53042972036[/C][C]81.4695702796436[/C][/ROW]
[ROW][C]20[/C][C]2622[/C][C]2601.43310997849[/C][C]20.566890021511[/C][/ROW]
[ROW][C]21[/C][C]1840[/C][C]1940.77414429957[/C][C]-100.774144299571[/C][/ROW]
[ROW][C]22[/C][C]2682[/C][C]2448.83477087667[/C][C]233.165229123327[/C][/ROW]
[ROW][C]23[/C][C]2369[/C][C]2352.56163642829[/C][C]16.438363571715[/C][/ROW]
[ROW][C]24[/C][C]2119[/C][C]2181.07503771895[/C][C]-62.0750377189484[/C][/ROW]
[ROW][C]25[/C][C]2531[/C][C]2349.98225755302[/C][C]181.017742446979[/C][/ROW]
[ROW][C]26[/C][C]2214[/C][C]2180.96521961456[/C][C]33.0347803854388[/C][/ROW]
[ROW][C]27[/C][C]3206[/C][C]3078.74020387199[/C][C]127.25979612801[/C][/ROW]
[ROW][C]28[/C][C]2709[/C][C]2525.24645780763[/C][C]183.753542192367[/C][/ROW]
[ROW][C]29[/C][C]2734[/C][C]2728.4160815488[/C][C]5.58391845120406[/C][/ROW]
[ROW][C]30[/C][C]2348[/C][C]2529.96783690241[/C][C]-181.967836902408[/C][/ROW]
[ROW][C]31[/C][C]2702[/C][C]2572.55449858203[/C][C]129.445501417969[/C][/ROW]
[ROW][C]32[/C][C]2642[/C][C]2689.91697496817[/C][C]-47.9169749681734[/C][/ROW]
[ROW][C]33[/C][C]2064[/C][C]2026.28481187058[/C][C]37.7151881294183[/C][/ROW]
[ROW][C]34[/C][C]2647[/C][C]2506.5955958734[/C][C]140.404404126602[/C][/ROW]
[ROW][C]35[/C][C]2534[/C][C]2439.55890270863[/C][C]94.4410972913673[/C][/ROW]
[ROW][C]36[/C][C]2297[/C][C]2259.64824464639[/C][C]37.3517553536122[/C][/ROW]
[ROW][C]37[/C][C]2718[/C][C]2498.42560381929[/C][C]219.574396180712[/C][/ROW]
[ROW][C]38[/C][C]2321[/C][C]2272.91781492603[/C][C]48.0821850739687[/C][/ROW]
[ROW][C]39[/C][C]3112[/C][C]3154.34021338076[/C][C]-42.3402133807557[/C][/ROW]
[ROW][C]40[/C][C]2664[/C][C]2595.89113828528[/C][C]68.108861714724[/C][/ROW]
[ROW][C]41[/C][C]2808[/C][C]2816.89994653848[/C][C]-8.89994653848041[/C][/ROW]
[ROW][C]42[/C][C]2668[/C][C]2611.51424124852[/C][C]56.4857587514788[/C][/ROW]
[ROW][C]43[/C][C]2934[/C][C]2663.51602808728[/C][C]270.483971912724[/C][/ROW]
[ROW][C]44[/C][C]2616[/C][C]2763.03931996138[/C][C]-147.039319961378[/C][/ROW]
[ROW][C]45[/C][C]2228[/C][C]2095.44289363889[/C][C]132.557106361112[/C][/ROW]
[ROW][C]46[/C][C]2463[/C][C]2594.58392795997[/C][C]-131.58392795997[/C][/ROW]
[ROW][C]47[/C][C]2416[/C][C]2513.67231350806[/C][C]-97.6723135080619[/C][/ROW]
[ROW][C]48[/C][C]2407[/C][C]2311.95820770888[/C][C]95.041792291122[/C][/ROW]
[ROW][C]49[/C][C]2582[/C][C]2566.09708687826[/C][C]15.9029131217424[/C][/ROW]
[ROW][C]50[/C][C]2101[/C][C]2378.74533152464[/C][C]-277.745331524644[/C][/ROW]
[ROW][C]51[/C][C]3305[/C][C]3271.56498675095[/C][C]33.4350132490494[/C][/ROW]
[ROW][C]52[/C][C]2818[/C][C]2724.51316842705[/C][C]93.4868315729473[/C][/ROW]
[ROW][C]53[/C][C]2401[/C][C]2924.70959474954[/C][C]-523.709594749542[/C][/ROW]
[ROW][C]54[/C][C]3019[/C][C]2716.35069204091[/C][C]302.64930795909[/C][/ROW]
[ROW][C]55[/C][C]2507[/C][C]2765.8748143641[/C][C]-258.874814364104[/C][/ROW]
[ROW][C]56[/C][C]2948[/C][C]2891.66135010315[/C][C]56.3386498968451[/C][/ROW]
[ROW][C]57[/C][C]2210[/C][C]2209.1989366873[/C][C]0.801063312702491[/C][/ROW]
[ROW][C]58[/C][C]2467[/C][C]2695.95164843057[/C][C]-228.951648430573[/C][/ROW]
[ROW][C]59[/C][C]2596[/C][C]2623.95962623469[/C][C]-27.9596262346853[/C][/ROW]
[ROW][C]60[/C][C]2451[/C][C]2450.4908959129[/C][C]0.509104087100356[/C][/ROW]
[/TABLE]
Source: https://freestatistics.org/blog/index.php?pk=157915&T=4

Globally Unique Identifier (entire table): ba.freestatistics.org/blog/index.php?pk=157915&T=4

As an alternative you can also use a QR Code:  

The GUIDs for individual cells are displayed in the table below:

Multiple Linear Regression - Actuals, Interpolation, and Residuals
Time or IndexActualsInterpolationForecastResidualsPrediction Error
117702126.4344346811-356.434434681096
222031992.1046999605210.895300039502
328362919.11612550155-83.1161255015498
419762362.15364911541-386.153649115407
528372559.87241092234277.127589077665
621502345.07158047324-195.071580473243
721802402.52422924623-222.524229246233
826312512.9492449888118.050755011195
917811851.29921350366-70.2992135036616
1023272340.03405685939-13.0340568593863
1122602245.2475211203414.7524788796649
1220512121.82761401289-70.8276140128869
1322502310.06061706834-60.0606170683371
1421022116.26693397426-14.2669339742648
1529572992.23847049475-35.2384704947543
1624852444.1955863646340.8044136353681
1728712621.10196624085249.898033759154
1824472429.0956493349217.9043506650825
1925702488.5304297203681.4695702796436
2026222601.4331099784920.566890021511
2118401940.77414429957-100.774144299571
2226822448.83477087667233.165229123327
2323692352.5616364282916.438363571715
2421192181.07503771895-62.0750377189484
2525312349.98225755302181.017742446979
2622142180.9652196145633.0347803854388
2732063078.74020387199127.25979612801
2827092525.24645780763183.753542192367
2927342728.41608154885.58391845120406
3023482529.96783690241-181.967836902408
3127022572.55449858203129.445501417969
3226422689.91697496817-47.9169749681734
3320642026.2848118705837.7151881294183
3426472506.5955958734140.404404126602
3525342439.5589027086394.4410972913673
3622972259.6482446463937.3517553536122
3727182498.42560381929219.574396180712
3823212272.9178149260348.0821850739687
3931123154.34021338076-42.3402133807557
4026642595.8911382852868.108861714724
4128082816.89994653848-8.89994653848041
4226682611.5142412485256.4857587514788
4329342663.51602808728270.483971912724
4426162763.03931996138-147.039319961378
4522282095.44289363889132.557106361112
4624632594.58392795997-131.58392795997
4724162513.67231350806-97.6723135080619
4824072311.9582077088895.041792291122
4925822566.0970868782615.9029131217424
5021012378.74533152464-277.745331524644
5133053271.5649867509533.4350132490494
5228182724.5131684270593.4868315729473
5324012924.70959474954-523.709594749542
5430192716.35069204091302.64930795909
5525072765.8748143641-258.874814364104
5629482891.6613501031556.3386498968451
5722102209.19893668730.801063312702491
5824672695.95164843057-228.951648430573
5925962623.95962623469-27.9596262346853
6024512450.49089591290.509104087100356


Goldfeld-Quandt test for Heteroskedasticity
p-valuesAlternative Hypothesis
breakpoint indexgreater2-sidedless
170.8210514121584560.3578971756830890.178948587841544
180.7244360197791330.5511279604417340.275563980220867
190.6480129075204160.7039741849591680.351987092479584
200.6047531320235470.7904937359529050.395246867976453
210.5542161519061910.8915676961876170.445783848093808
220.4962576975652460.9925153951304920.503742302434754
230.4046041540249810.8092083080499620.595395845975019
240.3382468679129720.6764937358259430.661753132087028
250.3384699290363370.6769398580726730.661530070963663
260.3303295552326460.6606591104652910.669670444767354
270.2441576728246390.4883153456492790.755842327175361
280.2167490756764580.4334981513529170.783250924323541
290.3685467283743840.7370934567487680.631453271625616
300.5510338840323310.8979322319353390.448966115967669
310.4580429978595820.9160859957191640.541957002140418
320.4356709118804760.8713418237609520.564329088119524
330.3917171009498790.7834342018997580.608282899050121
340.3280837304546350.6561674609092690.671916269545365
350.2391847626584480.4783695253168970.760815237341552
360.2428328802977350.485665760595470.757167119702265
370.2005849172615730.4011698345231470.799415082738427
380.1678075847647230.3356151695294460.832192415235277
390.1272265388660930.2544530777321850.872773461133908
400.07527151740707040.1505430348141410.92472848259293
410.1642983665902860.3285967331805720.835701633409714
420.2718902072614820.5437804145229630.728109792738518
430.6212173917935690.7575652164128620.378782608206431

\begin{tabular}{lllllllll}
\hline
Goldfeld-Quandt test for Heteroskedasticity \tabularnewline
p-values & Alternative Hypothesis \tabularnewline
breakpoint index & greater & 2-sided & less \tabularnewline
17 & 0.821051412158456 & 0.357897175683089 & 0.178948587841544 \tabularnewline
18 & 0.724436019779133 & 0.551127960441734 & 0.275563980220867 \tabularnewline
19 & 0.648012907520416 & 0.703974184959168 & 0.351987092479584 \tabularnewline
20 & 0.604753132023547 & 0.790493735952905 & 0.395246867976453 \tabularnewline
21 & 0.554216151906191 & 0.891567696187617 & 0.445783848093808 \tabularnewline
22 & 0.496257697565246 & 0.992515395130492 & 0.503742302434754 \tabularnewline
23 & 0.404604154024981 & 0.809208308049962 & 0.595395845975019 \tabularnewline
24 & 0.338246867912972 & 0.676493735825943 & 0.661753132087028 \tabularnewline
25 & 0.338469929036337 & 0.676939858072673 & 0.661530070963663 \tabularnewline
26 & 0.330329555232646 & 0.660659110465291 & 0.669670444767354 \tabularnewline
27 & 0.244157672824639 & 0.488315345649279 & 0.755842327175361 \tabularnewline
28 & 0.216749075676458 & 0.433498151352917 & 0.783250924323541 \tabularnewline
29 & 0.368546728374384 & 0.737093456748768 & 0.631453271625616 \tabularnewline
30 & 0.551033884032331 & 0.897932231935339 & 0.448966115967669 \tabularnewline
31 & 0.458042997859582 & 0.916085995719164 & 0.541957002140418 \tabularnewline
32 & 0.435670911880476 & 0.871341823760952 & 0.564329088119524 \tabularnewline
33 & 0.391717100949879 & 0.783434201899758 & 0.608282899050121 \tabularnewline
34 & 0.328083730454635 & 0.656167460909269 & 0.671916269545365 \tabularnewline
35 & 0.239184762658448 & 0.478369525316897 & 0.760815237341552 \tabularnewline
36 & 0.242832880297735 & 0.48566576059547 & 0.757167119702265 \tabularnewline
37 & 0.200584917261573 & 0.401169834523147 & 0.799415082738427 \tabularnewline
38 & 0.167807584764723 & 0.335615169529446 & 0.832192415235277 \tabularnewline
39 & 0.127226538866093 & 0.254453077732185 & 0.872773461133908 \tabularnewline
40 & 0.0752715174070704 & 0.150543034814141 & 0.92472848259293 \tabularnewline
41 & 0.164298366590286 & 0.328596733180572 & 0.835701633409714 \tabularnewline
42 & 0.271890207261482 & 0.543780414522963 & 0.728109792738518 \tabularnewline
43 & 0.621217391793569 & 0.757565216412862 & 0.378782608206431 \tabularnewline
\hline
\end{tabular}
%Source: https://freestatistics.org/blog/index.php?pk=157915&T=5

[TABLE]
[ROW][C]Goldfeld-Quandt test for Heteroskedasticity[/C][/ROW]
[ROW][C]p-values[/C][C]Alternative Hypothesis[/C][/ROW]
[ROW][C]breakpoint index[/C][C]greater[/C][C]2-sided[/C][C]less[/C][/ROW]
[ROW][C]17[/C][C]0.821051412158456[/C][C]0.357897175683089[/C][C]0.178948587841544[/C][/ROW]
[ROW][C]18[/C][C]0.724436019779133[/C][C]0.551127960441734[/C][C]0.275563980220867[/C][/ROW]
[ROW][C]19[/C][C]0.648012907520416[/C][C]0.703974184959168[/C][C]0.351987092479584[/C][/ROW]
[ROW][C]20[/C][C]0.604753132023547[/C][C]0.790493735952905[/C][C]0.395246867976453[/C][/ROW]
[ROW][C]21[/C][C]0.554216151906191[/C][C]0.891567696187617[/C][C]0.445783848093808[/C][/ROW]
[ROW][C]22[/C][C]0.496257697565246[/C][C]0.992515395130492[/C][C]0.503742302434754[/C][/ROW]
[ROW][C]23[/C][C]0.404604154024981[/C][C]0.809208308049962[/C][C]0.595395845975019[/C][/ROW]
[ROW][C]24[/C][C]0.338246867912972[/C][C]0.676493735825943[/C][C]0.661753132087028[/C][/ROW]
[ROW][C]25[/C][C]0.338469929036337[/C][C]0.676939858072673[/C][C]0.661530070963663[/C][/ROW]
[ROW][C]26[/C][C]0.330329555232646[/C][C]0.660659110465291[/C][C]0.669670444767354[/C][/ROW]
[ROW][C]27[/C][C]0.244157672824639[/C][C]0.488315345649279[/C][C]0.755842327175361[/C][/ROW]
[ROW][C]28[/C][C]0.216749075676458[/C][C]0.433498151352917[/C][C]0.783250924323541[/C][/ROW]
[ROW][C]29[/C][C]0.368546728374384[/C][C]0.737093456748768[/C][C]0.631453271625616[/C][/ROW]
[ROW][C]30[/C][C]0.551033884032331[/C][C]0.897932231935339[/C][C]0.448966115967669[/C][/ROW]
[ROW][C]31[/C][C]0.458042997859582[/C][C]0.916085995719164[/C][C]0.541957002140418[/C][/ROW]
[ROW][C]32[/C][C]0.435670911880476[/C][C]0.871341823760952[/C][C]0.564329088119524[/C][/ROW]
[ROW][C]33[/C][C]0.391717100949879[/C][C]0.783434201899758[/C][C]0.608282899050121[/C][/ROW]
[ROW][C]34[/C][C]0.328083730454635[/C][C]0.656167460909269[/C][C]0.671916269545365[/C][/ROW]
[ROW][C]35[/C][C]0.239184762658448[/C][C]0.478369525316897[/C][C]0.760815237341552[/C][/ROW]
[ROW][C]36[/C][C]0.242832880297735[/C][C]0.48566576059547[/C][C]0.757167119702265[/C][/ROW]
[ROW][C]37[/C][C]0.200584917261573[/C][C]0.401169834523147[/C][C]0.799415082738427[/C][/ROW]
[ROW][C]38[/C][C]0.167807584764723[/C][C]0.335615169529446[/C][C]0.832192415235277[/C][/ROW]
[ROW][C]39[/C][C]0.127226538866093[/C][C]0.254453077732185[/C][C]0.872773461133908[/C][/ROW]
[ROW][C]40[/C][C]0.0752715174070704[/C][C]0.150543034814141[/C][C]0.92472848259293[/C][/ROW]
[ROW][C]41[/C][C]0.164298366590286[/C][C]0.328596733180572[/C][C]0.835701633409714[/C][/ROW]
[ROW][C]42[/C][C]0.271890207261482[/C][C]0.543780414522963[/C][C]0.728109792738518[/C][/ROW]
[ROW][C]43[/C][C]0.621217391793569[/C][C]0.757565216412862[/C][C]0.378782608206431[/C][/ROW]
[/TABLE]
Source: https://freestatistics.org/blog/index.php?pk=157915&T=5

Globally Unique Identifier (entire table): ba.freestatistics.org/blog/index.php?pk=157915&T=5

As an alternative you can also use a QR Code:  

The GUIDs for individual cells are displayed in the table below:

Goldfeld-Quandt test for Heteroskedasticity
p-valuesAlternative Hypothesis
breakpoint indexgreater2-sidedless
170.8210514121584560.3578971756830890.178948587841544
180.7244360197791330.5511279604417340.275563980220867
190.6480129075204160.7039741849591680.351987092479584
200.6047531320235470.7904937359529050.395246867976453
210.5542161519061910.8915676961876170.445783848093808
220.4962576975652460.9925153951304920.503742302434754
230.4046041540249810.8092083080499620.595395845975019
240.3382468679129720.6764937358259430.661753132087028
250.3384699290363370.6769398580726730.661530070963663
260.3303295552326460.6606591104652910.669670444767354
270.2441576728246390.4883153456492790.755842327175361
280.2167490756764580.4334981513529170.783250924323541
290.3685467283743840.7370934567487680.631453271625616
300.5510338840323310.8979322319353390.448966115967669
310.4580429978595820.9160859957191640.541957002140418
320.4356709118804760.8713418237609520.564329088119524
330.3917171009498790.7834342018997580.608282899050121
340.3280837304546350.6561674609092690.671916269545365
350.2391847626584480.4783695253168970.760815237341552
360.2428328802977350.485665760595470.757167119702265
370.2005849172615730.4011698345231470.799415082738427
380.1678075847647230.3356151695294460.832192415235277
390.1272265388660930.2544530777321850.872773461133908
400.07527151740707040.1505430348141410.92472848259293
410.1642983665902860.3285967331805720.835701633409714
420.2718902072614820.5437804145229630.728109792738518
430.6212173917935690.7575652164128620.378782608206431


Meta Analysis of Goldfeld-Quandt test for Heteroskedasticity
Description# significant tests% significant testsOK/NOK
1% type I error level00OK
5% type I error level00OK
10% type I error level00OK

\begin{tabular}{lllllllll}
\hline
Meta Analysis of Goldfeld-Quandt test for Heteroskedasticity \tabularnewline
Description & # significant tests & % significant tests & OK/NOK \tabularnewline
1% type I error level & 0 & 0 & OK \tabularnewline
5% type I error level & 0 & 0 & OK \tabularnewline
10% type I error level & 0 & 0 & OK \tabularnewline
\hline
\end{tabular}
%Source: https://freestatistics.org/blog/index.php?pk=157915&T=6

[TABLE]
[ROW][C]Meta Analysis of Goldfeld-Quandt test for Heteroskedasticity[/C][/ROW]
[ROW][C]Description[/C][C]# significant tests[/C][C]% significant tests[/C][C]OK/NOK[/C][/ROW]
[ROW][C]1% type I error level[/C][C]0[/C][C]0[/C][C]OK[/C][/ROW]
[ROW][C]5% type I error level[/C][C]0[/C][C]0[/C][C]OK[/C][/ROW]
[ROW][C]10% type I error level[/C][C]0[/C][C]0[/C][C]OK[/C][/ROW]
[/TABLE]
Source: https://freestatistics.org/blog/index.php?pk=157915&T=6

Globally Unique Identifier (entire table): ba.freestatistics.org/blog/index.php?pk=157915&T=6

As an alternative you can also use a QR Code:  

The GUIDs for individual cells are displayed in the table below:

Meta Analysis of Goldfeld-Quandt test for Heteroskedasticity
Description# significant tests% significant testsOK/NOK
1% type I error level00OK
5% type I error level00OK
10% type I error level00OK


Parameters (Session):
par1 = 3 ; par2 = 1 ; par3 = 2 ; par4 = TRUE ;
Parameters (R input):
par1 = 1 ; par2 = Include Monthly Dummies ; par3 = Linear Trend ;
R code (references can be found in the software module):
library(lattice)
library(lmtest)
n25 <- 25 #minimum number of obs. for Goldfeld-Quandt test
par1 <- as.numeric(par1)
x <- t(y)
k <- length(x[1,])
n <- length(x[,1])
x1 <- cbind(x[,par1], x[,1:k!=par1])
mycolnames <- c(colnames(x)[par1], colnames(x)[1:k!=par1])
colnames(x1) <- mycolnames #colnames(x)[par1]
x <- x1
if (par3 == 'First Differences'){
x2 <- array(0, dim=c(n-1,k), dimnames=list(1:(n-1), paste('(1-B)',colnames(x),sep='')))
for (i in 1:n-1) {
for (j in 1:k) {
x2[i,j] <- x[i+1,j] - x[i,j]
}
}
x <- x2
}
if (par2 == 'Include Monthly Dummies'){
x2 <- array(0, dim=c(n,11), dimnames=list(1:n, paste('M', seq(1:11), sep ='')))
for (i in 1:11){
x2[seq(i,n,12),i] <- 1
}
x <- cbind(x, x2)
}
if (par2 == 'Include Quarterly Dummies'){
x2 <- array(0, dim=c(n,3), dimnames=list(1:n, paste('Q', seq(1:3), sep ='')))
for (i in 1:3){
x2[seq(i,n,4),i] <- 1
}
x <- cbind(x, x2)
}
k <- length(x[1,])
if (par3 == 'Linear Trend'){
x <- cbind(x, c(1:n))
colnames(x)[k+1] <- 't'
}
x
k <- length(x[1,])
df <- as.data.frame(x)
(mylm <- lm(df))
(mysum <- summary(mylm))
if (n > n25) {
kp3 <- k + 3
nmkm3 <- n - k - 3
gqarr <- array(NA, dim=c(nmkm3-kp3+1,3))
numgqtests <- 0
numsignificant1 <- 0
numsignificant5 <- 0
numsignificant10 <- 0
for (mypoint in kp3:nmkm3) {
j <- 0
numgqtests <- numgqtests + 1
for (myalt in c('greater', 'two.sided', 'less')) {
j <- j + 1
gqarr[mypoint-kp3+1,j] <- gqtest(mylm, point=mypoint, alternative=myalt)$p.value
}
if (gqarr[mypoint-kp3+1,2] < 0.01) numsignificant1 <- numsignificant1 + 1
if (gqarr[mypoint-kp3+1,2] < 0.05) numsignificant5 <- numsignificant5 + 1
if (gqarr[mypoint-kp3+1,2] < 0.10) numsignificant10 <- numsignificant10 + 1
}
gqarr
}
bitmap(file='test0.png')
plot(x[,1], type='l', main='Actuals and Interpolation', ylab='value of Actuals and Interpolation (dots)', xlab='time or index')
points(x[,1]-mysum$resid)
grid()
dev.off()
bitmap(file='test1.png')
plot(mysum$resid, type='b', pch=19, main='Residuals', ylab='value of Residuals', xlab='time or index')
grid()
dev.off()
bitmap(file='test2.png')
hist(mysum$resid, main='Residual Histogram', xlab='values of Residuals')
grid()
dev.off()
bitmap(file='test3.png')
densityplot(~mysum$resid,col='black',main='Residual Density Plot', xlab='values of Residuals')
dev.off()
bitmap(file='test4.png')
qqnorm(mysum$resid, main='Residual Normal Q-Q Plot')
qqline(mysum$resid)
grid()
dev.off()
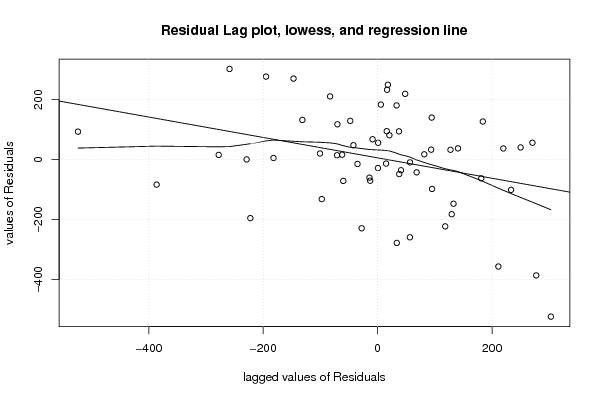
(myerror <- as.ts(mysum$resid))
bitmap(file='test5.png')
dum <- cbind(lag(myerror,k=1),myerror)
dum
dum1 <- dum[2:length(myerror),]
dum1
z <- as.data.frame(dum1)
z
plot(z,main=paste('Residual Lag plot, lowess, and regression line'), ylab='values of Residuals', xlab='lagged values of Residuals')
lines(lowess(z))
abline(lm(z))
grid()
dev.off()
bitmap(file='test6.png')
acf(mysum$resid, lag.max=length(mysum$resid)/2, main='Residual Autocorrelation Function')
grid()
dev.off()
bitmap(file='test7.png')
pacf(mysum$resid, lag.max=length(mysum$resid)/2, main='Residual Partial Autocorrelation Function')
grid()
dev.off()
bitmap(file='test8.png')
opar <- par(mfrow = c(2,2), oma = c(0, 0, 1.1, 0))
plot(mylm, las = 1, sub='Residual Diagnostics')
par(opar)
dev.off()
if (n > n25) {
bitmap(file='test9.png')
plot(kp3:nmkm3,gqarr[,2], main='Goldfeld-Quandt test',ylab='2-sided p-value',xlab='breakpoint')
grid()
dev.off()
}
load(file='createtable')
a<-table.start()
a<-table.row.start(a)
a<-table.element(a, 'Multiple Linear Regression - Estimated Regression Equation', 1, TRUE)
a<-table.row.end(a)
myeq <- colnames(x)[1]
myeq <- paste(myeq, '[t] = ', sep='')
for (i in 1:k){
if (mysum$coefficients[i,1] > 0) myeq <- paste(myeq, '+', '')
myeq <- paste(myeq, mysum$coefficients[i,1], sep=' ')
if (rownames(mysum$coefficients)[i] != '(Intercept)') {
myeq <- paste(myeq, rownames(mysum$coefficients)[i], sep='')
if (rownames(mysum$coefficients)[i] != 't') myeq <- paste(myeq, '[t]', sep='')
}
}
myeq <- paste(myeq, ' + e[t]')
a<-table.row.start(a)
a<-table.element(a, myeq)
a<-table.row.end(a)
a<-table.end(a)
table.save(a,file='mytable1.tab')
a<-table.start()
a<-table.row.start(a)
a<-table.element(a,hyperlink('ols1.htm','Multiple Linear Regression - Ordinary Least Squares',''), 6, TRUE)
a<-table.row.end(a)
a<-table.row.start(a)
a<-table.element(a,'Variable',header=TRUE)
a<-table.element(a,'Parameter',header=TRUE)
a<-table.element(a,'S.D.',header=TRUE)
a<-table.element(a,'T-STAT
H0: parameter = 0',header=TRUE)
a<-table.element(a,'2-tail p-value',header=TRUE)
a<-table.element(a,'1-tail p-value',header=TRUE)
a<-table.row.end(a)
for (i in 1:k){
a<-table.row.start(a)
a<-table.element(a,rownames(mysum$coefficients)[i],header=TRUE)
a<-table.element(a,mysum$coefficients[i,1])
a<-table.element(a, round(mysum$coefficients[i,2],6))
a<-table.element(a, round(mysum$coefficients[i,3],4))
a<-table.element(a, round(mysum$coefficients[i,4],6))
a<-table.element(a, round(mysum$coefficients[i,4]/2,6))
a<-table.row.end(a)
}
a<-table.end(a)
table.save(a,file='mytable2.tab')
a<-table.start()
a<-table.row.start(a)
a<-table.element(a, 'Multiple Linear Regression - Regression Statistics', 2, TRUE)
a<-table.row.end(a)
a<-table.row.start(a)
a<-table.element(a, 'Multiple R',1,TRUE)
a<-table.element(a, sqrt(mysum$r.squared))
a<-table.row.end(a)
a<-table.row.start(a)
a<-table.element(a, 'R-squared',1,TRUE)
a<-table.element(a, mysum$r.squared)
a<-table.row.end(a)
a<-table.row.start(a)
a<-table.element(a, 'Adjusted R-squared',1,TRUE)
a<-table.element(a, mysum$adj.r.squared)
a<-table.row.end(a)
a<-table.row.start(a)
a<-table.element(a, 'F-TEST (value)',1,TRUE)
a<-table.element(a, mysum$fstatistic[1])
a<-table.row.end(a)
a<-table.row.start(a)
a<-table.element(a, 'F-TEST (DF numerator)',1,TRUE)
a<-table.element(a, mysum$fstatistic[2])
a<-table.row.end(a)
a<-table.row.start(a)
a<-table.element(a, 'F-TEST (DF denominator)',1,TRUE)
a<-table.element(a, mysum$fstatistic[3])
a<-table.row.end(a)
a<-table.row.start(a)
a<-table.element(a, 'p-value',1,TRUE)
a<-table.element(a, 1-pf(mysum$fstatistic[1],mysum$fstatistic[2],mysum$fstatistic[3]))
a<-table.row.end(a)
a<-table.row.start(a)
a<-table.element(a, 'Multiple Linear Regression - Residual Statistics', 2, TRUE)
a<-table.row.end(a)
a<-table.row.start(a)
a<-table.element(a, 'Residual Standard Deviation',1,TRUE)
a<-table.element(a, mysum$sigma)
a<-table.row.end(a)
a<-table.row.start(a)
a<-table.element(a, 'Sum Squared Residuals',1,TRUE)
a<-table.element(a, sum(myerror*myerror))
a<-table.row.end(a)
a<-table.end(a)
table.save(a,file='mytable3.tab')
a<-table.start()
a<-table.row.start(a)
a<-table.element(a, 'Multiple Linear Regression - Actuals, Interpolation, and Residuals', 4, TRUE)
a<-table.row.end(a)
a<-table.row.start(a)
a<-table.element(a, 'Time or Index', 1, TRUE)
a<-table.element(a, 'Actuals', 1, TRUE)
a<-table.element(a, 'Interpolation
Forecast', 1, TRUE)
a<-table.element(a, 'Residuals
Prediction Error', 1, TRUE)
a<-table.row.end(a)
for (i in 1:n) {
a<-table.row.start(a)
a<-table.element(a,i, 1, TRUE)
a<-table.element(a,x[i])
a<-table.element(a,x[i]-mysum$resid[i])
a<-table.element(a,mysum$resid[i])
a<-table.row.end(a)
}
a<-table.end(a)
table.save(a,file='mytable4.tab')
if (n > n25) {
a<-table.start()
a<-table.row.start(a)
a<-table.element(a,'Goldfeld-Quandt test for Heteroskedasticity',4,TRUE)
a<-table.row.end(a)
a<-table.row.start(a)
a<-table.element(a,'p-values',header=TRUE)
a<-table.element(a,'Alternative Hypothesis',3,header=TRUE)
a<-table.row.end(a)
a<-table.row.start(a)
a<-table.element(a,'breakpoint index',header=TRUE)
a<-table.element(a,'greater',header=TRUE)
a<-table.element(a,'2-sided',header=TRUE)
a<-table.element(a,'less',header=TRUE)
a<-table.row.end(a)
for (mypoint in kp3:nmkm3) {
a<-table.row.start(a)
a<-table.element(a,mypoint,header=TRUE)
a<-table.element(a,gqarr[mypoint-kp3+1,1])
a<-table.element(a,gqarr[mypoint-kp3+1,2])
a<-table.element(a,gqarr[mypoint-kp3+1,3])
a<-table.row.end(a)
}
a<-table.end(a)
table.save(a,file='mytable5.tab')
a<-table.start()
a<-table.row.start(a)
a<-table.element(a,'Meta Analysis of Goldfeld-Quandt test for Heteroskedasticity',4,TRUE)
a<-table.row.end(a)
a<-table.row.start(a)
a<-table.element(a,'Description',header=TRUE)
a<-table.element(a,'# significant tests',header=TRUE)
a<-table.element(a,'% significant tests',header=TRUE)
a<-table.element(a,'OK/NOK',header=TRUE)
a<-table.row.end(a)
a<-table.row.start(a)
a<-table.element(a,'1% type I error level',header=TRUE)
a<-table.element(a,numsignificant1)
a<-table.element(a,numsignificant1/numgqtests)
if (numsignificant1/numgqtests < 0.01) dum <- 'OK' else dum <- 'NOK'
a<-table.element(a,dum)
a<-table.row.end(a)
a<-table.row.start(a)
a<-table.element(a,'5% type I error level',header=TRUE)
a<-table.element(a,numsignificant5)
a<-table.element(a,numsignificant5/numgqtests)
if (numsignificant5/numgqtests < 0.05) dum <- 'OK' else dum <- 'NOK'
a<-table.element(a,dum)
a<-table.row.end(a)
a<-table.row.start(a)
a<-table.element(a,'10% type I error level',header=TRUE)
a<-table.element(a,numsignificant10)
a<-table.element(a,numsignificant10/numgqtests)
if (numsignificant10/numgqtests < 0.1) dum <- 'OK' else dum <- 'NOK'
a<-table.element(a,dum)
a<-table.row.end(a)
a<-table.end(a)
table.save(a,file='mytable6.tab')
}