Free Statistics
of Irreproducible Research!
Description of Statistical Computation | |||||||||||||||||||||||||||||||||||||||||||||||||||||||||||||||||||||||||||||||||||||||||||||||||||||||||||||||||||||||||||||||||||||||||||||||||||||||||||||||||||||||||||||||||||||||||||||||||
|---|---|---|---|---|---|---|---|---|---|---|---|---|---|---|---|---|---|---|---|---|---|---|---|---|---|---|---|---|---|---|---|---|---|---|---|---|---|---|---|---|---|---|---|---|---|---|---|---|---|---|---|---|---|---|---|---|---|---|---|---|---|---|---|---|---|---|---|---|---|---|---|---|---|---|---|---|---|---|---|---|---|---|---|---|---|---|---|---|---|---|---|---|---|---|---|---|---|---|---|---|---|---|---|---|---|---|---|---|---|---|---|---|---|---|---|---|---|---|---|---|---|---|---|---|---|---|---|---|---|---|---|---|---|---|---|---|---|---|---|---|---|---|---|---|---|---|---|---|---|---|---|---|---|---|---|---|---|---|---|---|---|---|---|---|---|---|---|---|---|---|---|---|---|---|---|---|---|---|---|---|---|---|---|---|---|---|---|---|---|---|---|---|---|
| Author's title | |||||||||||||||||||||||||||||||||||||||||||||||||||||||||||||||||||||||||||||||||||||||||||||||||||||||||||||||||||||||||||||||||||||||||||||||||||||||||||||||||||||||||||||||||||||||||||||||||
| Author | *The author of this computation has been verified* | ||||||||||||||||||||||||||||||||||||||||||||||||||||||||||||||||||||||||||||||||||||||||||||||||||||||||||||||||||||||||||||||||||||||||||||||||||||||||||||||||||||||||||||||||||||||||||||||||
| R Software Module | rwasp_pairs.wasp | ||||||||||||||||||||||||||||||||||||||||||||||||||||||||||||||||||||||||||||||||||||||||||||||||||||||||||||||||||||||||||||||||||||||||||||||||||||||||||||||||||||||||||||||||||||||||||||||||
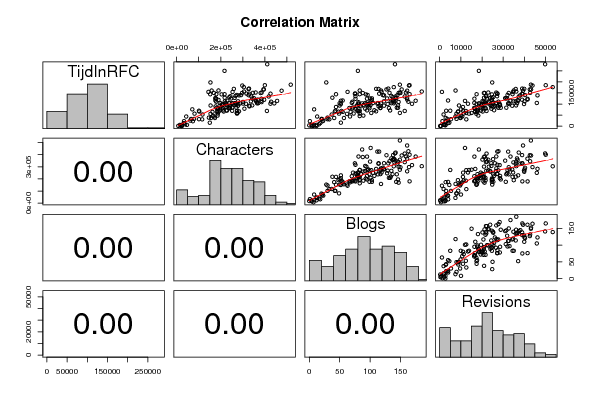
| Title produced by software | Kendall tau Correlation Matrix | ||||||||||||||||||||||||||||||||||||||||||||||||||||||||||||||||||||||||||||||||||||||||||||||||||||||||||||||||||||||||||||||||||||||||||||||||||||||||||||||||||||||||||||||||||||||||||||||||
| Date of computation | Tue, 20 Dec 2011 04:19:08 -0500 | ||||||||||||||||||||||||||||||||||||||||||||||||||||||||||||||||||||||||||||||||||||||||||||||||||||||||||||||||||||||||||||||||||||||||||||||||||||||||||||||||||||||||||||||||||||||||||||||||
| Cite this page as follows | Statistical Computations at FreeStatistics.org, Office for Research Development and Education, URL https://freestatistics.org/blog/index.php?v=date/2011/Dec/20/t1324372999e1p8m65yi2faod1.htm/, Retrieved Mon, 06 May 2024 01:18:53 +0000 | ||||||||||||||||||||||||||||||||||||||||||||||||||||||||||||||||||||||||||||||||||||||||||||||||||||||||||||||||||||||||||||||||||||||||||||||||||||||||||||||||||||||||||||||||||||||||||||||||
| Statistical Computations at FreeStatistics.org, Office for Research Development and Education, URL https://freestatistics.org/blog/index.php?pk=157822, Retrieved Mon, 06 May 2024 01:18:53 +0000 | |||||||||||||||||||||||||||||||||||||||||||||||||||||||||||||||||||||||||||||||||||||||||||||||||||||||||||||||||||||||||||||||||||||||||||||||||||||||||||||||||||||||||||||||||||||||||||||||||
| QR Codes: | |||||||||||||||||||||||||||||||||||||||||||||||||||||||||||||||||||||||||||||||||||||||||||||||||||||||||||||||||||||||||||||||||||||||||||||||||||||||||||||||||||||||||||||||||||||||||||||||||
|
| |||||||||||||||||||||||||||||||||||||||||||||||||||||||||||||||||||||||||||||||||||||||||||||||||||||||||||||||||||||||||||||||||||||||||||||||||||||||||||||||||||||||||||||||||||||||||||||||||
| Original text written by user: | |||||||||||||||||||||||||||||||||||||||||||||||||||||||||||||||||||||||||||||||||||||||||||||||||||||||||||||||||||||||||||||||||||||||||||||||||||||||||||||||||||||||||||||||||||||||||||||||||
| IsPrivate? | No (this computation is public) | ||||||||||||||||||||||||||||||||||||||||||||||||||||||||||||||||||||||||||||||||||||||||||||||||||||||||||||||||||||||||||||||||||||||||||||||||||||||||||||||||||||||||||||||||||||||||||||||||
| User-defined keywords | |||||||||||||||||||||||||||||||||||||||||||||||||||||||||||||||||||||||||||||||||||||||||||||||||||||||||||||||||||||||||||||||||||||||||||||||||||||||||||||||||||||||||||||||||||||||||||||||||
| Estimated Impact | 178 | ||||||||||||||||||||||||||||||||||||||||||||||||||||||||||||||||||||||||||||||||||||||||||||||||||||||||||||||||||||||||||||||||||||||||||||||||||||||||||||||||||||||||||||||||||||||||||||||||
Tree of Dependent Computations | |||||||||||||||||||||||||||||||||||||||||||||||||||||||||||||||||||||||||||||||||||||||||||||||||||||||||||||||||||||||||||||||||||||||||||||||||||||||||||||||||||||||||||||||||||||||||||||||||
| Family? (F = Feedback message, R = changed R code, M = changed R Module, P = changed Parameters, D = changed Data) | |||||||||||||||||||||||||||||||||||||||||||||||||||||||||||||||||||||||||||||||||||||||||||||||||||||||||||||||||||||||||||||||||||||||||||||||||||||||||||||||||||||||||||||||||||||||||||||||||
| - [Kendall tau Correlation Matrix] [] [2010-12-05 17:44:33] [b98453cac15ba1066b407e146608df68] - PD [Kendall tau Correlation Matrix] [WS10 PCM DMA] [2010-12-09 16:41:09] [2099aacba481f75a7f949aa310cab952] - R D [Kendall tau Correlation Matrix] [Workshop 10, Pear...] [2010-12-10 12:51:04] [3635fb7041b1998c5a1332cf9de22bce] - RM [Kendall tau Correlation Matrix] [] [2011-12-10 13:03:26] [c505444e07acba7694d29053ca5d114e] - R D [Kendall tau Correlation Matrix] [] [2011-12-18 13:52:08] [c505444e07acba7694d29053ca5d114e] - R PD [Kendall tau Correlation Matrix] [] [2011-12-20 09:19:08] [274a40ad31da88f12aea425a159a1f93] [Current] | |||||||||||||||||||||||||||||||||||||||||||||||||||||||||||||||||||||||||||||||||||||||||||||||||||||||||||||||||||||||||||||||||||||||||||||||||||||||||||||||||||||||||||||||||||||||||||||||||
| Feedback Forum | |||||||||||||||||||||||||||||||||||||||||||||||||||||||||||||||||||||||||||||||||||||||||||||||||||||||||||||||||||||||||||||||||||||||||||||||||||||||||||||||||||||||||||||||||||||||||||||||||
Post a new message | |||||||||||||||||||||||||||||||||||||||||||||||||||||||||||||||||||||||||||||||||||||||||||||||||||||||||||||||||||||||||||||||||||||||||||||||||||||||||||||||||||||||||||||||||||||||||||||||||
Dataset | |||||||||||||||||||||||||||||||||||||||||||||||||||||||||||||||||||||||||||||||||||||||||||||||||||||||||||||||||||||||||||||||||||||||||||||||||||||||||||||||||||||||||||||||||||||||||||||||||
| Dataseries X: | |||||||||||||||||||||||||||||||||||||||||||||||||||||||||||||||||||||||||||||||||||||||||||||||||||||||||||||||||||||||||||||||||||||||||||||||||||||||||||||||||||||||||||||||||||||||||||||||||
140824 272545 96 32033 110459 179444 71 20654 105079 222373 70 16346 112098 218443 134 35926 43929 171533 67 10621 76173 70849 8 10024 187326 517243 149 43068 22807 33186 1 1271 144408 217320 83 34416 66485 213274 82 20318 79089 307153 92 24409 81625 239766 117 20648 68788 185384 53 12347 103297 364569 139 21857 69446 251622 80 11034 114948 384524 175 33433 167949 325587 114 35902 125081 343085 100 22355 125818 176082 103 31219 136588 266736 135 21983 112431 278265 123 40085 103037 442703 87 18507 82317 180393 66 16278 118906 189897 103 24662 83515 238434 144 31452 104581 238006 113 32580 103129 267268 99 22883 83243 270787 117 27652 37110 155915 57 9845 113344 359764 138 20190 139165 283441 123 46201 86652 216853 44 10971 112302 336277 140 34811 69652 101014 43 3029 119442 396684 138 38941 69867 273950 83 4958 101629 425253 112 32344 70168 227636 79 19433 31081 115658 33 12558 103925 369702 135 36524 92622 329639 123 26041 79011 186409 76 16637 93487 206196 78 28395 64520 182286 68 16747 93473 153778 50 9105 114360 455401 101 11941 33032 78800 20 7935 96125 208277 101 19499 151911 358127 149 22938 89256 176357 99 25314 95676 224649 95 28527 5950 24188 8 2694 149695 380576 88 20867 32551 65029 21 3597 31701 101097 30 5296 100087 279128 97 32982 169707 328024 130 38975 150491 345663 132 42721 120192 367112 161 41455 95893 261528 89 23923 151715 385286 159 26719 176225 304468 139 53405 59900 272297 102 12526 104767 264889 92 26584 114799 229585 52 37062 72128 225460 107 25696 143592 203663 93 24634 89626 239986 85 27269 131072 238482 137 25270 126817 175816 143 24634 81351 239337 99 17828 22618 73566 22 3007 88977 242622 78 20065 92059 194855 83 24648 81897 209049 131 21588 108146 363250 140 25217 126372 350641 142 30927 249771 217036 80 18487 71154 208804 133 18050 71571 195793 95 17696 55918 153613 62 17326 160141 475859 161 39361 38692 145943 30 9648 102812 287359 118 26759 56622 80953 49 7905 15986 150216 52 4527 123534 179317 76 41517 108535 384720 81 21261 93879 342522 146 36099 144551 179811 165 39039 56750 273486 83 13841 127654 262811 161 23841 65594 190312 48 8589 59938 276134 149 15049 146975 328875 75 39038 161100 189654 83 34974 168553 259191 110 39932 183500 297464 164 43840 165986 393266 152 43146 184923 399801 165 50099 140358 291970 121 40312 149959 296670 150 32616 57224 186856 73 11338 43750 43287 13 7409 48029 185468 89 18213 104978 250254 105 45873 100046 268391 129 39844 101047 314131 169 28317 197426 153059 28 24797 160902 158511 118 7471 147172 316505 76 27259 109432 300526 147 23201 1168 23623 12 238 83248 195817 146 28830 25162 61857 23 3913 45724 163871 83 9935 110529 428191 163 27738 855 21054 4 338 101382 252805 81 13326 14116 31961 18 3988 89506 329583 114 24347 135356 243164 76 27111 116066 175582 55 3938 144244 152043 44 17416 8773 38214 16 1888 102153 224597 81 18700 117440 357602 137 36809 104128 198104 50 24959 134238 417399 142 37343 134047 338606 157 21849 279488 410575 141 49809 79756 187992 71 21654 66089 102424 42 8728 102070 301282 94 20920 146760 425430 115 27195 154771 143860 63 1037 165933 395382 127 42570 64593 162422 55 17672 92280 278077 117 34245 67150 282410 110 16786 128692 217665 38 20954 124089 384177 95 16378 125386 246963 128 31852 37238 173260 41 2805 140015 325961 145 38086 150047 168994 147 21166 154451 253330 119 34672 156349 305217 185 36171 6023 14688 4 2065 84601 251752 72 19354 68946 409163 157 22124 1644 7199 7 556 6179 46660 12 2089 3926 17547 0 2658 52789 116969 37 1813 100350 206501 52 17372 | |||||||||||||||||||||||||||||||||||||||||||||||||||||||||||||||||||||||||||||||||||||||||||||||||||||||||||||||||||||||||||||||||||||||||||||||||||||||||||||||||||||||||||||||||||||||||||||||||
Tables (Output of Computation) | |||||||||||||||||||||||||||||||||||||||||||||||||||||||||||||||||||||||||||||||||||||||||||||||||||||||||||||||||||||||||||||||||||||||||||||||||||||||||||||||||||||||||||||||||||||||||||||||||
| |||||||||||||||||||||||||||||||||||||||||||||||||||||||||||||||||||||||||||||||||||||||||||||||||||||||||||||||||||||||||||||||||||||||||||||||||||||||||||||||||||||||||||||||||||||||||||||||||
Figures (Output of Computation) | |||||||||||||||||||||||||||||||||||||||||||||||||||||||||||||||||||||||||||||||||||||||||||||||||||||||||||||||||||||||||||||||||||||||||||||||||||||||||||||||||||||||||||||||||||||||||||||||||
Input Parameters & R Code | |||||||||||||||||||||||||||||||||||||||||||||||||||||||||||||||||||||||||||||||||||||||||||||||||||||||||||||||||||||||||||||||||||||||||||||||||||||||||||||||||||||||||||||||||||||||||||||||||
| Parameters (Session): | |||||||||||||||||||||||||||||||||||||||||||||||||||||||||||||||||||||||||||||||||||||||||||||||||||||||||||||||||||||||||||||||||||||||||||||||||||||||||||||||||||||||||||||||||||||||||||||||||
| par1 = kendall ; | |||||||||||||||||||||||||||||||||||||||||||||||||||||||||||||||||||||||||||||||||||||||||||||||||||||||||||||||||||||||||||||||||||||||||||||||||||||||||||||||||||||||||||||||||||||||||||||||||
| Parameters (R input): | |||||||||||||||||||||||||||||||||||||||||||||||||||||||||||||||||||||||||||||||||||||||||||||||||||||||||||||||||||||||||||||||||||||||||||||||||||||||||||||||||||||||||||||||||||||||||||||||||
| par1 = kendall ; | |||||||||||||||||||||||||||||||||||||||||||||||||||||||||||||||||||||||||||||||||||||||||||||||||||||||||||||||||||||||||||||||||||||||||||||||||||||||||||||||||||||||||||||||||||||||||||||||||
| R code (references can be found in the software module): | |||||||||||||||||||||||||||||||||||||||||||||||||||||||||||||||||||||||||||||||||||||||||||||||||||||||||||||||||||||||||||||||||||||||||||||||||||||||||||||||||||||||||||||||||||||||||||||||||
panel.tau <- function(x, y, digits=2, prefix='', cex.cor) | |||||||||||||||||||||||||||||||||||||||||||||||||||||||||||||||||||||||||||||||||||||||||||||||||||||||||||||||||||||||||||||||||||||||||||||||||||||||||||||||||||||||||||||||||||||||||||||||||