Free Statistics

of Irreproducible Research!

Author's title

Author*The author of this computation has been verified*
R Software Modulerwasp_autocorrelation.wasp
Title produced by software(Partial) Autocorrelation Function
Date of computationSun, 18 Dec 2011 14:16:56 -0500
Cite this page as followsStatistical Computations at FreeStatistics.org, Office for Research Development and Education, URL https://freestatistics.org/blog/index.php?v=date/2011/Dec/18/t132423584696xu9ncb9lwh02h.htm/, Retrieved Sun, 05 May 2024 18:23:43 +0000
Statistical Computations at FreeStatistics.org, Office for Research Development and Education, URL https://freestatistics.org/blog/index.php?pk=157138, Retrieved Sun, 05 May 2024 18:23:43 +0000
QR Codes:

Original text written by user:
IsPrivate?No (this computation is public)
User-defined keywords
Estimated Impact93
Family? (F = Feedback message, R = changed R code, M = changed R Module, P = changed Parameters, D = changed Data)
-     [Univariate Data Series] [data set] [2008-12-01 19:54:57] [b98453cac15ba1066b407e146608df68]
- RMP   [(Partial) Autocorrelation Function] [Unemployment] [2010-11-29 09:05:21] [b98453cac15ba1066b407e146608df68]
- R  D    [(Partial) Autocorrelation Function] [WS IX-aantal over...] [2011-12-06 19:19:57] [74be16979710d4c4e7c6647856088456]
-    D        [(Partial) Autocorrelation Function] [Paper acf] [2011-12-18 19:16:56] [3e388c05c22237d436c48535c44f60bb] [Current]
-   P           [(Partial) Autocorrelation Function] [Paper acf-aanpassing] [2011-12-18 19:18:35] [7c680a04865e75aa8ab422cdbfd97ac3]
Feedback Forum

Post a new message
Dataseries X:
18992
0
21552
1868501
7185612
10348382
6942386
4306121
2833176
1515513
1242981
699343
89497
128
10585
1070323
7167741
13193530
7885720
6785683
3106846
1706331
1286534
499079
24637
16
27309
873433
8435418
11290088
6840395
3803252
4388988
2680940
1174135
328388
22943
5657
28156
770831
8378147
13274946
7297840
2848227
2892179
1762224
1009375
188388
3393
0
13807
2619905
13297704
6240087
5108460
4553381
3148546
2433387
1748108
723454
58525
792
42585
1634386
10360570
6798599
4847748
4971202
343863
2200366
1549422
90144
63288
338
44863
1678135
9293357
9361258
6766402
4331272
3518962
2425786
1701795
552452
16104
0
90198
1731332
7954135
11561342
6834733
4255652
4243070
3415216
1841237
655456


Summary of computational transaction
Raw Inputview raw input (R code)
Raw Outputview raw output of R engine
Computing time2 seconds
R Server'AstonUniversity' @ aston.wessa.net

\begin{tabular}{lllllllll}
\hline
Summary of computational transaction \tabularnewline
Raw Input & view raw input (R code)  \tabularnewline
Raw Output & view raw output of R engine  \tabularnewline
Computing time & 2 seconds \tabularnewline
R Server & 'AstonUniversity' @ aston.wessa.net \tabularnewline
\hline
\end{tabular}
%Source: https://freestatistics.org/blog/index.php?pk=157138&T=0

[TABLE]
[ROW][C]Summary of computational transaction[/C][/ROW]
[ROW][C]Raw Input[/C][C]view raw input (R code) [/C][/ROW]
[ROW][C]Raw Output[/C][C]view raw output of R engine [/C][/ROW]
[ROW][C]Computing time[/C][C]2 seconds[/C][/ROW]
[ROW][C]R Server[/C][C]'AstonUniversity' @ aston.wessa.net[/C][/ROW]
[/TABLE]
Source: https://freestatistics.org/blog/index.php?pk=157138&T=0

Globally Unique Identifier (entire table): ba.freestatistics.org/blog/index.php?pk=157138&T=0

As an alternative you can also use a QR Code:  

The GUIDs for individual cells are displayed in the table below:

Summary of computational transaction
Raw Inputview raw input (R code)
Raw Outputview raw output of R engine
Computing time2 seconds
R Server'AstonUniversity' @ aston.wessa.net


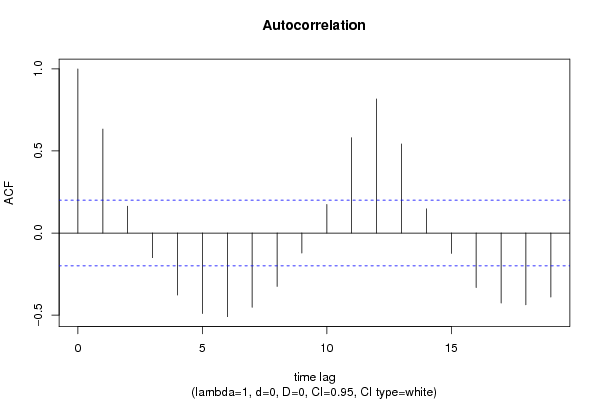
Autocorrelation Function
Time lag kACF(k)T-STATP-value
10.6332996.2050
20.1630481.59750.056716
3-0.15032-1.47280.072034
4-0.377764-3.70130.000179
5-0.491052-4.81133e-06
6-0.509885-4.99581e-06
7-0.452852-4.4371.2e-05
8-0.325671-3.19090.000958
9-0.122122-1.19650.117215
100.1743981.70870.045365
110.5804085.68680
120.8173728.00860
130.5432625.32290
140.147271.44290.076145
15-0.124412-1.2190.112919
16-0.332354-3.25640.00078
17-0.427311-4.18683.1e-05
18-0.437049-4.28222.2e-05
19-0.390375-3.82490.000116

\begin{tabular}{lllllllll}
\hline
Autocorrelation Function \tabularnewline
Time lag k & ACF(k) & T-STAT & P-value \tabularnewline
1 & 0.633299 & 6.205 & 0 \tabularnewline
2 & 0.163048 & 1.5975 & 0.056716 \tabularnewline
3 & -0.15032 & -1.4728 & 0.072034 \tabularnewline
4 & -0.377764 & -3.7013 & 0.000179 \tabularnewline
5 & -0.491052 & -4.8113 & 3e-06 \tabularnewline
6 & -0.509885 & -4.9958 & 1e-06 \tabularnewline
7 & -0.452852 & -4.437 & 1.2e-05 \tabularnewline
8 & -0.325671 & -3.1909 & 0.000958 \tabularnewline
9 & -0.122122 & -1.1965 & 0.117215 \tabularnewline
10 & 0.174398 & 1.7087 & 0.045365 \tabularnewline
11 & 0.580408 & 5.6868 & 0 \tabularnewline
12 & 0.817372 & 8.0086 & 0 \tabularnewline
13 & 0.543262 & 5.3229 & 0 \tabularnewline
14 & 0.14727 & 1.4429 & 0.076145 \tabularnewline
15 & -0.124412 & -1.219 & 0.112919 \tabularnewline
16 & -0.332354 & -3.2564 & 0.00078 \tabularnewline
17 & -0.427311 & -4.1868 & 3.1e-05 \tabularnewline
18 & -0.437049 & -4.2822 & 2.2e-05 \tabularnewline
19 & -0.390375 & -3.8249 & 0.000116 \tabularnewline
\hline
\end{tabular}
%Source: https://freestatistics.org/blog/index.php?pk=157138&T=1

[TABLE]
[ROW][C]Autocorrelation Function[/C][/ROW]
[ROW][C]Time lag k[/C][C]ACF(k)[/C][C]T-STAT[/C][C]P-value[/C][/ROW]
[ROW][C]1[/C][C]0.633299[/C][C]6.205[/C][C]0[/C][/ROW]
[ROW][C]2[/C][C]0.163048[/C][C]1.5975[/C][C]0.056716[/C][/ROW]
[ROW][C]3[/C][C]-0.15032[/C][C]-1.4728[/C][C]0.072034[/C][/ROW]
[ROW][C]4[/C][C]-0.377764[/C][C]-3.7013[/C][C]0.000179[/C][/ROW]
[ROW][C]5[/C][C]-0.491052[/C][C]-4.8113[/C][C]3e-06[/C][/ROW]
[ROW][C]6[/C][C]-0.509885[/C][C]-4.9958[/C][C]1e-06[/C][/ROW]
[ROW][C]7[/C][C]-0.452852[/C][C]-4.437[/C][C]1.2e-05[/C][/ROW]
[ROW][C]8[/C][C]-0.325671[/C][C]-3.1909[/C][C]0.000958[/C][/ROW]
[ROW][C]9[/C][C]-0.122122[/C][C]-1.1965[/C][C]0.117215[/C][/ROW]
[ROW][C]10[/C][C]0.174398[/C][C]1.7087[/C][C]0.045365[/C][/ROW]
[ROW][C]11[/C][C]0.580408[/C][C]5.6868[/C][C]0[/C][/ROW]
[ROW][C]12[/C][C]0.817372[/C][C]8.0086[/C][C]0[/C][/ROW]
[ROW][C]13[/C][C]0.543262[/C][C]5.3229[/C][C]0[/C][/ROW]
[ROW][C]14[/C][C]0.14727[/C][C]1.4429[/C][C]0.076145[/C][/ROW]
[ROW][C]15[/C][C]-0.124412[/C][C]-1.219[/C][C]0.112919[/C][/ROW]
[ROW][C]16[/C][C]-0.332354[/C][C]-3.2564[/C][C]0.00078[/C][/ROW]
[ROW][C]17[/C][C]-0.427311[/C][C]-4.1868[/C][C]3.1e-05[/C][/ROW]
[ROW][C]18[/C][C]-0.437049[/C][C]-4.2822[/C][C]2.2e-05[/C][/ROW]
[ROW][C]19[/C][C]-0.390375[/C][C]-3.8249[/C][C]0.000116[/C][/ROW]
[/TABLE]
Source: https://freestatistics.org/blog/index.php?pk=157138&T=1

Globally Unique Identifier (entire table): ba.freestatistics.org/blog/index.php?pk=157138&T=1

As an alternative you can also use a QR Code:  

The GUIDs for individual cells are displayed in the table below:

Autocorrelation Function
Time lag kACF(k)T-STATP-value
10.6332996.2050
20.1630481.59750.056716
3-0.15032-1.47280.072034
4-0.377764-3.70130.000179
5-0.491052-4.81133e-06
6-0.509885-4.99581e-06
7-0.452852-4.4371.2e-05
8-0.325671-3.19090.000958
9-0.122122-1.19650.117215
100.1743981.70870.045365
110.5804085.68680
120.8173728.00860
130.5432625.32290
140.147271.44290.076145
15-0.124412-1.2190.112919
16-0.332354-3.25640.00078
17-0.427311-4.18683.1e-05
18-0.437049-4.28222.2e-05
19-0.390375-3.82490.000116


Partial Autocorrelation Function
Time lag kPACF(k)T-STATP-value
10.6332996.2050
2-0.397405-3.89389.1e-05
3-0.085135-0.83420.203133
4-0.28639-2.8060.003036
5-0.186028-1.82270.035732
6-0.278862-2.73230.003744
7-0.285722-2.79950.003094
8-0.341583-3.34680.000584
9-0.343239-3.3630.000554
10-0.233618-2.2890.012136
110.2466742.41690.008771
120.3415773.34680.000584
13-0.276762-2.71170.003966
14-0.048185-0.47210.318957
150.0398460.39040.34855
160.0142340.13950.444687
170.0759120.74380.229413
180.0109090.10690.457549
19-0.003023-0.02960.488217

\begin{tabular}{lllllllll}
\hline
Partial Autocorrelation Function \tabularnewline
Time lag k & PACF(k) & T-STAT & P-value \tabularnewline
1 & 0.633299 & 6.205 & 0 \tabularnewline
2 & -0.397405 & -3.8938 & 9.1e-05 \tabularnewline
3 & -0.085135 & -0.8342 & 0.203133 \tabularnewline
4 & -0.28639 & -2.806 & 0.003036 \tabularnewline
5 & -0.186028 & -1.8227 & 0.035732 \tabularnewline
6 & -0.278862 & -2.7323 & 0.003744 \tabularnewline
7 & -0.285722 & -2.7995 & 0.003094 \tabularnewline
8 & -0.341583 & -3.3468 & 0.000584 \tabularnewline
9 & -0.343239 & -3.363 & 0.000554 \tabularnewline
10 & -0.233618 & -2.289 & 0.012136 \tabularnewline
11 & 0.246674 & 2.4169 & 0.008771 \tabularnewline
12 & 0.341577 & 3.3468 & 0.000584 \tabularnewline
13 & -0.276762 & -2.7117 & 0.003966 \tabularnewline
14 & -0.048185 & -0.4721 & 0.318957 \tabularnewline
15 & 0.039846 & 0.3904 & 0.34855 \tabularnewline
16 & 0.014234 & 0.1395 & 0.444687 \tabularnewline
17 & 0.075912 & 0.7438 & 0.229413 \tabularnewline
18 & 0.010909 & 0.1069 & 0.457549 \tabularnewline
19 & -0.003023 & -0.0296 & 0.488217 \tabularnewline
\hline
\end{tabular}
%Source: https://freestatistics.org/blog/index.php?pk=157138&T=2

[TABLE]
[ROW][C]Partial Autocorrelation Function[/C][/ROW]
[ROW][C]Time lag k[/C][C]PACF(k)[/C][C]T-STAT[/C][C]P-value[/C][/ROW]
[ROW][C]1[/C][C]0.633299[/C][C]6.205[/C][C]0[/C][/ROW]
[ROW][C]2[/C][C]-0.397405[/C][C]-3.8938[/C][C]9.1e-05[/C][/ROW]
[ROW][C]3[/C][C]-0.085135[/C][C]-0.8342[/C][C]0.203133[/C][/ROW]
[ROW][C]4[/C][C]-0.28639[/C][C]-2.806[/C][C]0.003036[/C][/ROW]
[ROW][C]5[/C][C]-0.186028[/C][C]-1.8227[/C][C]0.035732[/C][/ROW]
[ROW][C]6[/C][C]-0.278862[/C][C]-2.7323[/C][C]0.003744[/C][/ROW]
[ROW][C]7[/C][C]-0.285722[/C][C]-2.7995[/C][C]0.003094[/C][/ROW]
[ROW][C]8[/C][C]-0.341583[/C][C]-3.3468[/C][C]0.000584[/C][/ROW]
[ROW][C]9[/C][C]-0.343239[/C][C]-3.363[/C][C]0.000554[/C][/ROW]
[ROW][C]10[/C][C]-0.233618[/C][C]-2.289[/C][C]0.012136[/C][/ROW]
[ROW][C]11[/C][C]0.246674[/C][C]2.4169[/C][C]0.008771[/C][/ROW]
[ROW][C]12[/C][C]0.341577[/C][C]3.3468[/C][C]0.000584[/C][/ROW]
[ROW][C]13[/C][C]-0.276762[/C][C]-2.7117[/C][C]0.003966[/C][/ROW]
[ROW][C]14[/C][C]-0.048185[/C][C]-0.4721[/C][C]0.318957[/C][/ROW]
[ROW][C]15[/C][C]0.039846[/C][C]0.3904[/C][C]0.34855[/C][/ROW]
[ROW][C]16[/C][C]0.014234[/C][C]0.1395[/C][C]0.444687[/C][/ROW]
[ROW][C]17[/C][C]0.075912[/C][C]0.7438[/C][C]0.229413[/C][/ROW]
[ROW][C]18[/C][C]0.010909[/C][C]0.1069[/C][C]0.457549[/C][/ROW]
[ROW][C]19[/C][C]-0.003023[/C][C]-0.0296[/C][C]0.488217[/C][/ROW]
[/TABLE]
Source: https://freestatistics.org/blog/index.php?pk=157138&T=2

Globally Unique Identifier (entire table): ba.freestatistics.org/blog/index.php?pk=157138&T=2

As an alternative you can also use a QR Code:  

The GUIDs for individual cells are displayed in the table below:

Partial Autocorrelation Function
Time lag kPACF(k)T-STATP-value
10.6332996.2050
2-0.397405-3.89389.1e-05
3-0.085135-0.83420.203133
4-0.28639-2.8060.003036
5-0.186028-1.82270.035732
6-0.278862-2.73230.003744
7-0.285722-2.79950.003094
8-0.341583-3.34680.000584
9-0.343239-3.3630.000554
10-0.233618-2.2890.012136
110.2466742.41690.008771
120.3415773.34680.000584
13-0.276762-2.71170.003966
14-0.048185-0.47210.318957
150.0398460.39040.34855
160.0142340.13950.444687
170.0759120.74380.229413
180.0109090.10690.457549
19-0.003023-0.02960.488217


Parameters (Session):
par1 = Default ; par2 = 1 ; par3 = 0 ; par4 = 0 ; par5 = 12 ; par6 = White Noise ; par7 = 0.95 ;
Parameters (R input):
par1 = Default ; par2 = 1 ; par3 = 0 ; par4 = 0 ; par5 = 12 ; par6 = White Noise ; par7 = 0.95 ; par8 = ;
R code (references can be found in the software module):
if (par1 == 'Default') {
par1 = 10*log10(length(x))
} else {
par1 <- as.numeric(par1)
}
par2 <- as.numeric(par2)
par3 <- as.numeric(par3)
par4 <- as.numeric(par4)
par5 <- as.numeric(par5)
if (par6 == 'White Noise') par6 <- 'white' else par6 <- 'ma'
par7 <- as.numeric(par7)
if (par2 == 0) {
x <- log(x)
} else {
x <- (x ^ par2 - 1) / par2
}
if (par3 > 0) x <- diff(x,lag=1,difference=par3)
if (par4 > 0) x <- diff(x,lag=par5,difference=par4)
bitmap(file='pic1.png')
racf <- acf(x, par1, main='Autocorrelation', xlab='time lag', ylab='ACF', ci.type=par6, ci=par7, sub=paste('(lambda=',par2,', d=',par3,', D=',par4,', CI=', par7, ', CI type=',par6,')',sep=''))
dev.off()
bitmap(file='pic2.png')
rpacf <- pacf(x,par1,main='Partial Autocorrelation',xlab='lags',ylab='PACF')
dev.off()
(myacf <- c(racf$acf))
(mypacf <- c(rpacf$acf))
lengthx <- length(x)
sqrtn <- sqrt(lengthx)
load(file='createtable')
a<-table.start()
a<-table.row.start(a)
a<-table.element(a,'Autocorrelation Function',4,TRUE)
a<-table.row.end(a)
a<-table.row.start(a)
a<-table.element(a,'Time lag k',header=TRUE)
a<-table.element(a,hyperlink('basics.htm','ACF(k)','click here for more information about the Autocorrelation Function'),header=TRUE)
a<-table.element(a,'T-STAT',header=TRUE)
a<-table.element(a,'P-value',header=TRUE)
a<-table.row.end(a)
for (i in 2:(par1+1)) {
a<-table.row.start(a)
a<-table.element(a,i-1,header=TRUE)
a<-table.element(a,round(myacf[i],6))
mytstat <- myacf[i]*sqrtn
a<-table.element(a,round(mytstat,4))
a<-table.element(a,round(1-pt(abs(mytstat),lengthx),6))
a<-table.row.end(a)
}
a<-table.end(a)
table.save(a,file='mytable.tab')
a<-table.start()
a<-table.row.start(a)
a<-table.element(a,'Partial Autocorrelation Function',4,TRUE)
a<-table.row.end(a)
a<-table.row.start(a)
a<-table.element(a,'Time lag k',header=TRUE)
a<-table.element(a,hyperlink('basics.htm','PACF(k)','click here for more information about the Partial Autocorrelation Function'),header=TRUE)
a<-table.element(a,'T-STAT',header=TRUE)
a<-table.element(a,'P-value',header=TRUE)
a<-table.row.end(a)
for (i in 1:par1) {
a<-table.row.start(a)
a<-table.element(a,i,header=TRUE)
a<-table.element(a,round(mypacf[i],6))
mytstat <- mypacf[i]*sqrtn
a<-table.element(a,round(mytstat,4))
a<-table.element(a,round(1-pt(abs(mytstat),lengthx),6))
a<-table.row.end(a)
}
a<-table.end(a)
table.save(a,file='mytable1.tab')