Free Statistics
of Irreproducible Research!
Description of Statistical Computation | |||||||||||||||||||||||||||||||||||||||||
|---|---|---|---|---|---|---|---|---|---|---|---|---|---|---|---|---|---|---|---|---|---|---|---|---|---|---|---|---|---|---|---|---|---|---|---|---|---|---|---|---|---|
| Author's title | |||||||||||||||||||||||||||||||||||||||||
| Author | *The author of this computation has been verified* | ||||||||||||||||||||||||||||||||||||||||
| R Software Module | rwasp_univariatedataseries.wasp | ||||||||||||||||||||||||||||||||||||||||
| Title produced by software | Univariate Data Series | ||||||||||||||||||||||||||||||||||||||||
| Date of computation | Sun, 18 Dec 2011 08:06:11 -0500 | ||||||||||||||||||||||||||||||||||||||||
| Cite this page as follows | Statistical Computations at FreeStatistics.org, Office for Research Development and Education, URL https://freestatistics.org/blog/index.php?v=date/2011/Dec/18/t1324213748b79xexxo6ra5u1k.htm/, Retrieved Sun, 05 May 2024 11:48:53 +0000 | ||||||||||||||||||||||||||||||||||||||||
| Statistical Computations at FreeStatistics.org, Office for Research Development and Education, URL https://freestatistics.org/blog/index.php?pk=156821, Retrieved Sun, 05 May 2024 11:48:53 +0000 | |||||||||||||||||||||||||||||||||||||||||
| QR Codes: | |||||||||||||||||||||||||||||||||||||||||
|
| |||||||||||||||||||||||||||||||||||||||||
| Original text written by user: | |||||||||||||||||||||||||||||||||||||||||
| IsPrivate? | No (this computation is public) | ||||||||||||||||||||||||||||||||||||||||
| User-defined keywords | |||||||||||||||||||||||||||||||||||||||||
| Estimated Impact | 110 | ||||||||||||||||||||||||||||||||||||||||
Tree of Dependent Computations | |||||||||||||||||||||||||||||||||||||||||
| Family? (F = Feedback message, R = changed R code, M = changed R Module, P = changed Parameters, D = changed Data) | |||||||||||||||||||||||||||||||||||||||||
| - [Central Tendency] [SHW_WS3_Yt=c+Xt] [2009-10-16 08:10:06] [8b1aef4e7013bd33fbc2a5833375c5f5] - M D [Central Tendency] [paper univariate] [2010-12-04 09:51:15] [814f53995537cd15c528d8efbf1cf544] - RMPD [Univariate Data Series] [Aantal seconden i...] [2011-12-18 13:06:11] [274a40ad31da88f12aea425a159a1f93] [Current] | |||||||||||||||||||||||||||||||||||||||||
| Feedback Forum | |||||||||||||||||||||||||||||||||||||||||
Post a new message | |||||||||||||||||||||||||||||||||||||||||
Dataset | |||||||||||||||||||||||||||||||||||||||||
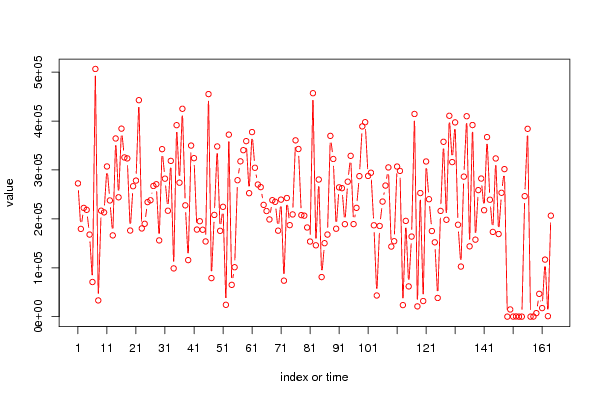
| Dataseries X: | |||||||||||||||||||||||||||||||||||||||||
272545 179444 222373 218443 167843 70849 506574 33186 216660 213274 307153 237633 166215 364402 244103 384448 325587 323652 176082 266736 278265 442703 180393 189897 234247 238002 267268 270787 155915 342564 282172 216584 318563 98672 391593 273950 425120 227636 115658 349863 324178 178083 195153 177694 153778 455168 78800 208051 348077 175523 224591 24188 372238 65029 101097 279012 317644 340471 358958 252529 377482 304468 270190 264889 228595 216027 198798 238146 234891 175816 239314 73566 242622 187167 209049 360592 342846 207650 206500 182357 153613 456979 145943 280366 80953 150216 167878 369718 322454 179797 264350 262793 189142 275997 328875 189252 222504 287386 389104 397681 287748 294320 186856 43287 185468 235352 268077 305195 143356 154287 307000 298039 23623 195817 61857 163766 414506 21054 252805 31961 317367 240153 175083 152043 38214 216299 357602 198104 410803 316105 397297 187992 102424 286327 409878 143860 391854 157429 258751 282399 217665 367246 239072 173260 323545 168994 253330 301703 1 14688 98 455 0 0 246435 384136 0 203 7199 46660 17547 116678 969 206501 | |||||||||||||||||||||||||||||||||||||||||
Tables (Output of Computation) | |||||||||||||||||||||||||||||||||||||||||
| |||||||||||||||||||||||||||||||||||||||||
Figures (Output of Computation) | |||||||||||||||||||||||||||||||||||||||||
Input Parameters & R Code | |||||||||||||||||||||||||||||||||||||||||
| Parameters (Session): | |||||||||||||||||||||||||||||||||||||||||
| par4 = No season ; | |||||||||||||||||||||||||||||||||||||||||
| Parameters (R input): | |||||||||||||||||||||||||||||||||||||||||
| par1 = ; par2 = ; par3 = ; par4 = No season ; | |||||||||||||||||||||||||||||||||||||||||
| R code (references can be found in the software module): | |||||||||||||||||||||||||||||||||||||||||
if (par4 != 'No season') { | |||||||||||||||||||||||||||||||||||||||||