Free Statistics

of Irreproducible Research!

Author's title

Author*The author of this computation has been verified*
R Software Modulerwasp_smp.wasp
Title produced by softwareStandard Deviation-Mean Plot
Date of computationSun, 18 Dec 2011 03:47:44 -0500
Cite this page as followsStatistical Computations at FreeStatistics.org, Office for Research Development and Education, URL https://freestatistics.org/blog/index.php?v=date/2011/Dec/18/t1324198202bccxeyl2h9cam5l.htm/, Retrieved Sun, 05 May 2024 13:59:59 +0000
Statistical Computations at FreeStatistics.org, Office for Research Development and Education, URL https://freestatistics.org/blog/index.php?pk=156615, Retrieved Sun, 05 May 2024 13:59:59 +0000
QR Codes:

Original text written by user:
IsPrivate?No (this computation is public)
User-defined keywords
Estimated Impact118
Family? (F = Feedback message, R = changed R code, M = changed R Module, P = changed Parameters, D = changed Data)
-       [Standard Deviation-Mean Plot] [Stationariteit in...] [2011-12-18 08:47:44] [51aabe75794be7f34bed5d3096a085df] [Current]
Feedback Forum

Post a new message
Dataseries X:
277
232
256
242
282
288
321
316
362
392
414
417
488
489
467
460
510
493
476
448
466
417
387
370
396
349
326
303
329
304
286
281
344
369
390
406
467
437
410
390


Summary of computational transaction
Raw Inputview raw input (R code)
Raw Outputview raw output of R engine
Computing time1 seconds
R Server'Herman Ole Andreas Wold' @ wold.wessa.net

\begin{tabular}{lllllllll}
\hline
Summary of computational transaction \tabularnewline
Raw Input & view raw input (R code)  \tabularnewline
Raw Output & view raw output of R engine  \tabularnewline
Computing time & 1 seconds \tabularnewline
R Server & 'Herman Ole Andreas Wold' @ wold.wessa.net \tabularnewline
\hline
\end{tabular}
%Source: https://freestatistics.org/blog/index.php?pk=156615&T=0

[TABLE]
[ROW][C]Summary of computational transaction[/C][/ROW]
[ROW][C]Raw Input[/C][C]view raw input (R code) [/C][/ROW]
[ROW][C]Raw Output[/C][C]view raw output of R engine [/C][/ROW]
[ROW][C]Computing time[/C][C]1 seconds[/C][/ROW]
[ROW][C]R Server[/C][C]'Herman Ole Andreas Wold' @ wold.wessa.net[/C][/ROW]
[/TABLE]
Source: https://freestatistics.org/blog/index.php?pk=156615&T=0

Globally Unique Identifier (entire table): ba.freestatistics.org/blog/index.php?pk=156615&T=0

As an alternative you can also use a QR Code:  

The GUIDs for individual cells are displayed in the table below:

Summary of computational transaction
Raw Inputview raw input (R code)
Raw Outputview raw output of R engine
Computing time1 seconds
R Server'Herman Ole Andreas Wold' @ wold.wessa.net


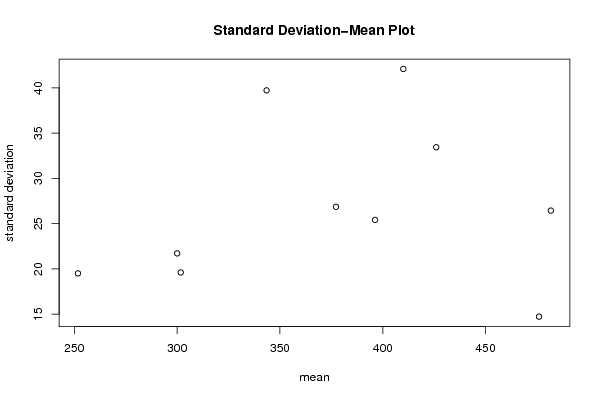
Standard Deviation-Mean Plot
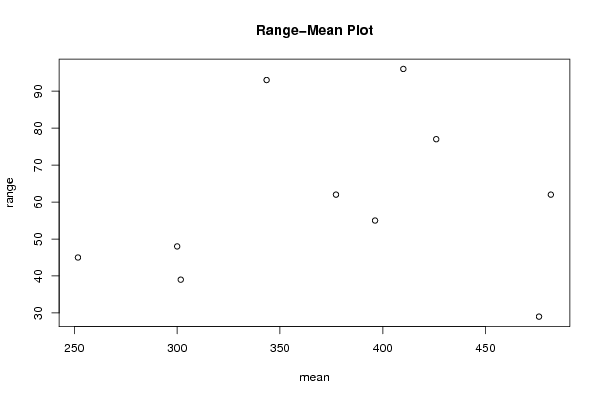
SectionMeanStandard DeviationRange
1251.7519.545
2301.7519.602295783912739
3396.2525.40833196676555
447614.719601443879729
5481.7526.437032107758762
641042.087211042469196
7343.539.719852299154793
830021.710212650578448
9377.2526.84989137159962
1042633.43650699460177

\begin{tabular}{lllllllll}
\hline
Standard Deviation-Mean Plot \tabularnewline
Section & Mean & Standard Deviation & Range \tabularnewline
1 & 251.75 & 19.5 & 45 \tabularnewline
2 & 301.75 & 19.6022957839127 & 39 \tabularnewline
3 & 396.25 & 25.408331966765 & 55 \tabularnewline
4 & 476 & 14.7196014438797 & 29 \tabularnewline
5 & 481.75 & 26.4370321077587 & 62 \tabularnewline
6 & 410 & 42.0872110424691 & 96 \tabularnewline
7 & 343.5 & 39.7198522991547 & 93 \tabularnewline
8 & 300 & 21.7102126505784 & 48 \tabularnewline
9 & 377.25 & 26.849891371599 & 62 \tabularnewline
10 & 426 & 33.436506994601 & 77 \tabularnewline
\hline
\end{tabular}
%Source: https://freestatistics.org/blog/index.php?pk=156615&T=1

[TABLE]
[ROW][C]Standard Deviation-Mean Plot[/C][/ROW]
[ROW][C]Section[/C][C]Mean[/C][C]Standard Deviation[/C][C]Range[/C][/ROW]
[ROW][C]1[/C][C]251.75[/C][C]19.5[/C][C]45[/C][/ROW]
[ROW][C]2[/C][C]301.75[/C][C]19.6022957839127[/C][C]39[/C][/ROW]
[ROW][C]3[/C][C]396.25[/C][C]25.408331966765[/C][C]55[/C][/ROW]
[ROW][C]4[/C][C]476[/C][C]14.7196014438797[/C][C]29[/C][/ROW]
[ROW][C]5[/C][C]481.75[/C][C]26.4370321077587[/C][C]62[/C][/ROW]
[ROW][C]6[/C][C]410[/C][C]42.0872110424691[/C][C]96[/C][/ROW]
[ROW][C]7[/C][C]343.5[/C][C]39.7198522991547[/C][C]93[/C][/ROW]
[ROW][C]8[/C][C]300[/C][C]21.7102126505784[/C][C]48[/C][/ROW]
[ROW][C]9[/C][C]377.25[/C][C]26.849891371599[/C][C]62[/C][/ROW]
[ROW][C]10[/C][C]426[/C][C]33.436506994601[/C][C]77[/C][/ROW]
[/TABLE]
Source: https://freestatistics.org/blog/index.php?pk=156615&T=1

Globally Unique Identifier (entire table): ba.freestatistics.org/blog/index.php?pk=156615&T=1

As an alternative you can also use a QR Code:  

The GUIDs for individual cells are displayed in the table below:

Standard Deviation-Mean Plot
SectionMeanStandard DeviationRange
1251.7519.545
2301.7519.602295783912739
3396.2525.40833196676555
447614.719601443879729
5481.7526.437032107758762
641042.087211042469196
7343.539.719852299154793
830021.710212650578448
9377.2526.84989137159962
1042633.43650699460177


Regression: S.E.(k) = alpha + beta * Mean(k)
alpha19.9569030917281
beta0.018569942151408
S.D.0.0407691802669459
T-STAT0.455489711341187
p-value0.660865199085356

\begin{tabular}{lllllllll}
\hline
Regression: S.E.(k) = alpha + beta * Mean(k) \tabularnewline
alpha & 19.9569030917281 \tabularnewline
beta & 0.018569942151408 \tabularnewline
S.D. & 0.0407691802669459 \tabularnewline
T-STAT & 0.455489711341187 \tabularnewline
p-value & 0.660865199085356 \tabularnewline
\hline
\end{tabular}
%Source: https://freestatistics.org/blog/index.php?pk=156615&T=2

[TABLE]
[ROW][C]Regression: S.E.(k) = alpha + beta * Mean(k)[/C][/ROW]
[ROW][C]alpha[/C][C]19.9569030917281[/C][/ROW]
[ROW][C]beta[/C][C]0.018569942151408[/C][/ROW]
[ROW][C]S.D.[/C][C]0.0407691802669459[/C][/ROW]
[ROW][C]T-STAT[/C][C]0.455489711341187[/C][/ROW]
[ROW][C]p-value[/C][C]0.660865199085356[/C][/ROW]
[/TABLE]
Source: https://freestatistics.org/blog/index.php?pk=156615&T=2

Globally Unique Identifier (entire table): ba.freestatistics.org/blog/index.php?pk=156615&T=2

As an alternative you can also use a QR Code:  

The GUIDs for individual cells are displayed in the table below:

Regression: S.E.(k) = alpha + beta * Mean(k)
alpha19.9569030917281
beta0.018569942151408
S.D.0.0407691802669459
T-STAT0.455489711341187
p-value0.660865199085356


Regression: ln S.E.(k) = alpha + beta * ln Mean(k)
alpha1.51461793949285
beta0.292647078023153
S.D.0.542005203728509
T-STAT0.539934074451691
p-value0.603942893542534
Lambda0.707352921976847

\begin{tabular}{lllllllll}
\hline
Regression: ln S.E.(k) = alpha + beta * ln Mean(k) \tabularnewline
alpha & 1.51461793949285 \tabularnewline
beta & 0.292647078023153 \tabularnewline
S.D. & 0.542005203728509 \tabularnewline
T-STAT & 0.539934074451691 \tabularnewline
p-value & 0.603942893542534 \tabularnewline
Lambda & 0.707352921976847 \tabularnewline
\hline
\end{tabular}
%Source: https://freestatistics.org/blog/index.php?pk=156615&T=3

[TABLE]
[ROW][C]Regression: ln S.E.(k) = alpha + beta * ln Mean(k)[/C][/ROW]
[ROW][C]alpha[/C][C]1.51461793949285[/C][/ROW]
[ROW][C]beta[/C][C]0.292647078023153[/C][/ROW]
[ROW][C]S.D.[/C][C]0.542005203728509[/C][/ROW]
[ROW][C]T-STAT[/C][C]0.539934074451691[/C][/ROW]
[ROW][C]p-value[/C][C]0.603942893542534[/C][/ROW]
[ROW][C]Lambda[/C][C]0.707352921976847[/C][/ROW]
[/TABLE]
Source: https://freestatistics.org/blog/index.php?pk=156615&T=3

Globally Unique Identifier (entire table): ba.freestatistics.org/blog/index.php?pk=156615&T=3

As an alternative you can also use a QR Code:  

The GUIDs for individual cells are displayed in the table below:

Regression: ln S.E.(k) = alpha + beta * ln Mean(k)
alpha1.51461793949285
beta0.292647078023153
S.D.0.542005203728509
T-STAT0.539934074451691
p-value0.603942893542534
Lambda0.707352921976847


Parameters (Session):
par1 = 4 ;
Parameters (R input):
par1 = 4 ;
R code (references can be found in the software module):
par1 <- as.numeric(par1)
(n <- length(x))
(np <- floor(n / par1))
arr <- array(NA,dim=c(par1,np))
j <- 0
k <- 1
for (i in 1:(np*par1))
{
j = j + 1
arr[j,k] <- x[i]
if (j == par1) {
j = 0
k=k+1
}
}
arr
arr.mean <- array(NA,dim=np)
arr.sd <- array(NA,dim=np)
arr.range <- array(NA,dim=np)
for (j in 1:np)
{
arr.mean[j] <- mean(arr[,j],na.rm=TRUE)
arr.sd[j] <- sd(arr[,j],na.rm=TRUE)
arr.range[j] <- max(arr[,j],na.rm=TRUE) - min(arr[,j],na.rm=TRUE)
}
arr.mean
arr.sd
arr.range
(lm1 <- lm(arr.sd~arr.mean))
(lnlm1 <- lm(log(arr.sd)~log(arr.mean)))
(lm2 <- lm(arr.range~arr.mean))
bitmap(file='test1.png')
plot(arr.mean,arr.sd,main='Standard Deviation-Mean Plot',xlab='mean',ylab='standard deviation')
dev.off()
bitmap(file='test2.png')
plot(arr.mean,arr.range,main='Range-Mean Plot',xlab='mean',ylab='range')
dev.off()
load(file='createtable')
a<-table.start()
a<-table.row.start(a)
a<-table.element(a,'Standard Deviation-Mean Plot',4,TRUE)
a<-table.row.end(a)
a<-table.row.start(a)
a<-table.element(a,'Section',header=TRUE)
a<-table.element(a,'Mean',header=TRUE)
a<-table.element(a,'Standard Deviation',header=TRUE)
a<-table.element(a,'Range',header=TRUE)
a<-table.row.end(a)
for (j in 1:np) {
a<-table.row.start(a)
a<-table.element(a,j,header=TRUE)
a<-table.element(a,arr.mean[j])
a<-table.element(a,arr.sd[j] )
a<-table.element(a,arr.range[j] )
a<-table.row.end(a)
}
a<-table.end(a)
table.save(a,file='mytable.tab')
a<-table.start()
a<-table.row.start(a)
a<-table.element(a,'Regression: S.E.(k) = alpha + beta * Mean(k)',2,TRUE)
a<-table.row.end(a)
a<-table.row.start(a)
a<-table.element(a,'alpha',header=TRUE)
a<-table.element(a,lm1$coefficients[[1]])
a<-table.row.end(a)
a<-table.row.start(a)
a<-table.element(a,'beta',header=TRUE)
a<-table.element(a,lm1$coefficients[[2]])
a<-table.row.end(a)
a<-table.row.start(a)
a<-table.element(a,'S.D.',header=TRUE)
a<-table.element(a,summary(lm1)$coefficients[2,2])
a<-table.row.end(a)
a<-table.row.start(a)
a<-table.element(a,'T-STAT',header=TRUE)
a<-table.element(a,summary(lm1)$coefficients[2,3])
a<-table.row.end(a)
a<-table.row.start(a)
a<-table.element(a,'p-value',header=TRUE)
a<-table.element(a,summary(lm1)$coefficients[2,4])
a<-table.row.end(a)
a<-table.end(a)
table.save(a,file='mytable1.tab')
a<-table.start()
a<-table.row.start(a)
a<-table.element(a,'Regression: ln S.E.(k) = alpha + beta * ln Mean(k)',2,TRUE)
a<-table.row.end(a)
a<-table.row.start(a)
a<-table.element(a,'alpha',header=TRUE)
a<-table.element(a,lnlm1$coefficients[[1]])
a<-table.row.end(a)
a<-table.row.start(a)
a<-table.element(a,'beta',header=TRUE)
a<-table.element(a,lnlm1$coefficients[[2]])
a<-table.row.end(a)
a<-table.row.start(a)
a<-table.element(a,'S.D.',header=TRUE)
a<-table.element(a,summary(lnlm1)$coefficients[2,2])
a<-table.row.end(a)
a<-table.row.start(a)
a<-table.element(a,'T-STAT',header=TRUE)
a<-table.element(a,summary(lnlm1)$coefficients[2,3])
a<-table.row.end(a)
a<-table.row.start(a)
a<-table.element(a,'p-value',header=TRUE)
a<-table.element(a,summary(lnlm1)$coefficients[2,4])
a<-table.row.end(a)
a<-table.row.start(a)
a<-table.element(a,'Lambda',header=TRUE)
a<-table.element(a,1-lnlm1$coefficients[[2]])
a<-table.row.end(a)
a<-table.end(a)
table.save(a,file='mytable2.tab')