Free Statistics

of Irreproducible Research!

Author's title

Author*The author of this computation has been verified*
R Software Modulerwasp_regression_trees1.wasp
Title produced by softwareRecursive Partitioning (Regression Trees)
Date of computationSat, 17 Dec 2011 21:27:31 -0500
Cite this page as followsStatistical Computations at FreeStatistics.org, Office for Research Development and Education, URL https://freestatistics.org/blog/index.php?v=date/2011/Dec/17/t1324175683eny2dyiv096jzgn.htm/, Retrieved Tue, 16 Apr 2024 13:11:22 +0000
Statistical Computations at FreeStatistics.org, Office for Research Development and Education, URL https://freestatistics.org/blog/index.php?pk=156598, Retrieved Tue, 16 Apr 2024 13:11:22 +0000
QR Codes:

Original text written by user:
IsPrivate?No (this computation is public)
User-defined keywords
Estimated Impact139
Family? (F = Feedback message, R = changed R code, M = changed R Module, P = changed Parameters, D = changed Data)
-     [Recursive Partitioning (Regression Trees)] [] [2010-12-05 19:35:21] [b98453cac15ba1066b407e146608df68]
- R PD    [Recursive Partitioning (Regression Trees)] [] [2011-12-18 02:27:31] [2be7aedefc35278abdba659ba29c8de8] [Current]
Feedback Forum

Post a new message
Dataseries X:
79	30	94	112285	146283
58	28	103	84786	98364
60	38	93	83123	86146
108	30	103	101193	96933
49	22	51	38361	79234
0	26	70	68504	42551
121	25	91	119182	195663
1	18	22	22807	6853
43	26	93	116174	95757
69	25	60	57635	85584
78	38	123	66198	143983
86	44	148	71701	75851
44	30	90	57793	59238
104	40	124	80444	93163
63	34	70	53855	96037
158	47	168	97668	151511
102	30	115	133824	136368
77	31	71	101481	112642
82	23	66	99645	94728
115	36	134	114789	105499
101	36	117	99052	121527
80	30	108	67654	127766
50	25	84	65553	98958
83	39	156	97500	77900
123	34	120	69112	85646
73	31	114	82753	98579
81	31	94	85323	130767
105	33	120	72654	131741
47	25	81	30727	53907
105	33	110	77873	178812
94	35	133	117478	146761
44	42	122	74007	82036
114	43	158	90183	163253
38	30	109	61542	27032
107	33	124	101494	171975
71	32	92	55813	86572
84	36	126	79215	159676
59	28	70	55461	85371
33	14	37	31081	58391
96	32	120	83122	136815
106	30	93	70106	120642
56	35	95	60578	69107
59	28	90	79892	108016
39	28	80	49810	46341
34	39	31	71570	78348
76	34	110	100708	79336
20	26	66	33032	56968
91	39	138	82875	93176
115	39	133	139077	161632
85	33	113	71595	87850
76	28	100	72260	127969
8	4	7	5950	15049
79	39	140	115762	155135
21	18	61	32551	25109
30	14	41	31701	45824
76	29	96	80670	102996
101	44	164	143558	160604
92	28	102	120733	162647
123	35	124	105195	174141
75	28	99	73107	60622
128	38	129	132068	179566
105	23	62	149193	184301
55	36	73	46821	75661
56	32	114	87011	96144
41	29	99	95260	129847
72	25	70	55183	117286
67	27	104	106671	71180
75	36	116	73511	109377
114	28	91	92945	85298
118	23	74	78664	73631
77	40	138	70054	86767
22	23	67	22618	23824
66	40	151	74011	93487
69	28	72	83737	82981
105	34	120	69094	73815
116	33	115	93133	94552
88	28	105	95536	132190
73	34	104	225920	128754
99	30	108	62133	66363
62	33	98	61370	67808
53	22	69	43836	61724
118	38	111	106117	131722
30	26	99	38692	68580
100	35	71	84651	106175
49	8	27	56622	55792
24	24	69	15986	25157
67	29	107	95364	76669
57	29	107	89691	105805
75	45	93	67267	129484
135	37	129	126846	72413
68	33	69	41140	87831
124	33	118	102860	96971
33	25	73	51715	71299
98	32	119	55801	77494
58	29	104	111813	120336
68	28	107	120293	93913
81	28	99	138599	136048
131	31	90	161647	181248
110	52	197	115929	146123
130	24	85	162901	186646
93	41	139	109825	102255
118	33	106	129838	168237
39	32	50	37510	64219
13	19	64	43750	19630
74	20	31	40652	76825
81	31	63	87771	115338
109	31	92	85872	109427
151	32	106	89275	118168
28	23	69	192565	153197
83	30	93	140867	68370
54	31	114	120662	146304
133	42	110	101338	103950
12	1	0	1168	5841
106	32	83	65567	84396
23	11	30	25162	24610
71	36	98	40735	55515
116	31	82	91413	209056
4	0	0	855	6622
62	24	60	97068	115814
18	8	9	14116	13155
98	33	115	76643	142775
64	40	140	110681	68847
32	38	120	92696	20112
25	24	66	94785	61023
16	8	21	8773	13983
48	35	124	83209	65176
100	43	152	93815	132432
46	43	139	86687	112494
129	41	144	105547	170875
130	38	120	103487	180759
136	45	160	213688	214921
59	31	114	71220	100226
32	28	78	56926	54454
63	31	119	91721	78876
95	40	141	115168	170745
14	30	101	111194	6940
113	37	133	135777	122037
47	30	83	51513	53782
92	35	116	74163	127748
70	32	90	51633	86839
19	27	36	75345	44830
91	31	97	98952	103300
111	31	98	102372	112283
41	21	78	37238	10901
120	39	117	103772	120691
135	41	148	123969	58106
87	32	105	135400	122422
131	39	132	130115	139296
4	0	0	6023	7953
47	30	73	64466	89455
109	37	86	54990	147866
7	0	0	1644	4245
12	5	13	6179	21509
0	1	4	3926	7670
37	32	48	34777	14336
46	24	46	73224	53608


Summary of computational transaction
Raw Inputview raw input (R code)
Raw Outputview raw output of R engine
Computing time3 seconds
R Server'AstonUniversity' @ aston.wessa.net

\begin{tabular}{lllllllll}
\hline
Summary of computational transaction \tabularnewline
Raw Input & view raw input (R code)  \tabularnewline
Raw Output & view raw output of R engine  \tabularnewline
Computing time & 3 seconds \tabularnewline
R Server & 'AstonUniversity' @ aston.wessa.net \tabularnewline
\hline
\end{tabular}
%Source: https://freestatistics.org/blog/index.php?pk=156598&T=0

[TABLE]
[ROW][C]Summary of computational transaction[/C][/ROW]
[ROW][C]Raw Input[/C][C]view raw input (R code) [/C][/ROW]
[ROW][C]Raw Output[/C][C]view raw output of R engine [/C][/ROW]
[ROW][C]Computing time[/C][C]3 seconds[/C][/ROW]
[ROW][C]R Server[/C][C]'AstonUniversity' @ aston.wessa.net[/C][/ROW]
[/TABLE]
Source: https://freestatistics.org/blog/index.php?pk=156598&T=0

Globally Unique Identifier (entire table): ba.freestatistics.org/blog/index.php?pk=156598&T=0

As an alternative you can also use a QR Code:  

The GUIDs for individual cells are displayed in the table below:

Summary of computational transaction
Raw Inputview raw input (R code)
Raw Outputview raw output of R engine
Computing time3 seconds
R Server'AstonUniversity' @ aston.wessa.net


Confusion Matrix (predicted in columns / actuals in rows)
C1C2
C1765
C22055

\begin{tabular}{lllllllll}
\hline
Confusion Matrix (predicted in columns / actuals in rows) \tabularnewline
 & C1 & C2 \tabularnewline
C1 & 76 & 5 \tabularnewline
C2 & 20 & 55 \tabularnewline
\hline
\end{tabular}
%Source: https://freestatistics.org/blog/index.php?pk=156598&T=1

[TABLE]
[ROW][C]Confusion Matrix (predicted in columns / actuals in rows)[/C][/ROW]
[ROW][C][/C][C]C1[/C][C]C2[/C][/ROW]
[ROW][C]C1[/C][C]76[/C][C]5[/C][/ROW]
[ROW][C]C2[/C][C]20[/C][C]55[/C][/ROW]
[/TABLE]
Source: https://freestatistics.org/blog/index.php?pk=156598&T=1

Globally Unique Identifier (entire table): ba.freestatistics.org/blog/index.php?pk=156598&T=1

As an alternative you can also use a QR Code:  

The GUIDs for individual cells are displayed in the table below:

Confusion Matrix (predicted in columns / actuals in rows)
C1C2
C1765
C22055


Parameters (Session):
Parameters (R input):
par1 = 3 ; par2 = quantiles ; par3 = 2 ; par4 = no ;
R code (references can be found in the software module):
library(party)
library(Hmisc)
par1 <- as.numeric(par1)
par3 <- as.numeric(par3)
x <- data.frame(t(y))
is.data.frame(x)
x <- x[!is.na(x[,par1]),]
k <- length(x[1,])
n <- length(x[,1])
colnames(x)[par1]
x[,par1]
if (par2 == 'kmeans') {
cl <- kmeans(x[,par1], par3)
print(cl)
clm <- matrix(cbind(cl$centers,1:par3),ncol=2)
clm <- clm[sort.list(clm[,1]),]
for (i in 1:par3) {
cl$cluster[cl$cluster==clm[i,2]] <- paste('C',i,sep='')
}
cl$cluster <- as.factor(cl$cluster)
print(cl$cluster)
x[,par1] <- cl$cluster
}
if (par2 == 'quantiles') {
x[,par1] <- cut2(x[,par1],g=par3)
}
if (par2 == 'hclust') {
hc <- hclust(dist(x[,par1])^2, 'cen')
print(hc)
memb <- cutree(hc, k = par3)
dum <- c(mean(x[memb==1,par1]))
for (i in 2:par3) {
dum <- c(dum, mean(x[memb==i,par1]))
}
hcm <- matrix(cbind(dum,1:par3),ncol=2)
hcm <- hcm[sort.list(hcm[,1]),]
for (i in 1:par3) {
memb[memb==hcm[i,2]] <- paste('C',i,sep='')
}
memb <- as.factor(memb)
print(memb)
x[,par1] <- memb
}
if (par2=='equal') {
ed <- cut(as.numeric(x[,par1]),par3,labels=paste('C',1:par3,sep=''))
x[,par1] <- as.factor(ed)
}
table(x[,par1])
colnames(x)
colnames(x)[par1]
x[,par1]
if (par2 == 'none') {
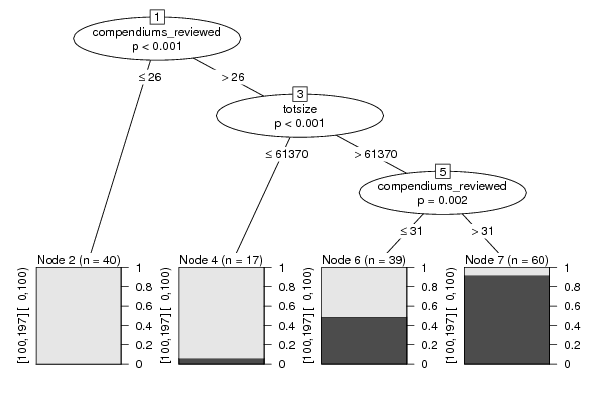
m <- ctree(as.formula(paste(colnames(x)[par1],' ~ .',sep='')),data = x)
}
load(file='createtable')
if (par2 != 'none') {
m <- ctree(as.formula(paste('as.factor(',colnames(x)[par1],') ~ .',sep='')),data = x)
if (par4=='yes') {
a<-table.start()
a<-table.row.start(a)
a<-table.element(a,'10-Fold Cross Validation',3+2*par3,TRUE)
a<-table.row.end(a)
a<-table.row.start(a)
a<-table.element(a,'',1,TRUE)
a<-table.element(a,'Prediction (training)',par3+1,TRUE)
a<-table.element(a,'Prediction (testing)',par3+1,TRUE)
a<-table.row.end(a)
a<-table.row.start(a)
a<-table.element(a,'Actual',1,TRUE)
for (jjj in 1:par3) a<-table.element(a,paste('C',jjj,sep=''),1,TRUE)
a<-table.element(a,'CV',1,TRUE)
for (jjj in 1:par3) a<-table.element(a,paste('C',jjj,sep=''),1,TRUE)
a<-table.element(a,'CV',1,TRUE)
a<-table.row.end(a)
for (i in 1:10) {
ind <- sample(2, nrow(x), replace=T, prob=c(0.9,0.1))
m.ct <- ctree(as.formula(paste('as.factor(',colnames(x)[par1],') ~ .',sep='')),data =x[ind==1,])
if (i==1) {
m.ct.i.pred <- predict(m.ct, newdata=x[ind==1,])
m.ct.i.actu <- x[ind==1,par1]
m.ct.x.pred <- predict(m.ct, newdata=x[ind==2,])
m.ct.x.actu <- x[ind==2,par1]
} else {
m.ct.i.pred <- c(m.ct.i.pred,predict(m.ct, newdata=x[ind==1,]))
m.ct.i.actu <- c(m.ct.i.actu,x[ind==1,par1])
m.ct.x.pred <- c(m.ct.x.pred,predict(m.ct, newdata=x[ind==2,]))
m.ct.x.actu <- c(m.ct.x.actu,x[ind==2,par1])
}
}
print(m.ct.i.tab <- table(m.ct.i.actu,m.ct.i.pred))
numer <- 0
for (i in 1:par3) {
print(m.ct.i.tab[i,i] / sum(m.ct.i.tab[i,]))
numer <- numer + m.ct.i.tab[i,i]
}
print(m.ct.i.cp <- numer / sum(m.ct.i.tab))
print(m.ct.x.tab <- table(m.ct.x.actu,m.ct.x.pred))
numer <- 0
for (i in 1:par3) {
print(m.ct.x.tab[i,i] / sum(m.ct.x.tab[i,]))
numer <- numer + m.ct.x.tab[i,i]
}
print(m.ct.x.cp <- numer / sum(m.ct.x.tab))
for (i in 1:par3) {
a<-table.row.start(a)
a<-table.element(a,paste('C',i,sep=''),1,TRUE)
for (jjj in 1:par3) a<-table.element(a,m.ct.i.tab[i,jjj])
a<-table.element(a,round(m.ct.i.tab[i,i]/sum(m.ct.i.tab[i,]),4))
for (jjj in 1:par3) a<-table.element(a,m.ct.x.tab[i,jjj])
a<-table.element(a,round(m.ct.x.tab[i,i]/sum(m.ct.x.tab[i,]),4))
a<-table.row.end(a)
}
a<-table.row.start(a)
a<-table.element(a,'Overall',1,TRUE)
for (jjj in 1:par3) a<-table.element(a,'-')
a<-table.element(a,round(m.ct.i.cp,4))
for (jjj in 1:par3) a<-table.element(a,'-')
a<-table.element(a,round(m.ct.x.cp,4))
a<-table.row.end(a)
a<-table.end(a)
table.save(a,file='mytable3.tab')
}
}
m
bitmap(file='test1.png')
plot(m)
dev.off()
bitmap(file='test1a.png')
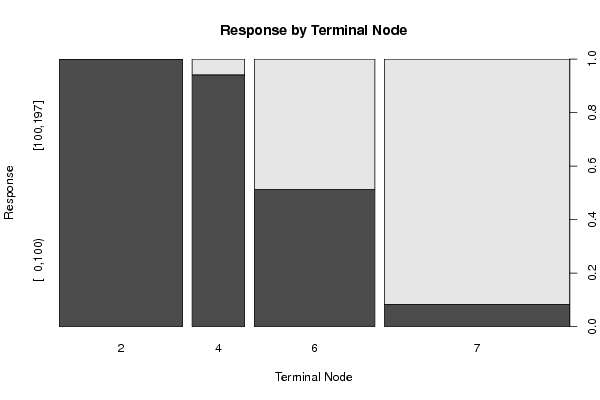
plot(x[,par1] ~ as.factor(where(m)),main='Response by Terminal Node',xlab='Terminal Node',ylab='Response')
dev.off()
if (par2 == 'none') {
forec <- predict(m)
result <- as.data.frame(cbind(x[,par1],forec,x[,par1]-forec))
colnames(result) <- c('Actuals','Forecasts','Residuals')
print(result)
}
if (par2 != 'none') {
print(cbind(as.factor(x[,par1]),predict(m)))
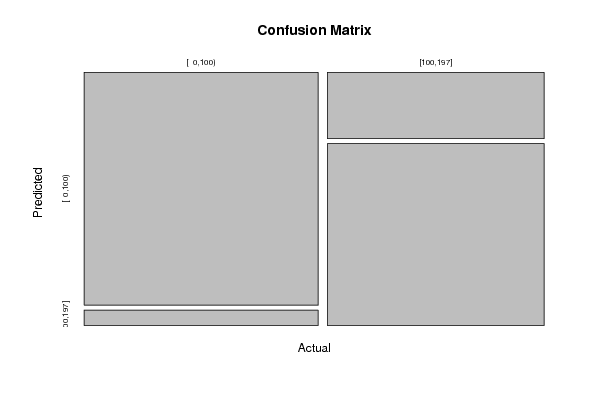
myt <- table(as.factor(x[,par1]),predict(m))
print(myt)
}
bitmap(file='test2.png')
if(par2=='none') {
op <- par(mfrow=c(2,2))
plot(density(result$Actuals),main='Kernel Density Plot of Actuals')
plot(density(result$Residuals),main='Kernel Density Plot of Residuals')
plot(result$Forecasts,result$Actuals,main='Actuals versus Predictions',xlab='Predictions',ylab='Actuals')
plot(density(result$Forecasts),main='Kernel Density Plot of Predictions')
par(op)
}
if(par2!='none') {
plot(myt,main='Confusion Matrix',xlab='Actual',ylab='Predicted')
}
dev.off()
if (par2 == 'none') {
detcoef <- cor(result$Forecasts,result$Actuals)
a<-table.start()
a<-table.row.start(a)
a<-table.element(a,'Goodness of Fit',2,TRUE)
a<-table.row.end(a)
a<-table.row.start(a)
a<-table.element(a,'Correlation',1,TRUE)
a<-table.element(a,round(detcoef,4))
a<-table.row.end(a)
a<-table.row.start(a)
a<-table.element(a,'R-squared',1,TRUE)
a<-table.element(a,round(detcoef*detcoef,4))
a<-table.row.end(a)
a<-table.row.start(a)
a<-table.element(a,'RMSE',1,TRUE)
a<-table.element(a,round(sqrt(mean((result$Residuals)^2)),4))
a<-table.row.end(a)
a<-table.end(a)
table.save(a,file='mytable1.tab')
a<-table.start()
a<-table.row.start(a)
a<-table.element(a,'Actuals, Predictions, and Residuals',4,TRUE)
a<-table.row.end(a)
a<-table.row.start(a)
a<-table.element(a,'#',header=TRUE)
a<-table.element(a,'Actuals',header=TRUE)
a<-table.element(a,'Forecasts',header=TRUE)
a<-table.element(a,'Residuals',header=TRUE)
a<-table.row.end(a)
for (i in 1:length(result$Actuals)) {
a<-table.row.start(a)
a<-table.element(a,i,header=TRUE)
a<-table.element(a,result$Actuals[i])
a<-table.element(a,result$Forecasts[i])
a<-table.element(a,result$Residuals[i])
a<-table.row.end(a)
}
a<-table.end(a)
table.save(a,file='mytable.tab')
}
if (par2 != 'none') {
a<-table.start()
a<-table.row.start(a)
a<-table.element(a,'Confusion Matrix (predicted in columns / actuals in rows)',par3+1,TRUE)
a<-table.row.end(a)
a<-table.row.start(a)
a<-table.element(a,'',1,TRUE)
for (i in 1:par3) {
a<-table.element(a,paste('C',i,sep=''),1,TRUE)
}
a<-table.row.end(a)
for (i in 1:par3) {
a<-table.row.start(a)
a<-table.element(a,paste('C',i,sep=''),1,TRUE)
for (j in 1:par3) {
a<-table.element(a,myt[i,j])
}
a<-table.row.end(a)
}
a<-table.end(a)
table.save(a,file='mytable2.tab')
}