| Multiple Linear Regression - Estimated Regression Equation |
| test[t] = + 3.0081632803644 -0.0458583460107966I1[t] -0.0056787017022851I2[t] + 0.0487015324041718I3[t] -0.0421523402417902E1[t] + 0.0633028504811332E2[t] -0.114410684681444E3[t] + 0.00882487607121334A[t] + e[t] |
| Multiple Linear Regression - Ordinary Least Squares | |||||
| Variable | Parameter | S.D. | T-STAT H0: parameter = 0 | 2-tail p-value | 1-tail p-value |
| (Intercept) | 3.0081632803644 | 3.393137 | 0.8865 | 0.379116 | 0.189558 |
| I1 | -0.0458583460107966 | 0.130539 | -0.3513 | 0.726681 | 0.36334 |
| I2 | -0.0056787017022851 | 0.150675 | -0.0377 | 0.97007 | 0.485035 |
| I3 | 0.0487015324041718 | 0.091381 | 0.5329 | 0.596177 | 0.298089 |
| E1 | -0.0421523402417902 | 0.115508 | -0.3649 | 0.716538 | 0.358269 |
| E2 | 0.0633028504811332 | 0.122055 | 0.5186 | 0.606053 | 0.303027 |
| E3 | -0.114410684681444 | 0.125135 | -0.9143 | 0.364479 | 0.18224 |
| A | 0.00882487607121334 | 0.114358 | 0.0772 | 0.938764 | 0.469382 |
| Multiple Linear Regression - Regression Statistics | |
| Multiple R | 0.173164937220105 |
| R-squared | 0.0299860954824428 |
| Adjusted R-squared | -0.0912656425822518 |
| F-TEST (value) | 0.247304458979743 |
| F-TEST (DF numerator) | 7 |
| F-TEST (DF denominator) | 56 |
| p-value | 0.971014839632296 |
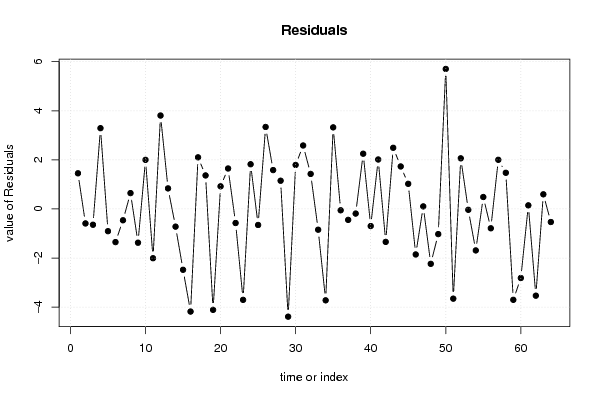
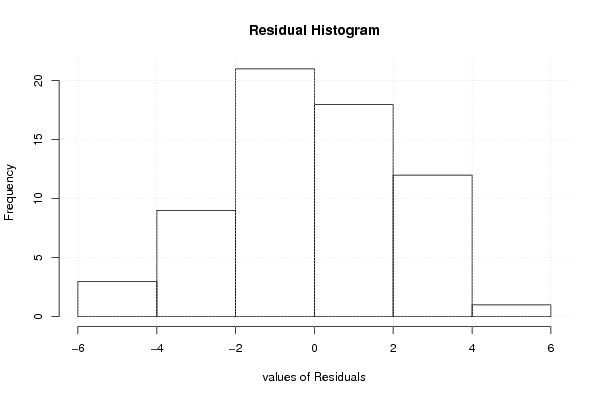
| Multiple Linear Regression - Residual Statistics | |
| Residual Standard Deviation | 2.34674468971515 |
| Sum Squared Residuals | 308.403795767551 |
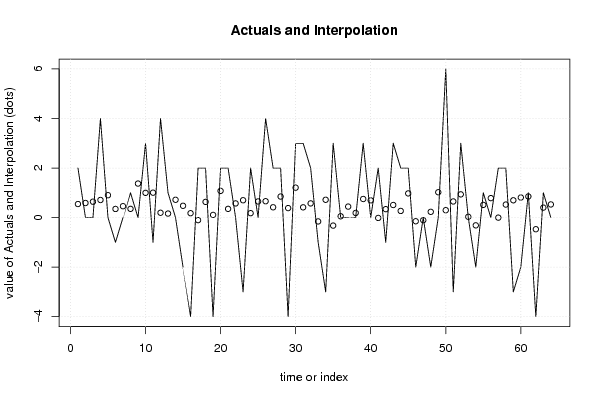
| Multiple Linear Regression - Actuals, Interpolation, and Residuals | |||
| Time or Index | Actuals | Interpolation Forecast | Residuals Prediction Error |
| 1 | 2 | 0.547180479533903 | 1.4528195204661 |
| 2 | 0 | 0.58821959290833 | -0.58821959290833 |
| 3 | 0 | 0.64126609956884 | -0.64126609956884 |
| 4 | 4 | 0.709581355094904 | 3.2904186449051 |
| 5 | 0 | 0.903359278894133 | -0.903359278894133 |
| 6 | -1 | 0.347758439342339 | -1.34775843934234 |
| 7 | 0 | 0.459542544083906 | -0.459542544083906 |
| 8 | 1 | 0.35278347162094 | 0.64721652837906 |
| 9 | 0 | 1.37294906410442 | -1.37294906410442 |
| 10 | 3 | 0.99852139672912 | 2.00147860327088 |
| 11 | -1 | 1.00485159964457 | -2.00485159964457 |
| 12 | 4 | 0.194211249377358 | 3.80578875062264 |
| 13 | 1 | 0.161507777038578 | 0.838492222961422 |
| 14 | 0 | 0.718565732337525 | -0.718565732337525 |
| 15 | -2 | 0.475192694332691 | -2.47519269433269 |
| 16 | -4 | 0.176006435527312 | -4.17600643552731 |
| 17 | 2 | -0.103170305093869 | 2.10317030509387 |
| 18 | 2 | 0.633526832472862 | 1.36647316752714 |
| 19 | -4 | 0.106460659593727 | -4.10646065959373 |
| 20 | 2 | 1.07731639528895 | 0.922683604711054 |
| 21 | 2 | 0.350690834125685 | 1.64930916587432 |
| 22 | 0 | 0.57088632338773 | -0.57088632338773 |
| 23 | -3 | 0.699665750304022 | -3.69966575030402 |
| 24 | 2 | 0.177625171932562 | 1.82237482806744 |
| 25 | 0 | 0.650704616817502 | -0.650704616817502 |
| 26 | 4 | 0.659744090327303 | 3.3402559096727 |
| 27 | 2 | 0.415594517203608 | 1.58440548279639 |
| 28 | 2 | 0.849039515157205 | 1.15096048484279 |
| 29 | -4 | 0.383562721220381 | -4.38356272122038 |
| 30 | 3 | 1.20620053195974 | 1.79379946804026 |
| 31 | 3 | 0.413945979959743 | 2.58605402004026 |
| 32 | 2 | 0.571920119158806 | 1.42807988084119 |
| 33 | -1 | -0.156349525622386 | -0.843650474377614 |
| 34 | -3 | 0.718514811581437 | -3.71851481158144 |
| 35 | 3 | -0.323650803315216 | 3.32365080331522 |
| 36 | 0 | 0.0519869994459563 | -0.0519869994459563 |
| 37 | 0 | 0.44310025262671 | -0.44310025262671 |
| 38 | 0 | 0.186253706567822 | -0.186253706567822 |
| 39 | 3 | 0.749920578662763 | 2.25007942133724 |
| 40 | 0 | 0.694591006660085 | -0.694591006660085 |
| 41 | 2 | -0.0151837575393658 | 2.01518375753937 |
| 42 | -1 | 0.339599431860698 | -1.3395994318607 |
| 43 | 3 | 0.507072537857247 | 2.49292746214275 |
| 44 | 2 | 0.267524471985489 | 1.73247552801451 |
| 45 | 2 | 0.975019396555087 | 1.02498060344491 |
| 46 | -2 | -0.148201331573775 | -1.85179866842622 |
| 47 | 0 | -0.105567191406293 | 0.105567191406293 |
| 48 | -2 | 0.232293161552624 | -2.23229316155262 |
| 49 | 0 | 1.02266067607571 | -1.02266067607571 |
| 50 | 6 | 0.297643181575939 | 5.70235681842406 |
| 51 | -3 | 0.650701122773605 | -3.6507011227736 |
| 52 | 3 | 0.936900317640267 | 2.06309968235973 |
| 53 | 0 | 0.032617158620566 | -0.032617158620566 |
| 54 | -2 | -0.313366372047756 | -1.68663362795224 |
| 55 | 1 | 0.511824103576302 | 0.488175896423698 |
| 56 | 0 | 0.785118300346036 | -0.785118300346036 |
| 57 | 2 | -0.00290026677551536 | 2.00290026677552 |
| 58 | 2 | 0.525144534715878 | 1.47485546528412 |
| 59 | -3 | 0.69808833210283 | -3.69808833210283 |
| 60 | -2 | 0.809811087886615 | -2.80981108788662 |
| 61 | 1 | 0.851569244221964 | 0.148430755778036 |
| 62 | -4 | -0.470715511360091 | -3.52928448863991 |
| 63 | 1 | 0.402611967150939 | 0.597388032849061 |
| 64 | 0 | 0.53015741364301 | -0.53015741364301 |
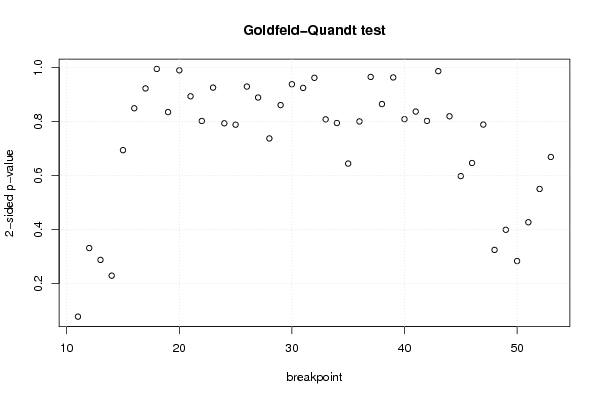
| Goldfeld-Quandt test for Heteroskedasticity | |||
| p-values | Alternative Hypothesis | ||
| breakpoint index | greater | 2-sided | less |
| 11 | 0.0381760023786067 | 0.0763520047572134 | 0.961823997621393 |
| 12 | 0.165393902860595 | 0.330787805721191 | 0.834606097139405 |
| 13 | 0.143461860219763 | 0.286923720439527 | 0.856538139780237 |
| 14 | 0.114190623149738 | 0.228381246299477 | 0.885809376850262 |
| 15 | 0.347029713312785 | 0.694059426625571 | 0.652970286687215 |
| 16 | 0.575277898381522 | 0.849444203236955 | 0.424722101618478 |
| 17 | 0.538496879834809 | 0.923006240330383 | 0.461503120165191 |
| 18 | 0.497620106721006 | 0.995240213442012 | 0.502379893278994 |
| 19 | 0.582343713505748 | 0.835312572988504 | 0.417656286494252 |
| 20 | 0.495127208278543 | 0.990254416557087 | 0.504872791721457 |
| 21 | 0.4469379942125 | 0.893875988425 | 0.5530620057875 |
| 22 | 0.40111341622879 | 0.802226832457579 | 0.59888658377121 |
| 23 | 0.462960565427092 | 0.925921130854184 | 0.537039434572908 |
| 24 | 0.396825721958838 | 0.793651443917677 | 0.603174278041162 |
| 25 | 0.39420902467872 | 0.78841804935744 | 0.60579097532128 |
| 26 | 0.464951632594747 | 0.929903265189494 | 0.535048367405253 |
| 27 | 0.444654538977788 | 0.889309077955577 | 0.555345461022212 |
| 28 | 0.36875906689419 | 0.73751813378838 | 0.63124093310581 |
| 29 | 0.569414824357114 | 0.861170351285773 | 0.430585175642886 |
| 30 | 0.530711505799751 | 0.938576988400498 | 0.469288494200249 |
| 31 | 0.537560405634781 | 0.924879188730438 | 0.462439594365219 |
| 32 | 0.481184140035279 | 0.962368280070557 | 0.518815859964721 |
| 33 | 0.404164931285228 | 0.808329862570455 | 0.595835068714772 |
| 34 | 0.602661711606106 | 0.794676576787788 | 0.397338288393894 |
| 35 | 0.677896674201417 | 0.644206651597166 | 0.322103325798583 |
| 36 | 0.599742926656177 | 0.800514146687647 | 0.400257073343823 |
| 37 | 0.517144068249601 | 0.965711863500799 | 0.482855931750399 |
| 38 | 0.432514063574028 | 0.865028127148057 | 0.567485936425972 |
| 39 | 0.481878714592643 | 0.963757429185286 | 0.518121285407357 |
| 40 | 0.404481567688554 | 0.808963135377109 | 0.595518432311446 |
| 41 | 0.418605500577067 | 0.837211001154133 | 0.581394499422934 |
| 42 | 0.401200930358494 | 0.802401860716988 | 0.598799069641506 |
| 43 | 0.506483423554071 | 0.987033152891858 | 0.493516576445929 |
| 44 | 0.59017871757998 | 0.819642564840041 | 0.40982128242002 |
| 45 | 0.701162201145454 | 0.597675597709092 | 0.298837798854546 |
| 46 | 0.676834384248385 | 0.646331231503231 | 0.323165615751615 |
| 47 | 0.605524284988619 | 0.788951430022762 | 0.394475715011381 |
| 48 | 0.838016255743332 | 0.323967488513336 | 0.161983744256668 |
| 49 | 0.800709001286758 | 0.398581997426485 | 0.199290998713242 |
| 50 | 0.858700253833841 | 0.282599492332318 | 0.141299746166159 |
| 51 | 0.786717392750613 | 0.426565214498775 | 0.213282607249387 |
| 52 | 0.725041199436993 | 0.549917601126015 | 0.274958800563007 |
| 53 | 0.665644833469376 | 0.668710333061247 | 0.334355166530624 |
| Meta Analysis of Goldfeld-Quandt test for Heteroskedasticity | |||
| Description | # significant tests | % significant tests | OK/NOK |
| 1% type I error level | 0 | 0 | OK |
| 5% type I error level | 0 | 0 | OK |
| 10% type I error level | 1 | 0.0232558139534884 | OK |