Free Statistics
of Irreproducible Research!
Description of Statistical Computation | |||||||||||||||||||||||||||||||||||||||||||||||||||||||||||||||||||||||||||||||||||||||||||||||||||
|---|---|---|---|---|---|---|---|---|---|---|---|---|---|---|---|---|---|---|---|---|---|---|---|---|---|---|---|---|---|---|---|---|---|---|---|---|---|---|---|---|---|---|---|---|---|---|---|---|---|---|---|---|---|---|---|---|---|---|---|---|---|---|---|---|---|---|---|---|---|---|---|---|---|---|---|---|---|---|---|---|---|---|---|---|---|---|---|---|---|---|---|---|---|---|---|---|---|---|---|
| Author's title | |||||||||||||||||||||||||||||||||||||||||||||||||||||||||||||||||||||||||||||||||||||||||||||||||||
| Author | *The author of this computation has been verified* | ||||||||||||||||||||||||||||||||||||||||||||||||||||||||||||||||||||||||||||||||||||||||||||||||||
| R Software Module | rwasp_correlation.wasp | ||||||||||||||||||||||||||||||||||||||||||||||||||||||||||||||||||||||||||||||||||||||||||||||||||
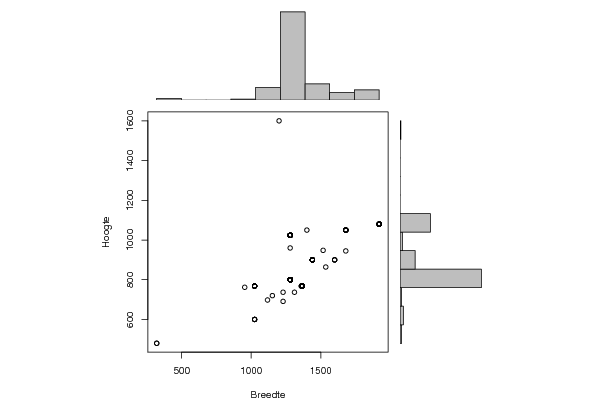
| Title produced by software | Pearson Correlation | ||||||||||||||||||||||||||||||||||||||||||||||||||||||||||||||||||||||||||||||||||||||||||||||||||
| Date of computation | Sat, 17 Dec 2011 16:26:02 -0500 | ||||||||||||||||||||||||||||||||||||||||||||||||||||||||||||||||||||||||||||||||||||||||||||||||||
| Cite this page as follows | Statistical Computations at FreeStatistics.org, Office for Research Development and Education, URL https://freestatistics.org/blog/index.php?v=date/2011/Dec/17/t13241571852xn8kln34l2ow4h.htm/, Retrieved Sat, 12 Jul 2025 13:51:01 +0000 | ||||||||||||||||||||||||||||||||||||||||||||||||||||||||||||||||||||||||||||||||||||||||||||||||||
| Statistical Computations at FreeStatistics.org, Office for Research Development and Education, URL https://freestatistics.org/blog/index.php?pk=156589, Retrieved Sat, 12 Jul 2025 13:51:01 +0000 | |||||||||||||||||||||||||||||||||||||||||||||||||||||||||||||||||||||||||||||||||||||||||||||||||||
| QR Codes: | |||||||||||||||||||||||||||||||||||||||||||||||||||||||||||||||||||||||||||||||||||||||||||||||||||
|
| |||||||||||||||||||||||||||||||||||||||||||||||||||||||||||||||||||||||||||||||||||||||||||||||||||
| Original text written by user: | |||||||||||||||||||||||||||||||||||||||||||||||||||||||||||||||||||||||||||||||||||||||||||||||||||
| IsPrivate? | No (this computation is public) | ||||||||||||||||||||||||||||||||||||||||||||||||||||||||||||||||||||||||||||||||||||||||||||||||||
| User-defined keywords | |||||||||||||||||||||||||||||||||||||||||||||||||||||||||||||||||||||||||||||||||||||||||||||||||||
| Estimated Impact | 271 | ||||||||||||||||||||||||||||||||||||||||||||||||||||||||||||||||||||||||||||||||||||||||||||||||||
Tree of Dependent Computations | |||||||||||||||||||||||||||||||||||||||||||||||||||||||||||||||||||||||||||||||||||||||||||||||||||
| Family? (F = Feedback message, R = changed R code, M = changed R Module, P = changed Parameters, D = changed Data) | |||||||||||||||||||||||||||||||||||||||||||||||||||||||||||||||||||||||||||||||||||||||||||||||||||
| - [Notched Boxplots] [Screen Width and ...] [2010-09-25 10:03:47] [b98453cac15ba1066b407e146608df68] - R D [Notched Boxplots] [Arbitrary Reducti...] [2010-10-04 16:32:21] [b98453cac15ba1066b407e146608df68] - R PD [Notched Boxplots] [Paper deel 1: Not...] [2011-12-17 21:08:47] [a9a952c1cbc7081c25fad93a34aab827] - RM D [Pearson Correlation] [Paper deel 1: Sca...] [2011-12-17 21:26:02] [0a33c029fc36ba20d75a47e4ff91377b] [Current] - R P [Pearson Correlation] [Paper deel 1 Scat...] [2011-12-18 15:13:41] [1321c14511baa35aebbc5dda661708fe] | |||||||||||||||||||||||||||||||||||||||||||||||||||||||||||||||||||||||||||||||||||||||||||||||||||
| Feedback Forum | |||||||||||||||||||||||||||||||||||||||||||||||||||||||||||||||||||||||||||||||||||||||||||||||||||
Post a new message | |||||||||||||||||||||||||||||||||||||||||||||||||||||||||||||||||||||||||||||||||||||||||||||||||||
Dataset | |||||||||||||||||||||||||||||||||||||||||||||||||||||||||||||||||||||||||||||||||||||||||||||||||||
| Dataseries X: | |||||||||||||||||||||||||||||||||||||||||||||||||||||||||||||||||||||||||||||||||||||||||||||||||||
1440 1920 1280 1280 1280 1366 1440 953 1280 1920 1366 1366 1280 1280 1280 1024 1366 1600 1024 1920 1280 1280 1024 1024 1311 1280 1280 1440 1229 1280 1600 1280 1366 1152 1280 1280 1280 1280 1280 1280 1366 1680 1280 1366 1280 1280 1366 1024 1680 1366 1280 1280 1366 1280 1024 1280 1280 1366 1440 1366 1280 1440 1920 1366 1280 1280 1440 1280 1680 1280 1366 1280 1280 1280 1366 1920 1920 1229 1280 1920 1280 1024 1280 1024 1280 1280 1280 1680 1360 1024 1920 1366 1366 1280 1600 1024 1366 1280 1024 1280 1366 1440 1200 1440 1680 1280 1400 1366 1280 1440 1280 1440 1440 1920 1920 1366 1366 1517 1680 1280 1280 1280 1280 1366 320 1920 1280 1440 1366 1280 1366 1366 1280 1536 1280 1280 1680 1280 1440 1280 1360 1920 1680 1366 1280 1280 1440 1280 1280 1680 320 1366 1280 1366 1024 1280 1366 1280 1366 1280 1117 1280 | |||||||||||||||||||||||||||||||||||||||||||||||||||||||||||||||||||||||||||||||||||||||||||||||||||
| Dataseries Y: | |||||||||||||||||||||||||||||||||||||||||||||||||||||||||||||||||||||||||||||||||||||||||||||||||||
900 1080 800 1024 1024 768 900 762 800 1080 768 768 800 800 800 600 768 900 600 1080 800 800 600 768 737 800 800 900 737 800 900 800 768 720 800 800 800 960 800 800 768 1050 800 768 1024 1024 768 768 1050 768 1024 1024 768 800 768 800 1024 768 900 768 800 900 1080 768 800 800 900 800 1050 800 768 800 800 800 768 1080 1080 691 800 1080 800 768 800 768 1024 1024 800 1050 768 768 1080 768 768 800 900 768 768 800 600 800 768 900 1600 900 1050 800 1050 768 800 900 800 900 900 1080 1080 768 768 948 945 1024 800 1024 1024 768 480 1080 800 900 768 800 768 768 800 864 800 800 1050 800 900 800 768 1080 1050 768 800 800 900 800 1024 1050 480 768 800 768 768 1024 768 1024 768 800 698 800 | |||||||||||||||||||||||||||||||||||||||||||||||||||||||||||||||||||||||||||||||||||||||||||||||||||
Tables (Output of Computation) | |||||||||||||||||||||||||||||||||||||||||||||||||||||||||||||||||||||||||||||||||||||||||||||||||||
| |||||||||||||||||||||||||||||||||||||||||||||||||||||||||||||||||||||||||||||||||||||||||||||||||||
Figures (Output of Computation) | |||||||||||||||||||||||||||||||||||||||||||||||||||||||||||||||||||||||||||||||||||||||||||||||||||
Input Parameters & R Code | |||||||||||||||||||||||||||||||||||||||||||||||||||||||||||||||||||||||||||||||||||||||||||||||||||
| Parameters (Session): | |||||||||||||||||||||||||||||||||||||||||||||||||||||||||||||||||||||||||||||||||||||||||||||||||||
| par1 = 9 ; par2 = 80 ; par3 = 0 ; | |||||||||||||||||||||||||||||||||||||||||||||||||||||||||||||||||||||||||||||||||||||||||||||||||||
| Parameters (R input): | |||||||||||||||||||||||||||||||||||||||||||||||||||||||||||||||||||||||||||||||||||||||||||||||||||
| R code (references can be found in the software module): | |||||||||||||||||||||||||||||||||||||||||||||||||||||||||||||||||||||||||||||||||||||||||||||||||||
bitmap(file='test1.png') | |||||||||||||||||||||||||||||||||||||||||||||||||||||||||||||||||||||||||||||||||||||||||||||||||||