Free Statistics
of Irreproducible Research!
Description of Statistical Computation | |||||||||||||||||||||||||||||||||||||||||||||||||||||||||||||||||||||||||||||||||||||||||||||||||||||||||||||||||||||||||||||||||||||||||||||||||||||||||||||||||||||||||||||||||||||||||||||||||||||
|---|---|---|---|---|---|---|---|---|---|---|---|---|---|---|---|---|---|---|---|---|---|---|---|---|---|---|---|---|---|---|---|---|---|---|---|---|---|---|---|---|---|---|---|---|---|---|---|---|---|---|---|---|---|---|---|---|---|---|---|---|---|---|---|---|---|---|---|---|---|---|---|---|---|---|---|---|---|---|---|---|---|---|---|---|---|---|---|---|---|---|---|---|---|---|---|---|---|---|---|---|---|---|---|---|---|---|---|---|---|---|---|---|---|---|---|---|---|---|---|---|---|---|---|---|---|---|---|---|---|---|---|---|---|---|---|---|---|---|---|---|---|---|---|---|---|---|---|---|---|---|---|---|---|---|---|---|---|---|---|---|---|---|---|---|---|---|---|---|---|---|---|---|---|---|---|---|---|---|---|---|---|---|---|---|---|---|---|---|---|---|---|---|---|---|---|---|---|
| Author's title | |||||||||||||||||||||||||||||||||||||||||||||||||||||||||||||||||||||||||||||||||||||||||||||||||||||||||||||||||||||||||||||||||||||||||||||||||||||||||||||||||||||||||||||||||||||||||||||||||||||
| Author | *The author of this computation has been verified* | ||||||||||||||||||||||||||||||||||||||||||||||||||||||||||||||||||||||||||||||||||||||||||||||||||||||||||||||||||||||||||||||||||||||||||||||||||||||||||||||||||||||||||||||||||||||||||||||||||||
| R Software Module | rwasp_pairs.wasp | ||||||||||||||||||||||||||||||||||||||||||||||||||||||||||||||||||||||||||||||||||||||||||||||||||||||||||||||||||||||||||||||||||||||||||||||||||||||||||||||||||||||||||||||||||||||||||||||||||||
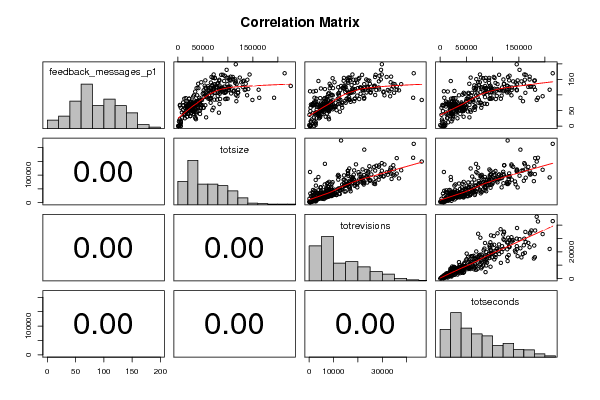
| Title produced by software | Kendall tau Correlation Matrix | ||||||||||||||||||||||||||||||||||||||||||||||||||||||||||||||||||||||||||||||||||||||||||||||||||||||||||||||||||||||||||||||||||||||||||||||||||||||||||||||||||||||||||||||||||||||||||||||||||||
| Date of computation | Sat, 17 Dec 2011 13:54:40 -0500 | ||||||||||||||||||||||||||||||||||||||||||||||||||||||||||||||||||||||||||||||||||||||||||||||||||||||||||||||||||||||||||||||||||||||||||||||||||||||||||||||||||||||||||||||||||||||||||||||||||||
| Cite this page as follows | Statistical Computations at FreeStatistics.org, Office for Research Development and Education, URL https://freestatistics.org/blog/index.php?v=date/2011/Dec/17/t13241481345z495foill1yptq.htm/, Retrieved Sat, 20 Apr 2024 15:58:41 +0000 | ||||||||||||||||||||||||||||||||||||||||||||||||||||||||||||||||||||||||||||||||||||||||||||||||||||||||||||||||||||||||||||||||||||||||||||||||||||||||||||||||||||||||||||||||||||||||||||||||||||
| Statistical Computations at FreeStatistics.org, Office for Research Development and Education, URL https://freestatistics.org/blog/index.php?pk=156560, Retrieved Sat, 20 Apr 2024 15:58:41 +0000 | |||||||||||||||||||||||||||||||||||||||||||||||||||||||||||||||||||||||||||||||||||||||||||||||||||||||||||||||||||||||||||||||||||||||||||||||||||||||||||||||||||||||||||||||||||||||||||||||||||||
| QR Codes: | |||||||||||||||||||||||||||||||||||||||||||||||||||||||||||||||||||||||||||||||||||||||||||||||||||||||||||||||||||||||||||||||||||||||||||||||||||||||||||||||||||||||||||||||||||||||||||||||||||||
|
| |||||||||||||||||||||||||||||||||||||||||||||||||||||||||||||||||||||||||||||||||||||||||||||||||||||||||||||||||||||||||||||||||||||||||||||||||||||||||||||||||||||||||||||||||||||||||||||||||||||
| Original text written by user: | |||||||||||||||||||||||||||||||||||||||||||||||||||||||||||||||||||||||||||||||||||||||||||||||||||||||||||||||||||||||||||||||||||||||||||||||||||||||||||||||||||||||||||||||||||||||||||||||||||||
| IsPrivate? | No (this computation is public) | ||||||||||||||||||||||||||||||||||||||||||||||||||||||||||||||||||||||||||||||||||||||||||||||||||||||||||||||||||||||||||||||||||||||||||||||||||||||||||||||||||||||||||||||||||||||||||||||||||||
| User-defined keywords | |||||||||||||||||||||||||||||||||||||||||||||||||||||||||||||||||||||||||||||||||||||||||||||||||||||||||||||||||||||||||||||||||||||||||||||||||||||||||||||||||||||||||||||||||||||||||||||||||||||
| Estimated Impact | 107 | ||||||||||||||||||||||||||||||||||||||||||||||||||||||||||||||||||||||||||||||||||||||||||||||||||||||||||||||||||||||||||||||||||||||||||||||||||||||||||||||||||||||||||||||||||||||||||||||||||||
Tree of Dependent Computations | |||||||||||||||||||||||||||||||||||||||||||||||||||||||||||||||||||||||||||||||||||||||||||||||||||||||||||||||||||||||||||||||||||||||||||||||||||||||||||||||||||||||||||||||||||||||||||||||||||||
| Family? (F = Feedback message, R = changed R code, M = changed R Module, P = changed Parameters, D = changed Data) | |||||||||||||||||||||||||||||||||||||||||||||||||||||||||||||||||||||||||||||||||||||||||||||||||||||||||||||||||||||||||||||||||||||||||||||||||||||||||||||||||||||||||||||||||||||||||||||||||||||
| - [Kendall tau Correlation Matrix] [] [2011-12-17 18:54:40] [fc803cbaf0eb62e67cf40ee2236375c4] [Current] | |||||||||||||||||||||||||||||||||||||||||||||||||||||||||||||||||||||||||||||||||||||||||||||||||||||||||||||||||||||||||||||||||||||||||||||||||||||||||||||||||||||||||||||||||||||||||||||||||||||
| Feedback Forum | |||||||||||||||||||||||||||||||||||||||||||||||||||||||||||||||||||||||||||||||||||||||||||||||||||||||||||||||||||||||||||||||||||||||||||||||||||||||||||||||||||||||||||||||||||||||||||||||||||||
Post a new message | |||||||||||||||||||||||||||||||||||||||||||||||||||||||||||||||||||||||||||||||||||||||||||||||||||||||||||||||||||||||||||||||||||||||||||||||||||||||||||||||||||||||||||||||||||||||||||||||||||||
Dataset | |||||||||||||||||||||||||||||||||||||||||||||||||||||||||||||||||||||||||||||||||||||||||||||||||||||||||||||||||||||||||||||||||||||||||||||||||||||||||||||||||||||||||||||||||||||||||||||||||||||
| Dataseries X: | |||||||||||||||||||||||||||||||||||||||||||||||||||||||||||||||||||||||||||||||||||||||||||||||||||||||||||||||||||||||||||||||||||||||||||||||||||||||||||||||||||||||||||||||||||||||||||||||||||||
115 112285 24188 146283 109 84786 18273 98364 146 83123 14130 86146 116 101193 32287 96933 68 38361 8654 79234 101 68504 9245 42551 96 119182 33251 195663 67 22807 1271 6853 44 17140 5279 21529 100 116174 27101 95757 93 57635 16373 85584 140 66198 19716 143983 166 71701 17753 75851 99 57793 9028 59238 139 80444 18653 93163 130 53855 8828 96037 181 97668 29498 151511 116 133824 27563 136368 116 101481 18293 112642 88 99645 22530 94728 139 114789 15977 105499 135 99052 35082 121527 108 67654 16116 127766 89 65553 15849 98958 156 97500 16026 77900 129 69112 26569 85646 118 82753 24785 98579 118 85323 17569 130767 125 72654 23825 131741 95 30727 7869 53907 126 77873 14975 178812 135 117478 37791 146761 154 74007 9605 82036 165 90183 27295 163253 113 61542 2746 27032 127 101494 34461 171975 52 27570 8098 65990 121 55813 4787 86572 136 79215 24919 159676 0 1423 603 1929 108 55461 16329 85371 46 31081 12558 58391 54 22996 7784 31580 124 83122 28522 136815 115 70106 22265 120642 128 60578 14459 69107 80 39992 14526 50495 97 79892 22240 108016 104 49810 11802 46341 59 71570 7623 78348 125 100708 11912 79336 82 33032 7935 56968 149 82875 18220 93176 149 139077 19199 161632 122 71595 19918 87850 118 72260 21884 127969 12 5950 2694 15049 144 115762 15808 155135 67 32551 3597 25109 52 31701 5296 45824 108 80670 25239 102996 166 143558 29801 160604 80 117105 18450 158051 60 23789 7132 44547 107 120733 34861 162647 127 105195 35940 174141 107 73107 16688 60622 146 132068 24683 179566 84 149193 46230 184301 141 46821 10387 75661 123 87011 21436 96144 111 95260 30546 129847 98 55183 19746 117286 105 106671 15977 71180 135 73511 22583 109377 107 92945 17274 85298 85 78664 16469 73631 155 70054 14251 86767 88 22618 3007 23824 155 74011 16851 93487 104 83737 21113 82981 132 69094 17401 73815 127 93133 23958 94552 108 95536 23567 132190 129 225920 13065 128754 116 62133 15358 66363 122 61370 14587 67808 85 43836 12770 61724 147 106117 24021 131722 99 38692 9648 68580 87 84651 20537 106175 28 56622 7905 55792 90 15986 4527 25157 109 95364 30495 76669 78 26706 7117 57283 111 89691 17719 105805 158 67267 27056 129484 141 126846 33473 72413 122 41140 9758 87831 124 102860 21115 96971 93 51715 7236 71299 124 55801 13790 77494 112 111813 32902 120336 108 120293 25131 93913 99 138599 30910 136048 117 161647 35947 181248 199 115929 29848 146123 78 24266 6943 32036 91 162901 42705 186646 158 109825 31808 102255 126 129838 26675 168237 122 37510 8435 64219 71 43750 7409 19630 75 40652 14993 76825 115 87771 36867 115338 119 85872 33835 109427 124 89275 24164 118168 72 44418 12607 84845 91 192565 22609 153197 45 35232 5892 29877 78 40909 17014 63506 39 13294 5394 22445 68 32387 9178 47695 119 140867 6440 68370 117 120662 21916 146304 39 21233 4011 38233 50 44332 5818 42071 88 61056 18647 50517 155 101338 20556 103950 0 1168 238 5841 36 13497 70 2341 123 65567 22392 84396 32 25162 3913 24610 99 32334 12237 35753 136 40735 8388 55515 117 91413 22120 209056 0 855 338 6622 88 97068 11727 115814 39 44339 3704 11609 25 14116 3988 13155 52 10288 3030 18274 75 65622 13520 72875 71 16563 1421 10112 124 76643 20923 142775 151 110681 20237 68847 71 29011 3219 17659 145 92696 3769 20112 87 94785 12252 61023 27 8773 1888 13983 131 83209 14497 65176 162 93815 28864 132432 165 86687 21721 112494 54 34553 4821 45109 159 105547 33644 170875 147 103487 15923 180759 170 213688 42935 214921 119 71220 18864 100226 49 23517 4977 32043 104 56926 7785 54454 120 91721 17939 78876 150 115168 23436 170745 112 111194 325 6940 59 51009 13539 49025 136 135777 34538 122037 107 51513 12198 53782 130 74163 26924 127748 115 51633 12716 86839 107 75345 8172 44830 75 33416 10855 77395 71 83305 11932 89324 120 98952 14300 103300 116 102372 25515 112283 79 37238 2805 10901 150 103772 29402 120691 156 123969 16440 58106 51 27142 11221 57140 118 135400 28732 122422 71 21399 5250 25899 144 130115 28608 139296 47 24874 8092 52678 28 34988 4473 23853 68 45549 1572 17306 0 6023 2065 7953 110 64466 14817 89455 147 54990 16714 147866 0 1644 556 4245 15 6179 2089 21509 4 3926 2658 7670 64 32755 10695 66675 111 34777 1669 14336 85 73224 16267 53608 68 27114 7768 30059 40 20760 7252 29668 80 37636 6387 22097 88 65461 18715 96841 48 30080 7936 41907 76 24094 8643 27080 51 69008 7294 35885 67 54968 4570 41247 59 46090 7185 28313 61 27507 10058 36845 76 10672 2342 16548 60 34029 8509 36134 68 46300 13275 55764 71 24760 6816 28910 76 18779 1930 13339 62 21280 8086 25319 61 40662 10737 66956 67 28987 8033 47487 88 22827 7058 52785 30 18513 6782 44683 64 30594 5401 35619 68 24006 6521 21920 64 27913 10856 45608 91 42744 2154 7721 88 12934 6117 20634 52 22574 5238 29788 49 41385 4820 31931 62 18653 5615 37754 61 18472 4272 32505 76 30976 8702 40557 88 63339 15340 94238 66 25568 8030 44197 71 33747 9526 43228 68 4154 1278 4103 48 19474 4236 44144 25 35130 3023 32868 68 39067 7196 27640 41 13310 3394 14063 90 65892 6371 28990 66 4143 1574 4694 54 28579 9620 42648 59 51776 6978 64329 60 21152 4911 21928 77 38084 8645 25836 68 27717 8987 22779 72 32928 5544 40820 67 11342 3083 27530 64 19499 6909 32378 63 16380 3189 10824 59 36874 6745 39613 84 48259 16724 60865 64 16734 4850 19787 56 28207 7025 20107 54 30143 6047 36605 67 41369 7377 40961 58 45833 9078 48231 59 29156 4605 39725 40 35944 3238 21455 22 36278 8100 23430 83 45588 9653 62991 81 45097 8914 49363 2 3895 786 9604 72 28394 6700 24552 61 18632 5788 31493 15 2325 593 3439 32 25139 4506 19555 62 27975 6382 21228 58 14483 5621 23177 36 13127 3997 22094 59 5839 520 2342 68 24069 8891 38798 21 3738 999 3255 55 18625 7067 24261 54 36341 4639 18511 55 24548 5654 40798 72 21792 6928 28893 41 26263 1514 21425 61 23686 9238 50276 67 49303 8204 37643 76 25659 5926 30377 64 28904 5785 27126 3 2781 4 13 63 29236 5930 42097 40 19546 3710 24451 69 22818 705 14335 48 32689 443 5084 8 5752 2416 9927 52 22197 7747 43527 66 20055 5432 27184 76 25272 4913 21610 43 82206 2650 20484 39 32073 2370 20156 14 5444 775 6012 61 20154 5576 18475 71 36944 1352 12645 44 8019 3080 11017 60 30884 10205 37623 64 19540 6095 35873 | |||||||||||||||||||||||||||||||||||||||||||||||||||||||||||||||||||||||||||||||||||||||||||||||||||||||||||||||||||||||||||||||||||||||||||||||||||||||||||||||||||||||||||||||||||||||||||||||||||||
Tables (Output of Computation) | |||||||||||||||||||||||||||||||||||||||||||||||||||||||||||||||||||||||||||||||||||||||||||||||||||||||||||||||||||||||||||||||||||||||||||||||||||||||||||||||||||||||||||||||||||||||||||||||||||||
| |||||||||||||||||||||||||||||||||||||||||||||||||||||||||||||||||||||||||||||||||||||||||||||||||||||||||||||||||||||||||||||||||||||||||||||||||||||||||||||||||||||||||||||||||||||||||||||||||||||
Figures (Output of Computation) | |||||||||||||||||||||||||||||||||||||||||||||||||||||||||||||||||||||||||||||||||||||||||||||||||||||||||||||||||||||||||||||||||||||||||||||||||||||||||||||||||||||||||||||||||||||||||||||||||||||
Input Parameters & R Code | |||||||||||||||||||||||||||||||||||||||||||||||||||||||||||||||||||||||||||||||||||||||||||||||||||||||||||||||||||||||||||||||||||||||||||||||||||||||||||||||||||||||||||||||||||||||||||||||||||||
| Parameters (Session): | |||||||||||||||||||||||||||||||||||||||||||||||||||||||||||||||||||||||||||||||||||||||||||||||||||||||||||||||||||||||||||||||||||||||||||||||||||||||||||||||||||||||||||||||||||||||||||||||||||||
| par1 = kendall ; | |||||||||||||||||||||||||||||||||||||||||||||||||||||||||||||||||||||||||||||||||||||||||||||||||||||||||||||||||||||||||||||||||||||||||||||||||||||||||||||||||||||||||||||||||||||||||||||||||||||
| Parameters (R input): | |||||||||||||||||||||||||||||||||||||||||||||||||||||||||||||||||||||||||||||||||||||||||||||||||||||||||||||||||||||||||||||||||||||||||||||||||||||||||||||||||||||||||||||||||||||||||||||||||||||
| par1 = kendall ; | |||||||||||||||||||||||||||||||||||||||||||||||||||||||||||||||||||||||||||||||||||||||||||||||||||||||||||||||||||||||||||||||||||||||||||||||||||||||||||||||||||||||||||||||||||||||||||||||||||||
| R code (references can be found in the software module): | |||||||||||||||||||||||||||||||||||||||||||||||||||||||||||||||||||||||||||||||||||||||||||||||||||||||||||||||||||||||||||||||||||||||||||||||||||||||||||||||||||||||||||||||||||||||||||||||||||||
panel.tau <- function(x, y, digits=2, prefix='', cex.cor) | |||||||||||||||||||||||||||||||||||||||||||||||||||||||||||||||||||||||||||||||||||||||||||||||||||||||||||||||||||||||||||||||||||||||||||||||||||||||||||||||||||||||||||||||||||||||||||||||||||||