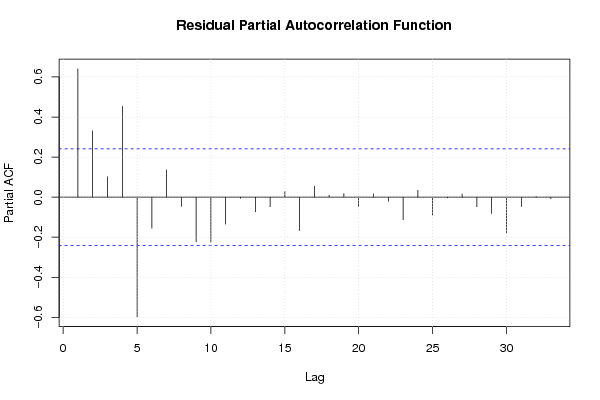
| Multiple Linear Regression - Estimated Regression Equation |
| Werkloosheid[t] = + 592.380127455885 + 2.86224278480316CPI[t] -0.0112122750615483BBP[t] + e[t] |
| Multiple Linear Regression - Ordinary Least Squares | |||||
| Variable | Parameter | S.D. | T-STAT H0: parameter = 0 | 2-tail p-value | 1-tail p-value |
| (Intercept) | 592.380127455885 | 56.712918 | 10.4452 | 0 | 0 |
| CPI | 2.86224278480316 | 0.722471 | 3.9617 | 0.000192 | 9.6e-05 |
| BBP | -0.0112122750615483 | 0.002775 | -4.04 | 0.000148 | 7.4e-05 |
| Multiple Linear Regression - Regression Statistics | |
| Multiple R | 0.454216298588512 |
| R-squared | 0.206312445903448 |
| Adjusted R-squared | 0.181116015614668 |
| F-TEST (value) | 8.18816171730976 |
| F-TEST (DF numerator) | 2 |
| F-TEST (DF denominator) | 63 |
| p-value | 0.000690178552545828 |
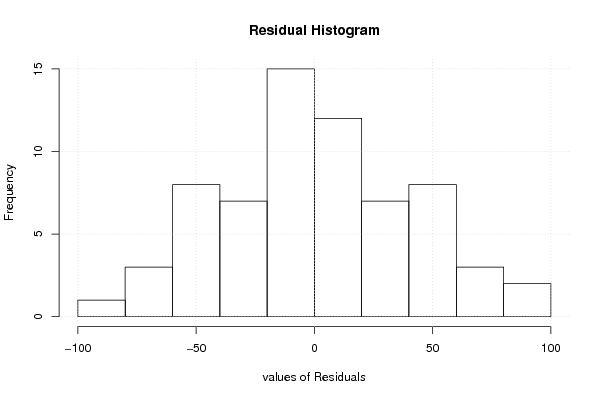
| Multiple Linear Regression - Residual Statistics | |
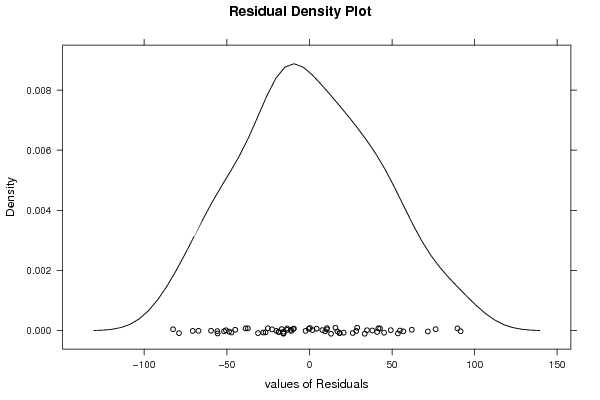
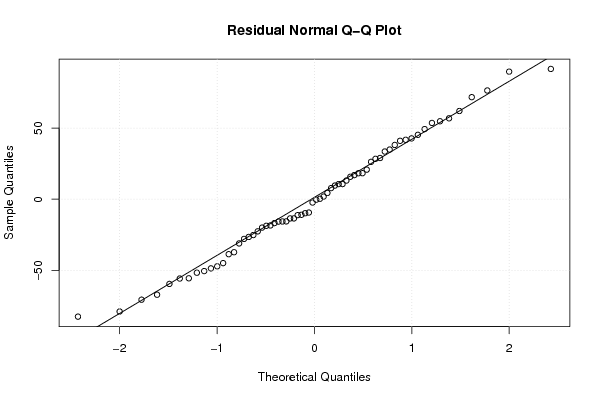
| Residual Standard Deviation | 42.1368551576271 |
| Sum Squared Residuals | 111857.417442215 |
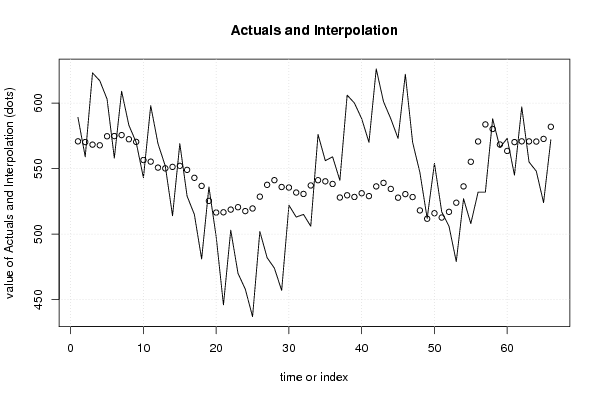
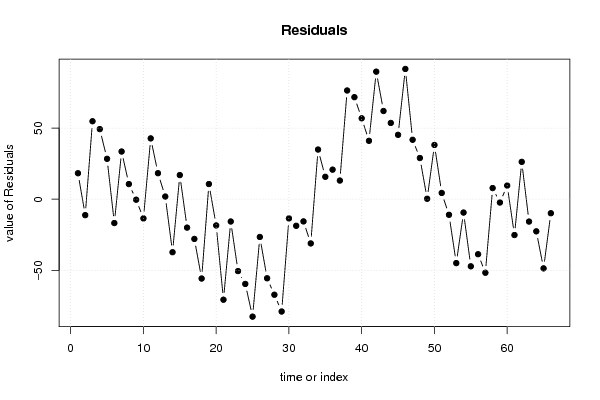
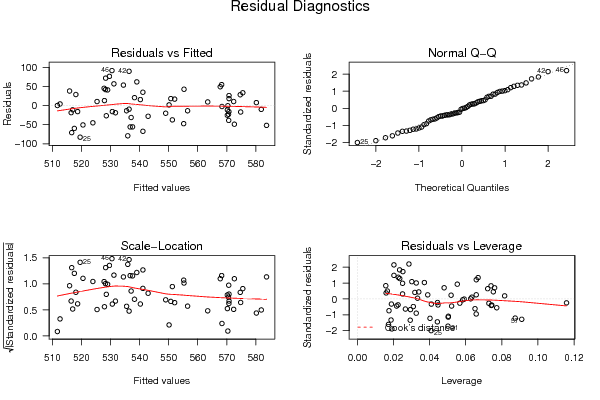
| Multiple Linear Regression - Actuals, Interpolation, and Residuals | |||
| Time or Index | Actuals | Interpolation Forecast | Residuals Prediction Error |
| 1 | 589 | 570.772204850634 | 18.227795149366 |
| 2 | 559 | 570.210250295894 | -11.2102502958943 |
| 3 | 623 | 568.238600150254 | 54.7613998497464 |
| 4 | 617 | 567.757375327212 | 49.2426246727879 |
| 5 | 603 | 574.636725228158 | 28.3632747718421 |
| 6 | 558 | 574.776813711037 | -16.7768137110365 |
| 7 | 609 | 575.514361160304 | 33.4856388396962 |
| 8 | 583 | 572.37155843367 | 10.6284415663296 |
| 9 | 570 | 570.363124651973 | -0.363124651973359 |
| 10 | 543 | 556.51437784028 | -13.5143778402796 |
| 11 | 598 | 555.284044483599 | 42.7159555164008 |
| 12 | 569 | 550.738961690941 | 18.2610383090594 |
| 13 | 552 | 550.147420126494 | 1.85257987350637 |
| 14 | 514 | 551.272663281362 | -37.2726632813617 |
| 15 | 569 | 552.060354703995 | 16.9396452960048 |
| 16 | 529 | 548.977478436381 | -19.977478436381 |
| 17 | 515 | 542.933562803895 | -27.9335628038949 |
| 18 | 481 | 536.751453685487 | -55.751453685487 |
| 19 | 536 | 525.360124275992 | 10.6398757240078 |
| 20 | 498 | 516.445927805005 | -18.4459278050047 |
| 21 | 446 | 516.637747371931 | -70.6377473719311 |
| 22 | 503 | 518.67317554776 | -15.6731755477598 |
| 23 | 470 | 520.514383029122 | -50.5143830291221 |
| 24 | 458 | 517.546085460647 | -59.5460854606469 |
| 25 | 437 | 519.539783936609 | -82.5397839366092 |
| 26 | 502 | 528.547345447493 | -26.5473454474927 |
| 27 | 482 | 537.574779815957 | -55.5747798159573 |
| 28 | 474 | 541.137416950442 | -67.1374169504415 |
| 29 | 457 | 535.928846598668 | -78.9288465986682 |
| 30 | 522 | 535.514580783449 | -13.5145807834494 |
| 31 | 513 | 531.692097992066 | -18.6920979920663 |
| 32 | 515 | 530.620857138004 | -15.6208571380043 |
| 33 | 506 | 537.093514069881 | -31.0935140698812 |
| 34 | 576 | 541.124323576372 | 34.8756764236281 |
| 35 | 556 | 540.262565507314 | 15.7374344926856 |
| 36 | 559 | 538.247188164561 | 20.7528118354392 |
| 37 | 541 | 527.905762795375 | 13.094237204625 |
| 38 | 606 | 529.62111096901 | 76.3788890309896 |
| 39 | 600 | 528.316964031198 | 71.6830359688024 |
| 40 | 588 | 531.164847730068 | 56.8351522699323 |
| 41 | 570 | 528.995645347324 | 41.0043546526761 |
| 42 | 626 | 536.381661521524 | 89.6183384784756 |
| 43 | 601 | 539.039121276113 | 61.9608787238868 |
| 44 | 588 | 534.436013777663 | 53.5639862223365 |
| 45 | 573 | 527.787757194987 | 45.212242805013 |
| 46 | 622 | 530.489381943745 | 91.5106180562547 |
| 47 | 570 | 528.255519180429 | 41.7444808195709 |
| 48 | 547 | 518.066147008787 | 28.9338529912134 |
| 49 | 512 | 511.705763392527 | 0.294236607472774 |
| 50 | 554 | 515.900365156426 | 38.0996348435737 |
| 51 | 517 | 512.625943041398 | 4.37405695860235 |
| 52 | 506 | 516.970819404122 | -10.9708194041219 |
| 53 | 479 | 523.921766490425 | -44.9217664904254 |
| 54 | 527 | 536.389276061521 | -9.38927606152069 |
| 55 | 508 | 555.172039672846 | -47.172039672846 |
| 56 | 532 | 570.663949110759 | -38.6639491107591 |
| 57 | 532 | 583.680251143591 | -51.6802511435914 |
| 58 | 588 | 580.18781557182 | 7.81218442818003 |
| 59 | 566 | 568.343760612622 | -2.34376061262162 |
| 60 | 573 | 563.434870620657 | 9.5651293793432 |
| 61 | 545 | 570.181540807329 | -25.1815408073291 |
| 62 | 597 | 570.768745324245 | 26.2312546757552 |
| 63 | 555 | 570.72825392575 | -15.7282539257502 |
| 64 | 548 | 570.593391982465 | -22.5933919824651 |
| 65 | 524 | 572.617512139214 | -48.617512139214 |
| 66 | 572 | 581.871928433216 | -9.87192843321641 |
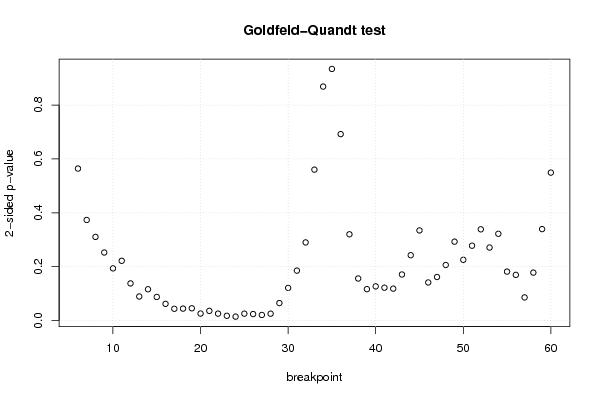
| Goldfeld-Quandt test for Heteroskedasticity | |||
| p-values | Alternative Hypothesis | ||
| breakpoint index | greater | 2-sided | less |
| 6 | 0.282115156465017 | 0.564230312930034 | 0.717884843534983 |
| 7 | 0.186748271483047 | 0.373496542966095 | 0.813251728516953 |
| 8 | 0.155349552994908 | 0.310699105989817 | 0.844650447005092 |
| 9 | 0.126404663100842 | 0.252809326201683 | 0.873595336899158 |
| 10 | 0.0970151918179196 | 0.194030383635839 | 0.90298480818208 |
| 11 | 0.111021308626109 | 0.222042617252217 | 0.888978691373891 |
| 12 | 0.0690455826202192 | 0.138091165240438 | 0.930954417379781 |
| 13 | 0.0447789810594433 | 0.0895579621188865 | 0.955221018940557 |
| 14 | 0.0582182697836385 | 0.116436539567277 | 0.941781730216361 |
| 15 | 0.0438856238300679 | 0.0877712476601357 | 0.956114376169932 |
| 16 | 0.0311461310755011 | 0.0622922621510023 | 0.968853868924499 |
| 17 | 0.0220039684565859 | 0.0440079369131719 | 0.977996031543414 |
| 18 | 0.0222686935590383 | 0.0445373871180766 | 0.977731306440962 |
| 19 | 0.022890660951862 | 0.0457813219037239 | 0.977109339048138 |
| 20 | 0.0131164777908839 | 0.0262329555817678 | 0.986883522209116 |
| 21 | 0.0180731118854746 | 0.0361462237709491 | 0.981926888114525 |
| 22 | 0.0129496579555082 | 0.0258993159110164 | 0.987050342044492 |
| 23 | 0.00897452987633131 | 0.0179490597526626 | 0.991025470123669 |
| 24 | 0.00737201937792679 | 0.0147440387558536 | 0.992627980622073 |
| 25 | 0.0129141194713922 | 0.0258282389427843 | 0.987085880528608 |
| 26 | 0.0121750411314223 | 0.0243500822628447 | 0.987824958868578 |
| 27 | 0.0104987852636398 | 0.0209975705272796 | 0.98950121473636 |
| 28 | 0.0128595459960092 | 0.0257190919920185 | 0.987140454003991 |
| 29 | 0.0325107253276712 | 0.0650214506553424 | 0.967489274672329 |
| 30 | 0.0607026091843477 | 0.121405218368695 | 0.939297390815652 |
| 31 | 0.0927708654640234 | 0.185541730928047 | 0.907229134535977 |
| 32 | 0.145098709729962 | 0.290197419459923 | 0.854901290270038 |
| 33 | 0.280143589188342 | 0.560287178376684 | 0.719856410811658 |
| 34 | 0.434265910732488 | 0.868531821464976 | 0.565734089267512 |
| 35 | 0.533040153883884 | 0.933919692232233 | 0.466959846116116 |
| 36 | 0.653948022017544 | 0.692103955964911 | 0.346051977982456 |
| 37 | 0.839814831987987 | 0.320370336024026 | 0.160185168012013 |
| 38 | 0.921834921928651 | 0.156330156142698 | 0.0781650780713488 |
| 39 | 0.941601947149619 | 0.116796105700762 | 0.0583980528503808 |
| 40 | 0.936468972388221 | 0.127062055223559 | 0.0635310276117795 |
| 41 | 0.938906330256629 | 0.122187339486743 | 0.0610936697433715 |
| 42 | 0.940684052284916 | 0.118631895430169 | 0.0593159477150844 |
| 43 | 0.914386336684054 | 0.171227326631892 | 0.0856136633159462 |
| 44 | 0.87862484381346 | 0.24275031237308 | 0.12137515618654 |
| 45 | 0.832583947865762 | 0.334832104268476 | 0.167416052134238 |
| 46 | 0.929215626821007 | 0.141568746357987 | 0.0707843731789934 |
| 47 | 0.919056408418546 | 0.161887183162909 | 0.0809435915814544 |
| 48 | 0.896799501943161 | 0.206400996113678 | 0.103200498056839 |
| 49 | 0.853507478398178 | 0.292985043203644 | 0.146492521601822 |
| 50 | 0.887151621127739 | 0.225696757744521 | 0.112848378872261 |
| 51 | 0.860999598326769 | 0.278000803346461 | 0.139000401673231 |
| 52 | 0.830537519265252 | 0.338924961469496 | 0.169462480734748 |
| 53 | 0.864374333486166 | 0.271251333027668 | 0.135625666513834 |
| 54 | 0.838851288036991 | 0.322297423926019 | 0.161148711963009 |
| 55 | 0.909027648952475 | 0.181944702095051 | 0.0909723510475253 |
| 56 | 0.915070463960856 | 0.169859072078288 | 0.0849295360391439 |
| 57 | 0.956935534313762 | 0.0861289313724764 | 0.0430644656862382 |
| 58 | 0.910927243108755 | 0.178145513782489 | 0.0890727568912447 |
| 59 | 0.830191490500764 | 0.339617018998472 | 0.169808509499236 |
| 60 | 0.725405708950381 | 0.549188582099237 | 0.274594291049619 |
| Meta Analysis of Goldfeld-Quandt test for Heteroskedasticity | |||
| Description | # significant tests | % significant tests | OK/NOK |
| 1% type I error level | 0 | 0 | OK |
| 5% type I error level | 12 | 0.218181818181818 | NOK |
| 10% type I error level | 17 | 0.309090909090909 | NOK |