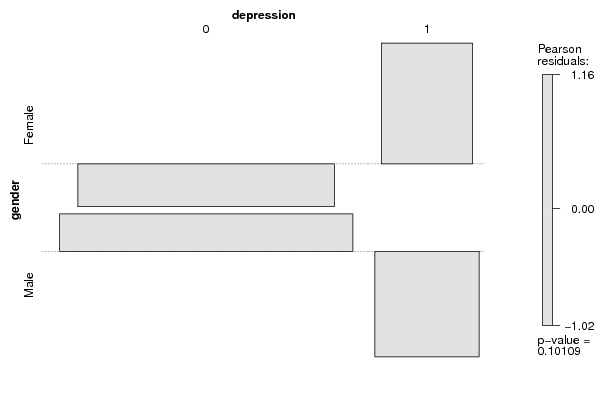
| Tabulation of Results | ||
| gender x depression | ||
| 0 | 1 | Female | 52 | 10 | Male | 75 | 6 |
| Tabulation of Expected Results | ||
| gender x depression | ||
| 0 | 1 | Female | 55.06 | 6.94 | Male | 71.94 | 9.06 |
| Statistical Results | |
| Pearson's Chi-squared test with Yates' continuity correction | |
| Pearson Chi Square Statistic | 1.88 |
| Degrees of Freedom | 1 |
| P value | 0.17 |