| Tabulation of Results | ||
| course x depression | ||
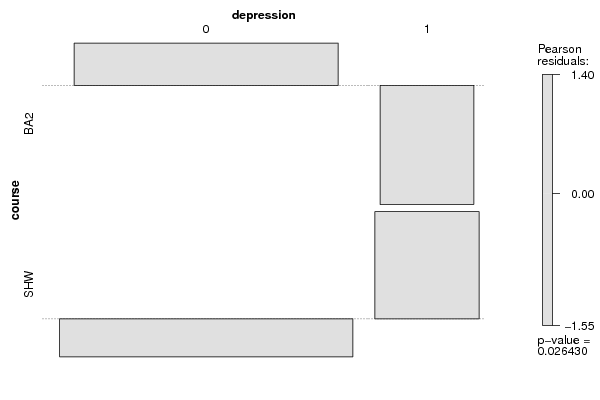
| 0 | 1 | BA2 | 61 | 3 | SHW | 66 | 13 |
| Tabulation of Expected Results | ||
| course x depression | ||
| 0 | 1 | BA2 | 56.84 | 7.16 | SHW | 70.16 | 8.84 |
| Statistical Results | |
| Pearson's Chi-squared test with simulated p-value (based on 2000 replicates) | |
| Exact Pearson Chi Square Statistic | 4.93 |
| P value | 0.03 |