| Tabulation of Results | ||
| course x depression | ||
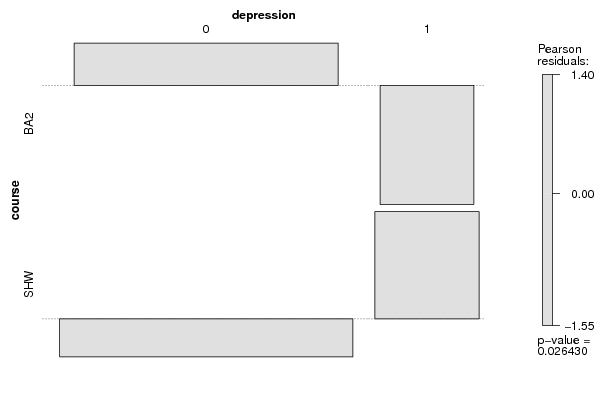
| 0 | 1 | BA2 | 61 | 3 | SHW | 66 | 13 |
| Tabulation of Expected Results | ||
| course x depression | ||
| 0 | 1 | BA2 | 56.84 | 7.16 | SHW | 70.16 | 8.84 |
| Statistical Results | |
| Pearson's Chi-squared test with Yates' continuity correction | |
| Pearson Chi Square Statistic | 3.81 |
| Degrees of Freedom | 1 |
| P value | 0.05 |