Free Statistics

of Irreproducible Research!

Author's title

Author*The author of this computation has been verified*
R Software Modulerwasp_arimabackwardselection.wasp
Title produced by softwareARIMA Backward Selection
Date of computationFri, 16 Dec 2011 07:15:26 -0500
Cite this page as followsStatistical Computations at FreeStatistics.org, Office for Research Development and Education, URL https://freestatistics.org/blog/index.php?v=date/2011/Dec/16/t13240377525y7k1cupsh1660e.htm/, Retrieved Sun, 05 May 2024 16:01:40 +0000
Statistical Computations at FreeStatistics.org, Office for Research Development and Education, URL https://freestatistics.org/blog/index.php?pk=155844, Retrieved Sun, 05 May 2024 16:01:40 +0000
QR Codes:

Original text written by user:
IsPrivate?No (this computation is public)
User-defined keywords
Estimated Impact72
Family? (F = Feedback message, R = changed R code, M = changed R Module, P = changed Parameters, D = changed Data)
-       [ARIMA Backward Selection] [] [2011-12-16 12:15:26] [05300ca098a536dd63793e3fbb62faf1] [Current]
Feedback Forum

Post a new message
Dataseries X:
1579
2146
2462
3695
4831
5134
6250
5760
6249
2917
1741
2359
1511
2059
2635
2867
4403
5720
4502
5749
5627
2846
1762
2429
1169
2154
2249
2687
4359
5382
4459
6398
4596
3024
1887
2070
1351
2218
2461
3028
4784
4975
4607
6249
4809
3157
1910
2228
1594
2467
2222
3607
4685
4962
5770
5480
5000
3228
1993
2288
1580
2111
2192
3601
4665
4876
5813
5589
5331
3075
2002
2306
1507
1992
2487
3490
4647
5594
5611
5788
6204
3013
1931
2549
1504
2090
2702
2939
4500
6208
6415
5657
5964
3163
1997
2422
1376
2202
2683
3303
5202
5231
4880
7998
4977
3531
2025
2205
1442
2238
2179
3218
5139
4990
4914
6084
5672
3548
1793
2086
1262
1743
1964
3258
4966
4944
5907
5561
5321
3582
1757
1894


Summary of computational transaction
Raw Inputview raw input (R code)
Raw Outputview raw output of R engine
Computing time8 seconds
R Server'AstonUniversity' @ aston.wessa.net

\begin{tabular}{lllllllll}
\hline
Summary of computational transaction \tabularnewline
Raw Input & view raw input (R code)  \tabularnewline
Raw Output & view raw output of R engine  \tabularnewline
Computing time & 8 seconds \tabularnewline
R Server & 'AstonUniversity' @ aston.wessa.net \tabularnewline
\hline
\end{tabular}
%Source: https://freestatistics.org/blog/index.php?pk=155844&T=0

[TABLE]
[ROW][C]Summary of computational transaction[/C][/ROW]
[ROW][C]Raw Input[/C][C]view raw input (R code) [/C][/ROW]
[ROW][C]Raw Output[/C][C]view raw output of R engine [/C][/ROW]
[ROW][C]Computing time[/C][C]8 seconds[/C][/ROW]
[ROW][C]R Server[/C][C]'AstonUniversity' @ aston.wessa.net[/C][/ROW]
[/TABLE]
Source: https://freestatistics.org/blog/index.php?pk=155844&T=0

Globally Unique Identifier (entire table): ba.freestatistics.org/blog/index.php?pk=155844&T=0

As an alternative you can also use a QR Code:  

The GUIDs for individual cells are displayed in the table below:

Summary of computational transaction
Raw Inputview raw input (R code)
Raw Outputview raw output of R engine
Computing time8 seconds
R Server'AstonUniversity' @ aston.wessa.net


ARIMA Parameter Estimation and Backward Selection
Iterationar1ar2ar3ma1sar1sar2sma1
Estimates ( 1 )0.47550.20180.2181-0.7890.3229-0.1955-1
(p-val)(0.0024 )(0.0475 )(0.0302 )(0 )(0.0027 )(0.0615 )(0 )
Estimates ( 2 )0.41270.22350.2447-0.75940.30790-1
(p-val)(0.009 )(0.0238 )(0.013 )(0 )(0.0047 )(NA )(0 )
Estimates ( 3 )NANANANANANANA
(p-val)(NA )(NA )(NA )(NA )(NA )(NA )(NA )
Estimates ( 4 )NANANANANANANA
(p-val)(NA )(NA )(NA )(NA )(NA )(NA )(NA )
Estimates ( 5 )NANANANANANANA
(p-val)(NA )(NA )(NA )(NA )(NA )(NA )(NA )
Estimates ( 6 )NANANANANANANA
(p-val)(NA )(NA )(NA )(NA )(NA )(NA )(NA )
Estimates ( 7 )NANANANANANANA
(p-val)(NA )(NA )(NA )(NA )(NA )(NA )(NA )
Estimates ( 8 )NANANANANANANA
(p-val)(NA )(NA )(NA )(NA )(NA )(NA )(NA )
Estimates ( 9 )NANANANANANANA
(p-val)(NA )(NA )(NA )(NA )(NA )(NA )(NA )
Estimates ( 10 )NANANANANANANA
(p-val)(NA )(NA )(NA )(NA )(NA )(NA )(NA )
Estimates ( 11 )NANANANANANANA
(p-val)(NA )(NA )(NA )(NA )(NA )(NA )(NA )
Estimates ( 12 )NANANANANANANA
(p-val)(NA )(NA )(NA )(NA )(NA )(NA )(NA )
Estimates ( 13 )NANANANANANANA
(p-val)(NA )(NA )(NA )(NA )(NA )(NA )(NA )

\begin{tabular}{lllllllll}
\hline
ARIMA Parameter Estimation and Backward Selection \tabularnewline
Iteration & ar1 & ar2 & ar3 & ma1 & sar1 & sar2 & sma1 \tabularnewline
Estimates ( 1 ) & 0.4755 & 0.2018 & 0.2181 & -0.789 & 0.3229 & -0.1955 & -1 \tabularnewline
(p-val) & (0.0024 ) & (0.0475 ) & (0.0302 ) & (0 ) & (0.0027 ) & (0.0615 ) & (0 ) \tabularnewline
Estimates ( 2 ) & 0.4127 & 0.2235 & 0.2447 & -0.7594 & 0.3079 & 0 & -1 \tabularnewline
(p-val) & (0.009 ) & (0.0238 ) & (0.013 ) & (0 ) & (0.0047 ) & (NA ) & (0 ) \tabularnewline
Estimates ( 3 ) & NA & NA & NA & NA & NA & NA & NA \tabularnewline
(p-val) & (NA ) & (NA ) & (NA ) & (NA ) & (NA ) & (NA ) & (NA ) \tabularnewline
Estimates ( 4 ) & NA & NA & NA & NA & NA & NA & NA \tabularnewline
(p-val) & (NA ) & (NA ) & (NA ) & (NA ) & (NA ) & (NA ) & (NA ) \tabularnewline
Estimates ( 5 ) & NA & NA & NA & NA & NA & NA & NA \tabularnewline
(p-val) & (NA ) & (NA ) & (NA ) & (NA ) & (NA ) & (NA ) & (NA ) \tabularnewline
Estimates ( 6 ) & NA & NA & NA & NA & NA & NA & NA \tabularnewline
(p-val) & (NA ) & (NA ) & (NA ) & (NA ) & (NA ) & (NA ) & (NA ) \tabularnewline
Estimates ( 7 ) & NA & NA & NA & NA & NA & NA & NA \tabularnewline
(p-val) & (NA ) & (NA ) & (NA ) & (NA ) & (NA ) & (NA ) & (NA ) \tabularnewline
Estimates ( 8 ) & NA & NA & NA & NA & NA & NA & NA \tabularnewline
(p-val) & (NA ) & (NA ) & (NA ) & (NA ) & (NA ) & (NA ) & (NA ) \tabularnewline
Estimates ( 9 ) & NA & NA & NA & NA & NA & NA & NA \tabularnewline
(p-val) & (NA ) & (NA ) & (NA ) & (NA ) & (NA ) & (NA ) & (NA ) \tabularnewline
Estimates ( 10 ) & NA & NA & NA & NA & NA & NA & NA \tabularnewline
(p-val) & (NA ) & (NA ) & (NA ) & (NA ) & (NA ) & (NA ) & (NA ) \tabularnewline
Estimates ( 11 ) & NA & NA & NA & NA & NA & NA & NA \tabularnewline
(p-val) & (NA ) & (NA ) & (NA ) & (NA ) & (NA ) & (NA ) & (NA ) \tabularnewline
Estimates ( 12 ) & NA & NA & NA & NA & NA & NA & NA \tabularnewline
(p-val) & (NA ) & (NA ) & (NA ) & (NA ) & (NA ) & (NA ) & (NA ) \tabularnewline
Estimates ( 13 ) & NA & NA & NA & NA & NA & NA & NA \tabularnewline
(p-val) & (NA ) & (NA ) & (NA ) & (NA ) & (NA ) & (NA ) & (NA ) \tabularnewline
\hline
\end{tabular}
%Source: https://freestatistics.org/blog/index.php?pk=155844&T=1

[TABLE]
[ROW][C]ARIMA Parameter Estimation and Backward Selection[/C][/ROW]
[ROW][C]Iteration[/C][C]ar1[/C][C]ar2[/C][C]ar3[/C][C]ma1[/C][C]sar1[/C][C]sar2[/C][C]sma1[/C][/ROW]
[ROW][C]Estimates ( 1 )[/C][C]0.4755[/C][C]0.2018[/C][C]0.2181[/C][C]-0.789[/C][C]0.3229[/C][C]-0.1955[/C][C]-1[/C][/ROW]
[ROW][C](p-val)[/C][C](0.0024 )[/C][C](0.0475 )[/C][C](0.0302 )[/C][C](0 )[/C][C](0.0027 )[/C][C](0.0615 )[/C][C](0 )[/C][/ROW]
[ROW][C]Estimates ( 2 )[/C][C]0.4127[/C][C]0.2235[/C][C]0.2447[/C][C]-0.7594[/C][C]0.3079[/C][C]0[/C][C]-1[/C][/ROW]
[ROW][C](p-val)[/C][C](0.009 )[/C][C](0.0238 )[/C][C](0.013 )[/C][C](0 )[/C][C](0.0047 )[/C][C](NA )[/C][C](0 )[/C][/ROW]
[ROW][C]Estimates ( 3 )[/C][C]NA[/C][C]NA[/C][C]NA[/C][C]NA[/C][C]NA[/C][C]NA[/C][C]NA[/C][/ROW]
[ROW][C](p-val)[/C][C](NA )[/C][C](NA )[/C][C](NA )[/C][C](NA )[/C][C](NA )[/C][C](NA )[/C][C](NA )[/C][/ROW]
[ROW][C]Estimates ( 4 )[/C][C]NA[/C][C]NA[/C][C]NA[/C][C]NA[/C][C]NA[/C][C]NA[/C][C]NA[/C][/ROW]
[ROW][C](p-val)[/C][C](NA )[/C][C](NA )[/C][C](NA )[/C][C](NA )[/C][C](NA )[/C][C](NA )[/C][C](NA )[/C][/ROW]
[ROW][C]Estimates ( 5 )[/C][C]NA[/C][C]NA[/C][C]NA[/C][C]NA[/C][C]NA[/C][C]NA[/C][C]NA[/C][/ROW]
[ROW][C](p-val)[/C][C](NA )[/C][C](NA )[/C][C](NA )[/C][C](NA )[/C][C](NA )[/C][C](NA )[/C][C](NA )[/C][/ROW]
[ROW][C]Estimates ( 6 )[/C][C]NA[/C][C]NA[/C][C]NA[/C][C]NA[/C][C]NA[/C][C]NA[/C][C]NA[/C][/ROW]
[ROW][C](p-val)[/C][C](NA )[/C][C](NA )[/C][C](NA )[/C][C](NA )[/C][C](NA )[/C][C](NA )[/C][C](NA )[/C][/ROW]
[ROW][C]Estimates ( 7 )[/C][C]NA[/C][C]NA[/C][C]NA[/C][C]NA[/C][C]NA[/C][C]NA[/C][C]NA[/C][/ROW]
[ROW][C](p-val)[/C][C](NA )[/C][C](NA )[/C][C](NA )[/C][C](NA )[/C][C](NA )[/C][C](NA )[/C][C](NA )[/C][/ROW]
[ROW][C]Estimates ( 8 )[/C][C]NA[/C][C]NA[/C][C]NA[/C][C]NA[/C][C]NA[/C][C]NA[/C][C]NA[/C][/ROW]
[ROW][C](p-val)[/C][C](NA )[/C][C](NA )[/C][C](NA )[/C][C](NA )[/C][C](NA )[/C][C](NA )[/C][C](NA )[/C][/ROW]
[ROW][C]Estimates ( 9 )[/C][C]NA[/C][C]NA[/C][C]NA[/C][C]NA[/C][C]NA[/C][C]NA[/C][C]NA[/C][/ROW]
[ROW][C](p-val)[/C][C](NA )[/C][C](NA )[/C][C](NA )[/C][C](NA )[/C][C](NA )[/C][C](NA )[/C][C](NA )[/C][/ROW]
[ROW][C]Estimates ( 10 )[/C][C]NA[/C][C]NA[/C][C]NA[/C][C]NA[/C][C]NA[/C][C]NA[/C][C]NA[/C][/ROW]
[ROW][C](p-val)[/C][C](NA )[/C][C](NA )[/C][C](NA )[/C][C](NA )[/C][C](NA )[/C][C](NA )[/C][C](NA )[/C][/ROW]
[ROW][C]Estimates ( 11 )[/C][C]NA[/C][C]NA[/C][C]NA[/C][C]NA[/C][C]NA[/C][C]NA[/C][C]NA[/C][/ROW]
[ROW][C](p-val)[/C][C](NA )[/C][C](NA )[/C][C](NA )[/C][C](NA )[/C][C](NA )[/C][C](NA )[/C][C](NA )[/C][/ROW]
[ROW][C]Estimates ( 12 )[/C][C]NA[/C][C]NA[/C][C]NA[/C][C]NA[/C][C]NA[/C][C]NA[/C][C]NA[/C][/ROW]
[ROW][C](p-val)[/C][C](NA )[/C][C](NA )[/C][C](NA )[/C][C](NA )[/C][C](NA )[/C][C](NA )[/C][C](NA )[/C][/ROW]
[ROW][C]Estimates ( 13 )[/C][C]NA[/C][C]NA[/C][C]NA[/C][C]NA[/C][C]NA[/C][C]NA[/C][C]NA[/C][/ROW]
[ROW][C](p-val)[/C][C](NA )[/C][C](NA )[/C][C](NA )[/C][C](NA )[/C][C](NA )[/C][C](NA )[/C][C](NA )[/C][/ROW]
[/TABLE]
Source: https://freestatistics.org/blog/index.php?pk=155844&T=1

Globally Unique Identifier (entire table): ba.freestatistics.org/blog/index.php?pk=155844&T=1

As an alternative you can also use a QR Code:  

The GUIDs for individual cells are displayed in the table below:

ARIMA Parameter Estimation and Backward Selection
Iterationar1ar2ar3ma1sar1sar2sma1
Estimates ( 1 )0.47550.20180.2181-0.7890.3229-0.1955-1
(p-val)(0.0024 )(0.0475 )(0.0302 )(0 )(0.0027 )(0.0615 )(0 )
Estimates ( 2 )0.41270.22350.2447-0.75940.30790-1
(p-val)(0.009 )(0.0238 )(0.013 )(0 )(0.0047 )(NA )(0 )
Estimates ( 3 )NANANANANANANA
(p-val)(NA )(NA )(NA )(NA )(NA )(NA )(NA )
Estimates ( 4 )NANANANANANANA
(p-val)(NA )(NA )(NA )(NA )(NA )(NA )(NA )
Estimates ( 5 )NANANANANANANA
(p-val)(NA )(NA )(NA )(NA )(NA )(NA )(NA )
Estimates ( 6 )NANANANANANANA
(p-val)(NA )(NA )(NA )(NA )(NA )(NA )(NA )
Estimates ( 7 )NANANANANANANA
(p-val)(NA )(NA )(NA )(NA )(NA )(NA )(NA )
Estimates ( 8 )NANANANANANANA
(p-val)(NA )(NA )(NA )(NA )(NA )(NA )(NA )
Estimates ( 9 )NANANANANANANA
(p-val)(NA )(NA )(NA )(NA )(NA )(NA )(NA )
Estimates ( 10 )NANANANANANANA
(p-val)(NA )(NA )(NA )(NA )(NA )(NA )(NA )
Estimates ( 11 )NANANANANANANA
(p-val)(NA )(NA )(NA )(NA )(NA )(NA )(NA )
Estimates ( 12 )NANANANANANANA
(p-val)(NA )(NA )(NA )(NA )(NA )(NA )(NA )
Estimates ( 13 )NANANANANANANA
(p-val)(NA )(NA )(NA )(NA )(NA )(NA )(NA )


Estimated ARIMA Residuals
Value
2.35899531128708
-50.0076903948238
-81.5516511450103
107.949483809732
-599.611192227388
-514.161288307825
307.613737491269
-1143.02627322199
-297.022611662587
-557.73170986631
20.5548199939738
146.647305955811
261.180673883092
-86.5421118446493
117.84168391035
-167.69637156877
-265.849958283088
-151.854313630019
-112.353207370757
-310.290402529279
499.142765922183
-710.554381287514
-20.4258750946788
92.289007287417
-100.701274547301
78.7307145091293
143.474413605318
269.300117623224
119.230999187006
278.506565372989
-186.821489524633
-486.660614003077
-142.361540872483
-300.182708442402
116.198366627855
125.83313679283
139.555689013906
201.728912756469
344.376967545916
-129.937982709166
307.54380256922
3.09976298495529
-162.671386852709
538.462320298378
-346.519223112844
-445.538169538817
-98.0510238123157
142.564593470616
45.0240936082064
57.692992641699
-174.102136772869
-177.636502221671
127.705553015254
115.116252447576
-225.77869153699
162.49254340198
-57.2578030371167
45.0644220468547
-29.0220261218093
85.0860862527349
10.9928525299703
28.6063816505974
-113.904201934567
93.1683145070216
185.632992837405
71.214376808695
438.421952249047
322.923115294252
-25.3917980269918
642.124526832638
97.500937728523
-37.829792438886
18.3248667269112
-51.0118546931755
-138.218481592595
72.3088675303009
-395.222485506834
-318.561695561617
558.335106706153
1211.87121819804
124.175618292006
80.108700599349
-102.359818863752
-35.673270348334
-147.791675866701
-262.416979747284
-156.74531379186
49.2087248388192
163.361990936216
588.068611756745
-224.301622944658
-1012.95783866343
1614.1357713843
39.871920283158
422.761789373991
-127.609030347396
-228.773310013127
-214.30668560951
-128.759177753915
-382.496312901515
-305.351547634263
89.5894771673746
-62.628441802024
-106.678603955094
-766.829699993234
251.492478654423
416.313945534355
105.104013571155
-184.820000097934
-300.204063190781
-499.09752091504
-423.283391216535
-39.8577375710046
300.859471375784
-42.9835371073131
610.336176293958
117.120404328945
-214.385208299625
222.73574764025
2.99838628789077
-305.036925700342

\begin{tabular}{lllllllll}
\hline
Estimated ARIMA Residuals \tabularnewline
Value \tabularnewline
2.35899531128708 \tabularnewline
-50.0076903948238 \tabularnewline
-81.5516511450103 \tabularnewline
107.949483809732 \tabularnewline
-599.611192227388 \tabularnewline
-514.161288307825 \tabularnewline
307.613737491269 \tabularnewline
-1143.02627322199 \tabularnewline
-297.022611662587 \tabularnewline
-557.73170986631 \tabularnewline
20.5548199939738 \tabularnewline
146.647305955811 \tabularnewline
261.180673883092 \tabularnewline
-86.5421118446493 \tabularnewline
117.84168391035 \tabularnewline
-167.69637156877 \tabularnewline
-265.849958283088 \tabularnewline
-151.854313630019 \tabularnewline
-112.353207370757 \tabularnewline
-310.290402529279 \tabularnewline
499.142765922183 \tabularnewline
-710.554381287514 \tabularnewline
-20.4258750946788 \tabularnewline
92.289007287417 \tabularnewline
-100.701274547301 \tabularnewline
78.7307145091293 \tabularnewline
143.474413605318 \tabularnewline
269.300117623224 \tabularnewline
119.230999187006 \tabularnewline
278.506565372989 \tabularnewline
-186.821489524633 \tabularnewline
-486.660614003077 \tabularnewline
-142.361540872483 \tabularnewline
-300.182708442402 \tabularnewline
116.198366627855 \tabularnewline
125.83313679283 \tabularnewline
139.555689013906 \tabularnewline
201.728912756469 \tabularnewline
344.376967545916 \tabularnewline
-129.937982709166 \tabularnewline
307.54380256922 \tabularnewline
3.09976298495529 \tabularnewline
-162.671386852709 \tabularnewline
538.462320298378 \tabularnewline
-346.519223112844 \tabularnewline
-445.538169538817 \tabularnewline
-98.0510238123157 \tabularnewline
142.564593470616 \tabularnewline
45.0240936082064 \tabularnewline
57.692992641699 \tabularnewline
-174.102136772869 \tabularnewline
-177.636502221671 \tabularnewline
127.705553015254 \tabularnewline
115.116252447576 \tabularnewline
-225.77869153699 \tabularnewline
162.49254340198 \tabularnewline
-57.2578030371167 \tabularnewline
45.0644220468547 \tabularnewline
-29.0220261218093 \tabularnewline
85.0860862527349 \tabularnewline
10.9928525299703 \tabularnewline
28.6063816505974 \tabularnewline
-113.904201934567 \tabularnewline
93.1683145070216 \tabularnewline
185.632992837405 \tabularnewline
71.214376808695 \tabularnewline
438.421952249047 \tabularnewline
322.923115294252 \tabularnewline
-25.3917980269918 \tabularnewline
642.124526832638 \tabularnewline
97.500937728523 \tabularnewline
-37.829792438886 \tabularnewline
18.3248667269112 \tabularnewline
-51.0118546931755 \tabularnewline
-138.218481592595 \tabularnewline
72.3088675303009 \tabularnewline
-395.222485506834 \tabularnewline
-318.561695561617 \tabularnewline
558.335106706153 \tabularnewline
1211.87121819804 \tabularnewline
124.175618292006 \tabularnewline
80.108700599349 \tabularnewline
-102.359818863752 \tabularnewline
-35.673270348334 \tabularnewline
-147.791675866701 \tabularnewline
-262.416979747284 \tabularnewline
-156.74531379186 \tabularnewline
49.2087248388192 \tabularnewline
163.361990936216 \tabularnewline
588.068611756745 \tabularnewline
-224.301622944658 \tabularnewline
-1012.95783866343 \tabularnewline
1614.1357713843 \tabularnewline
39.871920283158 \tabularnewline
422.761789373991 \tabularnewline
-127.609030347396 \tabularnewline
-228.773310013127 \tabularnewline
-214.30668560951 \tabularnewline
-128.759177753915 \tabularnewline
-382.496312901515 \tabularnewline
-305.351547634263 \tabularnewline
89.5894771673746 \tabularnewline
-62.628441802024 \tabularnewline
-106.678603955094 \tabularnewline
-766.829699993234 \tabularnewline
251.492478654423 \tabularnewline
416.313945534355 \tabularnewline
105.104013571155 \tabularnewline
-184.820000097934 \tabularnewline
-300.204063190781 \tabularnewline
-499.09752091504 \tabularnewline
-423.283391216535 \tabularnewline
-39.8577375710046 \tabularnewline
300.859471375784 \tabularnewline
-42.9835371073131 \tabularnewline
610.336176293958 \tabularnewline
117.120404328945 \tabularnewline
-214.385208299625 \tabularnewline
222.73574764025 \tabularnewline
2.99838628789077 \tabularnewline
-305.036925700342 \tabularnewline
\hline
\end{tabular}
%Source: https://freestatistics.org/blog/index.php?pk=155844&T=2

[TABLE]
[ROW][C]Estimated ARIMA Residuals[/C][/ROW]
[ROW][C]Value[/C][/ROW]
[ROW][C]2.35899531128708[/C][/ROW]
[ROW][C]-50.0076903948238[/C][/ROW]
[ROW][C]-81.5516511450103[/C][/ROW]
[ROW][C]107.949483809732[/C][/ROW]
[ROW][C]-599.611192227388[/C][/ROW]
[ROW][C]-514.161288307825[/C][/ROW]
[ROW][C]307.613737491269[/C][/ROW]
[ROW][C]-1143.02627322199[/C][/ROW]
[ROW][C]-297.022611662587[/C][/ROW]
[ROW][C]-557.73170986631[/C][/ROW]
[ROW][C]20.5548199939738[/C][/ROW]
[ROW][C]146.647305955811[/C][/ROW]
[ROW][C]261.180673883092[/C][/ROW]
[ROW][C]-86.5421118446493[/C][/ROW]
[ROW][C]117.84168391035[/C][/ROW]
[ROW][C]-167.69637156877[/C][/ROW]
[ROW][C]-265.849958283088[/C][/ROW]
[ROW][C]-151.854313630019[/C][/ROW]
[ROW][C]-112.353207370757[/C][/ROW]
[ROW][C]-310.290402529279[/C][/ROW]
[ROW][C]499.142765922183[/C][/ROW]
[ROW][C]-710.554381287514[/C][/ROW]
[ROW][C]-20.4258750946788[/C][/ROW]
[ROW][C]92.289007287417[/C][/ROW]
[ROW][C]-100.701274547301[/C][/ROW]
[ROW][C]78.7307145091293[/C][/ROW]
[ROW][C]143.474413605318[/C][/ROW]
[ROW][C]269.300117623224[/C][/ROW]
[ROW][C]119.230999187006[/C][/ROW]
[ROW][C]278.506565372989[/C][/ROW]
[ROW][C]-186.821489524633[/C][/ROW]
[ROW][C]-486.660614003077[/C][/ROW]
[ROW][C]-142.361540872483[/C][/ROW]
[ROW][C]-300.182708442402[/C][/ROW]
[ROW][C]116.198366627855[/C][/ROW]
[ROW][C]125.83313679283[/C][/ROW]
[ROW][C]139.555689013906[/C][/ROW]
[ROW][C]201.728912756469[/C][/ROW]
[ROW][C]344.376967545916[/C][/ROW]
[ROW][C]-129.937982709166[/C][/ROW]
[ROW][C]307.54380256922[/C][/ROW]
[ROW][C]3.09976298495529[/C][/ROW]
[ROW][C]-162.671386852709[/C][/ROW]
[ROW][C]538.462320298378[/C][/ROW]
[ROW][C]-346.519223112844[/C][/ROW]
[ROW][C]-445.538169538817[/C][/ROW]
[ROW][C]-98.0510238123157[/C][/ROW]
[ROW][C]142.564593470616[/C][/ROW]
[ROW][C]45.0240936082064[/C][/ROW]
[ROW][C]57.692992641699[/C][/ROW]
[ROW][C]-174.102136772869[/C][/ROW]
[ROW][C]-177.636502221671[/C][/ROW]
[ROW][C]127.705553015254[/C][/ROW]
[ROW][C]115.116252447576[/C][/ROW]
[ROW][C]-225.77869153699[/C][/ROW]
[ROW][C]162.49254340198[/C][/ROW]
[ROW][C]-57.2578030371167[/C][/ROW]
[ROW][C]45.0644220468547[/C][/ROW]
[ROW][C]-29.0220261218093[/C][/ROW]
[ROW][C]85.0860862527349[/C][/ROW]
[ROW][C]10.9928525299703[/C][/ROW]
[ROW][C]28.6063816505974[/C][/ROW]
[ROW][C]-113.904201934567[/C][/ROW]
[ROW][C]93.1683145070216[/C][/ROW]
[ROW][C]185.632992837405[/C][/ROW]
[ROW][C]71.214376808695[/C][/ROW]
[ROW][C]438.421952249047[/C][/ROW]
[ROW][C]322.923115294252[/C][/ROW]
[ROW][C]-25.3917980269918[/C][/ROW]
[ROW][C]642.124526832638[/C][/ROW]
[ROW][C]97.500937728523[/C][/ROW]
[ROW][C]-37.829792438886[/C][/ROW]
[ROW][C]18.3248667269112[/C][/ROW]
[ROW][C]-51.0118546931755[/C][/ROW]
[ROW][C]-138.218481592595[/C][/ROW]
[ROW][C]72.3088675303009[/C][/ROW]
[ROW][C]-395.222485506834[/C][/ROW]
[ROW][C]-318.561695561617[/C][/ROW]
[ROW][C]558.335106706153[/C][/ROW]
[ROW][C]1211.87121819804[/C][/ROW]
[ROW][C]124.175618292006[/C][/ROW]
[ROW][C]80.108700599349[/C][/ROW]
[ROW][C]-102.359818863752[/C][/ROW]
[ROW][C]-35.673270348334[/C][/ROW]
[ROW][C]-147.791675866701[/C][/ROW]
[ROW][C]-262.416979747284[/C][/ROW]
[ROW][C]-156.74531379186[/C][/ROW]
[ROW][C]49.2087248388192[/C][/ROW]
[ROW][C]163.361990936216[/C][/ROW]
[ROW][C]588.068611756745[/C][/ROW]
[ROW][C]-224.301622944658[/C][/ROW]
[ROW][C]-1012.95783866343[/C][/ROW]
[ROW][C]1614.1357713843[/C][/ROW]
[ROW][C]39.871920283158[/C][/ROW]
[ROW][C]422.761789373991[/C][/ROW]
[ROW][C]-127.609030347396[/C][/ROW]
[ROW][C]-228.773310013127[/C][/ROW]
[ROW][C]-214.30668560951[/C][/ROW]
[ROW][C]-128.759177753915[/C][/ROW]
[ROW][C]-382.496312901515[/C][/ROW]
[ROW][C]-305.351547634263[/C][/ROW]
[ROW][C]89.5894771673746[/C][/ROW]
[ROW][C]-62.628441802024[/C][/ROW]
[ROW][C]-106.678603955094[/C][/ROW]
[ROW][C]-766.829699993234[/C][/ROW]
[ROW][C]251.492478654423[/C][/ROW]
[ROW][C]416.313945534355[/C][/ROW]
[ROW][C]105.104013571155[/C][/ROW]
[ROW][C]-184.820000097934[/C][/ROW]
[ROW][C]-300.204063190781[/C][/ROW]
[ROW][C]-499.09752091504[/C][/ROW]
[ROW][C]-423.283391216535[/C][/ROW]
[ROW][C]-39.8577375710046[/C][/ROW]
[ROW][C]300.859471375784[/C][/ROW]
[ROW][C]-42.9835371073131[/C][/ROW]
[ROW][C]610.336176293958[/C][/ROW]
[ROW][C]117.120404328945[/C][/ROW]
[ROW][C]-214.385208299625[/C][/ROW]
[ROW][C]222.73574764025[/C][/ROW]
[ROW][C]2.99838628789077[/C][/ROW]
[ROW][C]-305.036925700342[/C][/ROW]
[/TABLE]
Source: https://freestatistics.org/blog/index.php?pk=155844&T=2

Globally Unique Identifier (entire table): ba.freestatistics.org/blog/index.php?pk=155844&T=2

As an alternative you can also use a QR Code:  

The GUIDs for individual cells are displayed in the table below:

Estimated ARIMA Residuals
Value
2.35899531128708
-50.0076903948238
-81.5516511450103
107.949483809732
-599.611192227388
-514.161288307825
307.613737491269
-1143.02627322199
-297.022611662587
-557.73170986631
20.5548199939738
146.647305955811
261.180673883092
-86.5421118446493
117.84168391035
-167.69637156877
-265.849958283088
-151.854313630019
-112.353207370757
-310.290402529279
499.142765922183
-710.554381287514
-20.4258750946788
92.289007287417
-100.701274547301
78.7307145091293
143.474413605318
269.300117623224
119.230999187006
278.506565372989
-186.821489524633
-486.660614003077
-142.361540872483
-300.182708442402
116.198366627855
125.83313679283
139.555689013906
201.728912756469
344.376967545916
-129.937982709166
307.54380256922
3.09976298495529
-162.671386852709
538.462320298378
-346.519223112844
-445.538169538817
-98.0510238123157
142.564593470616
45.0240936082064
57.692992641699
-174.102136772869
-177.636502221671
127.705553015254
115.116252447576
-225.77869153699
162.49254340198
-57.2578030371167
45.0644220468547
-29.0220261218093
85.0860862527349
10.9928525299703
28.6063816505974
-113.904201934567
93.1683145070216
185.632992837405
71.214376808695
438.421952249047
322.923115294252
-25.3917980269918
642.124526832638
97.500937728523
-37.829792438886
18.3248667269112
-51.0118546931755
-138.218481592595
72.3088675303009
-395.222485506834
-318.561695561617
558.335106706153
1211.87121819804
124.175618292006
80.108700599349
-102.359818863752
-35.673270348334
-147.791675866701
-262.416979747284
-156.74531379186
49.2087248388192
163.361990936216
588.068611756745
-224.301622944658
-1012.95783866343
1614.1357713843
39.871920283158
422.761789373991
-127.609030347396
-228.773310013127
-214.30668560951
-128.759177753915
-382.496312901515
-305.351547634263
89.5894771673746
-62.628441802024
-106.678603955094
-766.829699993234
251.492478654423
416.313945534355
105.104013571155
-184.820000097934
-300.204063190781
-499.09752091504
-423.283391216535
-39.8577375710046
300.859471375784
-42.9835371073131
610.336176293958
117.120404328945
-214.385208299625
222.73574764025
2.99838628789077
-305.036925700342


Parameters (Session):
par1 = FALSE ; par2 = 1 ; par3 = 0 ; par4 = 1 ; par5 = 12 ; par6 = 3 ; par7 = 1 ; par8 = 2 ; par9 = 1 ;
Parameters (R input):
par1 = FALSE ; par2 = 1 ; par3 = 0 ; par4 = 1 ; par5 = 12 ; par6 = 3 ; par7 = 1 ; par8 = 2 ; par9 = 1 ;
R code (references can be found in the software module):
library(lattice)
if (par1 == 'TRUE') par1 <- TRUE
if (par1 == 'FALSE') par1 <- FALSE
par2 <- as.numeric(par2) #Box-Cox lambda transformation parameter
par3 <- as.numeric(par3) #degree of non-seasonal differencing
par4 <- as.numeric(par4) #degree of seasonal differencing
par5 <- as.numeric(par5) #seasonal period
par6 <- as.numeric(par6) #degree (p) of the non-seasonal AR(p) polynomial
par7 <- as.numeric(par7) #degree (q) of the non-seasonal MA(q) polynomial
par8 <- as.numeric(par8) #degree (P) of the seasonal AR(P) polynomial
par9 <- as.numeric(par9) #degree (Q) of the seasonal MA(Q) polynomial
armaGR <- function(arima.out, names, n){
try1 <- arima.out$coef
try2 <- sqrt(diag(arima.out$var.coef))
try.data.frame <- data.frame(matrix(NA,ncol=4,nrow=length(names)))
dimnames(try.data.frame) <- list(names,c('coef','std','tstat','pv'))
try.data.frame[,1] <- try1
for(i in 1:length(try2)) try.data.frame[which(rownames(try.data.frame)==names(try2)[i]),2] <- try2[i]
try.data.frame[,3] <- try.data.frame[,1] / try.data.frame[,2]
try.data.frame[,4] <- round((1-pt(abs(try.data.frame[,3]),df=n-(length(try2)+1)))*2,5)
vector <- rep(NA,length(names))
vector[is.na(try.data.frame[,4])] <- 0
maxi <- which.max(try.data.frame[,4])
continue <- max(try.data.frame[,4],na.rm=TRUE) > .05
vector[maxi] <- 0
list(summary=try.data.frame,next.vector=vector,continue=continue)
}
arimaSelect <- function(series, order=c(13,0,0), seasonal=list(order=c(2,0,0),period=12), include.mean=F){
nrc <- order[1]+order[3]+seasonal$order[1]+seasonal$order[3]
coeff <- matrix(NA, nrow=nrc*2, ncol=nrc)
pval <- matrix(NA, nrow=nrc*2, ncol=nrc)
mylist <- rep(list(NULL), nrc)
names <- NULL
if(order[1] > 0) names <- paste('ar',1:order[1],sep='')
if(order[3] > 0) names <- c( names , paste('ma',1:order[3],sep='') )
if(seasonal$order[1] > 0) names <- c(names, paste('sar',1:seasonal$order[1],sep=''))
if(seasonal$order[3] > 0) names <- c(names, paste('sma',1:seasonal$order[3],sep=''))
arima.out <- arima(series, order=order, seasonal=seasonal, include.mean=include.mean, method='ML')
mylist[[1]] <- arima.out
last.arma <- armaGR(arima.out, names, length(series))
mystop <- FALSE
i <- 1
coeff[i,] <- last.arma[[1]][,1]
pval [i,] <- last.arma[[1]][,4]
i <- 2
aic <- arima.out$aic
while(!mystop){
mylist[[i]] <- arima.out
arima.out <- arima(series, order=order, seasonal=seasonal, include.mean=include.mean, method='ML', fixed=last.arma$next.vector)
aic <- c(aic, arima.out$aic)
last.arma <- armaGR(arima.out, names, length(series))
mystop <- !last.arma$continue
coeff[i,] <- last.arma[[1]][,1]
pval [i,] <- last.arma[[1]][,4]
i <- i+1
}
list(coeff, pval, mylist, aic=aic)
}
arimaSelectplot <- function(arimaSelect.out,noms,choix){
noms <- names(arimaSelect.out[[3]][[1]]$coef)
coeff <- arimaSelect.out[[1]]
k <- min(which(is.na(coeff[,1])))-1
coeff <- coeff[1:k,]
pval <- arimaSelect.out[[2]][1:k,]
aic <- arimaSelect.out$aic[1:k]
coeff[coeff==0] <- NA
n <- ncol(coeff)
if(missing(choix)) choix <- k
layout(matrix(c(1,1,1,2,
3,3,3,2,
3,3,3,4,
5,6,7,7),nr=4),
widths=c(10,35,45,15),
heights=c(30,30,15,15))
couleurs <- rainbow(75)[1:50]#(50)
ticks <- pretty(coeff)
par(mar=c(1,1,3,1))
plot(aic,k:1-.5,type='o',pch=21,bg='blue',cex=2,axes=F,lty=2,xpd=NA)
points(aic[choix],k-choix+.5,pch=21,cex=4,bg=2,xpd=NA)
title('aic',line=2)
par(mar=c(3,0,0,0))
plot(0,axes=F,xlab='',ylab='',xlim=range(ticks),ylim=c(.1,1))
rect(xleft = min(ticks) + (0:49)/50*(max(ticks)-min(ticks)),
xright = min(ticks) + (1:50)/50*(max(ticks)-min(ticks)),
ytop = rep(1,50),
ybottom= rep(0,50),col=couleurs,border=NA)
axis(1,ticks)
rect(xleft=min(ticks),xright=max(ticks),ytop=1,ybottom=0)
text(mean(coeff,na.rm=T),.5,'coefficients',cex=2,font=2)
par(mar=c(1,1,3,1))
image(1:n,1:k,t(coeff[k:1,]),axes=F,col=couleurs,zlim=range(ticks))
for(i in 1:n) for(j in 1:k) if(!is.na(coeff[j,i])) {
if(pval[j,i]<.01) symb = 'green'
else if( (pval[j,i]<.05) & (pval[j,i]>=.01)) symb = 'orange'
else if( (pval[j,i]<.1) & (pval[j,i]>=.05)) symb = 'red'
else symb = 'black'
polygon(c(i+.5 ,i+.2 ,i+.5 ,i+.5),
c(k-j+0.5,k-j+0.5,k-j+0.8,k-j+0.5),
col=symb)
if(j==choix) {
rect(xleft=i-.5,
xright=i+.5,
ybottom=k-j+1.5,
ytop=k-j+.5,
lwd=4)
text(i,
k-j+1,
round(coeff[j,i],2),
cex=1.2,
font=2)
}
else{
rect(xleft=i-.5,xright=i+.5,ybottom=k-j+1.5,ytop=k-j+.5)
text(i,k-j+1,round(coeff[j,i],2),cex=1.2,font=1)
}
}
axis(3,1:n,noms)
par(mar=c(0.5,0,0,0.5))
plot(0,axes=F,xlab='',ylab='',type='n',xlim=c(0,8),ylim=c(-.2,.8))
cols <- c('green','orange','red','black')
niv <- c('0','0.01','0.05','0.1')
for(i in 0:3){
polygon(c(1+2*i ,1+2*i ,1+2*i-.5 ,1+2*i),
c(.4 ,.7 , .4 , .4),
col=cols[i+1])
text(2*i,0.5,niv[i+1],cex=1.5)
}
text(8,.5,1,cex=1.5)
text(4,0,'p-value',cex=2)
box()
residus <- arimaSelect.out[[3]][[choix]]$res
par(mar=c(1,2,4,1))
acf(residus,main='')
title('acf',line=.5)
par(mar=c(1,2,4,1))
pacf(residus,main='')
title('pacf',line=.5)
par(mar=c(2,2,4,1))
qqnorm(residus,main='')
title('qq-norm',line=.5)
qqline(residus)
residus
}
if (par2 == 0) x <- log(x)
if (par2 != 0) x <- x^par2
(selection <- arimaSelect(x, order=c(par6,par3,par7), seasonal=list(order=c(par8,par4,par9), period=par5)))
bitmap(file='test1.png')
resid <- arimaSelectplot(selection)
dev.off()
resid
bitmap(file='test2.png')
acf(resid,length(resid)/2, main='Residual Autocorrelation Function')
dev.off()
bitmap(file='test3.png')
pacf(resid,length(resid)/2, main='Residual Partial Autocorrelation Function')
dev.off()
bitmap(file='test4.png')
cpgram(resid, main='Residual Cumulative Periodogram')
dev.off()
bitmap(file='test5.png')
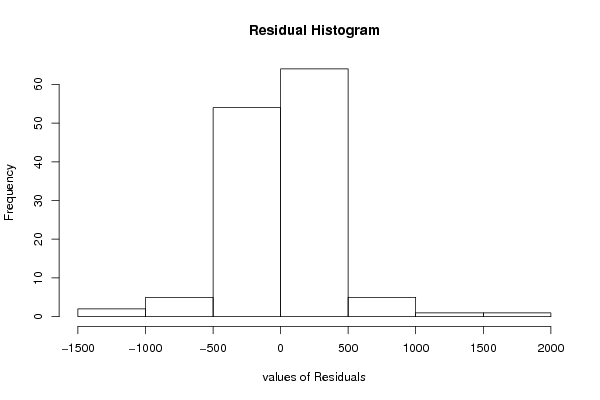
hist(resid, main='Residual Histogram', xlab='values of Residuals')
dev.off()
bitmap(file='test6.png')
densityplot(~resid,col='black',main='Residual Density Plot', xlab='values of Residuals')
dev.off()
bitmap(file='test7.png')
qqnorm(resid, main='Residual Normal Q-Q Plot')
qqline(resid)
dev.off()
ncols <- length(selection[[1]][1,])
nrows <- length(selection[[2]][,1])-1
load(file='createtable')
a<-table.start()
a<-table.row.start(a)
a<-table.element(a,'ARIMA Parameter Estimation and Backward Selection', ncols+1,TRUE)
a<-table.row.end(a)
a<-table.row.start(a)
a<-table.element(a,'Iteration', header=TRUE)
for (i in 1:ncols) {
a<-table.element(a,names(selection[[3]][[1]]$coef)[i],header=TRUE)
}
a<-table.row.end(a)
for (j in 1:nrows) {
a<-table.row.start(a)
mydum <- 'Estimates ('
mydum <- paste(mydum,j)
mydum <- paste(mydum,')')
a<-table.element(a,mydum, header=TRUE)
for (i in 1:ncols) {
a<-table.element(a,round(selection[[1]][j,i],4))
}
a<-table.row.end(a)
a<-table.row.start(a)
a<-table.element(a,'(p-val)', header=TRUE)
for (i in 1:ncols) {
mydum <- '('
mydum <- paste(mydum,round(selection[[2]][j,i],4),sep='')
mydum <- paste(mydum,')')
a<-table.element(a,mydum)
}
a<-table.row.end(a)
}
a<-table.end(a)
table.save(a,file='mytable.tab')
a<-table.start()
a<-table.row.start(a)
a<-table.element(a,'Estimated ARIMA Residuals', 1,TRUE)
a<-table.row.end(a)
a<-table.row.start(a)
a<-table.element(a,'Value', 1,TRUE)
a<-table.row.end(a)
for (i in (par4*par5+par3):length(resid)) {
a<-table.row.start(a)
a<-table.element(a,resid[i])
a<-table.row.end(a)
}
a<-table.end(a)
table.save(a,file='mytable1.tab')