Free Statistics
of Irreproducible Research!
Description of Statistical Computation | |||||||||||||||||||||||||||||||||||||||||||||||||||||||||||||||||||||||||||||||||||||||||||||||||||||||||||||||||||||||||||||||||||||||||||||||||||||||||||||||||||||||||||||||||||||||||||||||||||||||||||||||||||||||||||||||||||||||||||||||||||||||||||||||||||||||||||||||||||||||||||||||||||||||||||||||||||||||||||||||||||||||||||||||||||||||||||||||||||||||||||||||||||||||||||||||||||||||||||||||||||||||||||||||||||||||||||||||||||||||||||||||||||||||||||||||||||||||||||||||||||||||||||||||||||||||||||||||||||||||||||||||||||||||||||||||||||||||||||||||||||||||||||||||||||||||||||||||||||||||||||||||||||||||||||||||||||||||||||||||||||||||||||||||||||||||||
|---|---|---|---|---|---|---|---|---|---|---|---|---|---|---|---|---|---|---|---|---|---|---|---|---|---|---|---|---|---|---|---|---|---|---|---|---|---|---|---|---|---|---|---|---|---|---|---|---|---|---|---|---|---|---|---|---|---|---|---|---|---|---|---|---|---|---|---|---|---|---|---|---|---|---|---|---|---|---|---|---|---|---|---|---|---|---|---|---|---|---|---|---|---|---|---|---|---|---|---|---|---|---|---|---|---|---|---|---|---|---|---|---|---|---|---|---|---|---|---|---|---|---|---|---|---|---|---|---|---|---|---|---|---|---|---|---|---|---|---|---|---|---|---|---|---|---|---|---|---|---|---|---|---|---|---|---|---|---|---|---|---|---|---|---|---|---|---|---|---|---|---|---|---|---|---|---|---|---|---|---|---|---|---|---|---|---|---|---|---|---|---|---|---|---|---|---|---|---|---|---|---|---|---|---|---|---|---|---|---|---|---|---|---|---|---|---|---|---|---|---|---|---|---|---|---|---|---|---|---|---|---|---|---|---|---|---|---|---|---|---|---|---|---|---|---|---|---|---|---|---|---|---|---|---|---|---|---|---|---|---|---|---|---|---|---|---|---|---|---|---|---|---|---|---|---|---|---|---|---|---|---|---|---|---|---|---|---|---|---|---|---|---|---|---|---|---|---|---|---|---|---|---|---|---|---|---|---|---|---|---|---|---|---|---|---|---|---|---|---|---|---|---|---|---|---|---|---|---|---|---|---|---|---|---|---|---|---|---|---|---|---|---|---|---|---|---|---|---|---|---|---|---|---|---|---|---|---|---|---|---|---|---|---|---|---|---|---|---|---|---|---|---|---|---|---|---|---|---|---|---|---|---|---|---|---|---|---|---|---|---|---|---|---|---|---|---|---|---|---|---|---|---|---|---|---|---|---|---|---|---|---|---|---|---|---|---|---|---|---|---|---|---|---|---|---|---|---|---|---|---|---|---|---|---|---|---|---|---|---|---|---|---|---|---|---|---|---|---|---|---|---|---|---|---|---|---|---|---|---|---|---|---|---|---|---|---|---|---|---|---|---|---|---|---|---|---|---|---|---|---|---|---|---|---|---|---|---|---|---|---|---|---|---|---|---|---|---|---|---|---|---|---|---|---|---|---|---|---|---|---|---|---|---|---|---|---|---|---|---|---|---|---|---|---|---|---|---|---|---|---|---|---|---|---|---|---|---|---|---|---|---|---|---|---|---|---|---|---|---|---|---|---|---|---|---|---|---|---|---|---|---|---|---|---|---|---|---|---|---|---|---|---|---|---|---|---|---|---|---|---|---|---|---|---|---|---|---|---|---|---|---|---|---|---|---|---|---|---|---|---|---|---|---|---|---|---|---|---|---|---|---|---|---|---|---|---|---|---|---|---|---|---|---|---|---|---|---|---|---|---|---|---|---|---|---|---|---|---|---|---|---|---|---|---|---|---|---|---|---|---|---|---|---|---|---|---|---|---|---|---|---|---|---|---|---|
| Author's title | |||||||||||||||||||||||||||||||||||||||||||||||||||||||||||||||||||||||||||||||||||||||||||||||||||||||||||||||||||||||||||||||||||||||||||||||||||||||||||||||||||||||||||||||||||||||||||||||||||||||||||||||||||||||||||||||||||||||||||||||||||||||||||||||||||||||||||||||||||||||||||||||||||||||||||||||||||||||||||||||||||||||||||||||||||||||||||||||||||||||||||||||||||||||||||||||||||||||||||||||||||||||||||||||||||||||||||||||||||||||||||||||||||||||||||||||||||||||||||||||||||||||||||||||||||||||||||||||||||||||||||||||||||||||||||||||||||||||||||||||||||||||||||||||||||||||||||||||||||||||||||||||||||||||||||||||||||||||||||||||||||||||||||||||||||||||||
| Author | *The author of this computation has been verified* | ||||||||||||||||||||||||||||||||||||||||||||||||||||||||||||||||||||||||||||||||||||||||||||||||||||||||||||||||||||||||||||||||||||||||||||||||||||||||||||||||||||||||||||||||||||||||||||||||||||||||||||||||||||||||||||||||||||||||||||||||||||||||||||||||||||||||||||||||||||||||||||||||||||||||||||||||||||||||||||||||||||||||||||||||||||||||||||||||||||||||||||||||||||||||||||||||||||||||||||||||||||||||||||||||||||||||||||||||||||||||||||||||||||||||||||||||||||||||||||||||||||||||||||||||||||||||||||||||||||||||||||||||||||||||||||||||||||||||||||||||||||||||||||||||||||||||||||||||||||||||||||||||||||||||||||||||||||||||||||||||||||||||||||||||||||||||
| R Software Module | rwasp_pairs.wasp | ||||||||||||||||||||||||||||||||||||||||||||||||||||||||||||||||||||||||||||||||||||||||||||||||||||||||||||||||||||||||||||||||||||||||||||||||||||||||||||||||||||||||||||||||||||||||||||||||||||||||||||||||||||||||||||||||||||||||||||||||||||||||||||||||||||||||||||||||||||||||||||||||||||||||||||||||||||||||||||||||||||||||||||||||||||||||||||||||||||||||||||||||||||||||||||||||||||||||||||||||||||||||||||||||||||||||||||||||||||||||||||||||||||||||||||||||||||||||||||||||||||||||||||||||||||||||||||||||||||||||||||||||||||||||||||||||||||||||||||||||||||||||||||||||||||||||||||||||||||||||||||||||||||||||||||||||||||||||||||||||||||||||||||||||||||||||
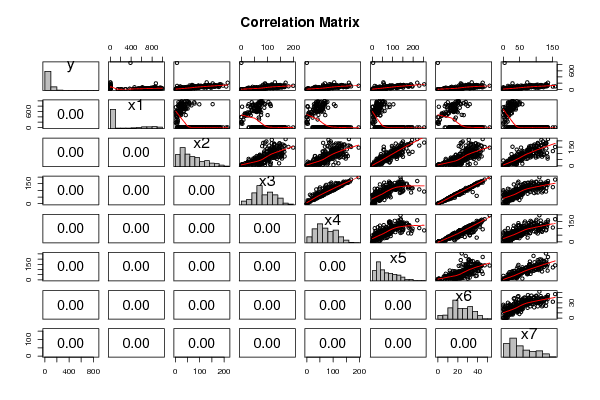
| Title produced by software | Kendall tau Correlation Matrix | ||||||||||||||||||||||||||||||||||||||||||||||||||||||||||||||||||||||||||||||||||||||||||||||||||||||||||||||||||||||||||||||||||||||||||||||||||||||||||||||||||||||||||||||||||||||||||||||||||||||||||||||||||||||||||||||||||||||||||||||||||||||||||||||||||||||||||||||||||||||||||||||||||||||||||||||||||||||||||||||||||||||||||||||||||||||||||||||||||||||||||||||||||||||||||||||||||||||||||||||||||||||||||||||||||||||||||||||||||||||||||||||||||||||||||||||||||||||||||||||||||||||||||||||||||||||||||||||||||||||||||||||||||||||||||||||||||||||||||||||||||||||||||||||||||||||||||||||||||||||||||||||||||||||||||||||||||||||||||||||||||||||||||||||||||||||||
| Date of computation | Thu, 15 Dec 2011 16:57:01 -0500 | ||||||||||||||||||||||||||||||||||||||||||||||||||||||||||||||||||||||||||||||||||||||||||||||||||||||||||||||||||||||||||||||||||||||||||||||||||||||||||||||||||||||||||||||||||||||||||||||||||||||||||||||||||||||||||||||||||||||||||||||||||||||||||||||||||||||||||||||||||||||||||||||||||||||||||||||||||||||||||||||||||||||||||||||||||||||||||||||||||||||||||||||||||||||||||||||||||||||||||||||||||||||||||||||||||||||||||||||||||||||||||||||||||||||||||||||||||||||||||||||||||||||||||||||||||||||||||||||||||||||||||||||||||||||||||||||||||||||||||||||||||||||||||||||||||||||||||||||||||||||||||||||||||||||||||||||||||||||||||||||||||||||||||||||||||||||||
| Cite this page as follows | Statistical Computations at FreeStatistics.org, Office for Research Development and Education, URL https://freestatistics.org/blog/index.php?v=date/2011/Dec/15/t1323986262nh8q6s31glvpdas.htm/, Retrieved Thu, 09 May 2024 01:59:17 +0000 | ||||||||||||||||||||||||||||||||||||||||||||||||||||||||||||||||||||||||||||||||||||||||||||||||||||||||||||||||||||||||||||||||||||||||||||||||||||||||||||||||||||||||||||||||||||||||||||||||||||||||||||||||||||||||||||||||||||||||||||||||||||||||||||||||||||||||||||||||||||||||||||||||||||||||||||||||||||||||||||||||||||||||||||||||||||||||||||||||||||||||||||||||||||||||||||||||||||||||||||||||||||||||||||||||||||||||||||||||||||||||||||||||||||||||||||||||||||||||||||||||||||||||||||||||||||||||||||||||||||||||||||||||||||||||||||||||||||||||||||||||||||||||||||||||||||||||||||||||||||||||||||||||||||||||||||||||||||||||||||||||||||||||||||||||||||||||
| Statistical Computations at FreeStatistics.org, Office for Research Development and Education, URL https://freestatistics.org/blog/index.php?pk=155730, Retrieved Thu, 09 May 2024 01:59:17 +0000 | |||||||||||||||||||||||||||||||||||||||||||||||||||||||||||||||||||||||||||||||||||||||||||||||||||||||||||||||||||||||||||||||||||||||||||||||||||||||||||||||||||||||||||||||||||||||||||||||||||||||||||||||||||||||||||||||||||||||||||||||||||||||||||||||||||||||||||||||||||||||||||||||||||||||||||||||||||||||||||||||||||||||||||||||||||||||||||||||||||||||||||||||||||||||||||||||||||||||||||||||||||||||||||||||||||||||||||||||||||||||||||||||||||||||||||||||||||||||||||||||||||||||||||||||||||||||||||||||||||||||||||||||||||||||||||||||||||||||||||||||||||||||||||||||||||||||||||||||||||||||||||||||||||||||||||||||||||||||||||||||||||||||||||||||||||||||||
| QR Codes: | |||||||||||||||||||||||||||||||||||||||||||||||||||||||||||||||||||||||||||||||||||||||||||||||||||||||||||||||||||||||||||||||||||||||||||||||||||||||||||||||||||||||||||||||||||||||||||||||||||||||||||||||||||||||||||||||||||||||||||||||||||||||||||||||||||||||||||||||||||||||||||||||||||||||||||||||||||||||||||||||||||||||||||||||||||||||||||||||||||||||||||||||||||||||||||||||||||||||||||||||||||||||||||||||||||||||||||||||||||||||||||||||||||||||||||||||||||||||||||||||||||||||||||||||||||||||||||||||||||||||||||||||||||||||||||||||||||||||||||||||||||||||||||||||||||||||||||||||||||||||||||||||||||||||||||||||||||||||||||||||||||||||||||||||||||||||||
|
| |||||||||||||||||||||||||||||||||||||||||||||||||||||||||||||||||||||||||||||||||||||||||||||||||||||||||||||||||||||||||||||||||||||||||||||||||||||||||||||||||||||||||||||||||||||||||||||||||||||||||||||||||||||||||||||||||||||||||||||||||||||||||||||||||||||||||||||||||||||||||||||||||||||||||||||||||||||||||||||||||||||||||||||||||||||||||||||||||||||||||||||||||||||||||||||||||||||||||||||||||||||||||||||||||||||||||||||||||||||||||||||||||||||||||||||||||||||||||||||||||||||||||||||||||||||||||||||||||||||||||||||||||||||||||||||||||||||||||||||||||||||||||||||||||||||||||||||||||||||||||||||||||||||||||||||||||||||||||||||||||||||||||||||||||||||||||
| Original text written by user: | |||||||||||||||||||||||||||||||||||||||||||||||||||||||||||||||||||||||||||||||||||||||||||||||||||||||||||||||||||||||||||||||||||||||||||||||||||||||||||||||||||||||||||||||||||||||||||||||||||||||||||||||||||||||||||||||||||||||||||||||||||||||||||||||||||||||||||||||||||||||||||||||||||||||||||||||||||||||||||||||||||||||||||||||||||||||||||||||||||||||||||||||||||||||||||||||||||||||||||||||||||||||||||||||||||||||||||||||||||||||||||||||||||||||||||||||||||||||||||||||||||||||||||||||||||||||||||||||||||||||||||||||||||||||||||||||||||||||||||||||||||||||||||||||||||||||||||||||||||||||||||||||||||||||||||||||||||||||||||||||||||||||||||||||||||||||||
| IsPrivate? | No (this computation is public) | ||||||||||||||||||||||||||||||||||||||||||||||||||||||||||||||||||||||||||||||||||||||||||||||||||||||||||||||||||||||||||||||||||||||||||||||||||||||||||||||||||||||||||||||||||||||||||||||||||||||||||||||||||||||||||||||||||||||||||||||||||||||||||||||||||||||||||||||||||||||||||||||||||||||||||||||||||||||||||||||||||||||||||||||||||||||||||||||||||||||||||||||||||||||||||||||||||||||||||||||||||||||||||||||||||||||||||||||||||||||||||||||||||||||||||||||||||||||||||||||||||||||||||||||||||||||||||||||||||||||||||||||||||||||||||||||||||||||||||||||||||||||||||||||||||||||||||||||||||||||||||||||||||||||||||||||||||||||||||||||||||||||||||||||||||||||||
| User-defined keywords | |||||||||||||||||||||||||||||||||||||||||||||||||||||||||||||||||||||||||||||||||||||||||||||||||||||||||||||||||||||||||||||||||||||||||||||||||||||||||||||||||||||||||||||||||||||||||||||||||||||||||||||||||||||||||||||||||||||||||||||||||||||||||||||||||||||||||||||||||||||||||||||||||||||||||||||||||||||||||||||||||||||||||||||||||||||||||||||||||||||||||||||||||||||||||||||||||||||||||||||||||||||||||||||||||||||||||||||||||||||||||||||||||||||||||||||||||||||||||||||||||||||||||||||||||||||||||||||||||||||||||||||||||||||||||||||||||||||||||||||||||||||||||||||||||||||||||||||||||||||||||||||||||||||||||||||||||||||||||||||||||||||||||||||||||||||||||
| Estimated Impact | 76 | ||||||||||||||||||||||||||||||||||||||||||||||||||||||||||||||||||||||||||||||||||||||||||||||||||||||||||||||||||||||||||||||||||||||||||||||||||||||||||||||||||||||||||||||||||||||||||||||||||||||||||||||||||||||||||||||||||||||||||||||||||||||||||||||||||||||||||||||||||||||||||||||||||||||||||||||||||||||||||||||||||||||||||||||||||||||||||||||||||||||||||||||||||||||||||||||||||||||||||||||||||||||||||||||||||||||||||||||||||||||||||||||||||||||||||||||||||||||||||||||||||||||||||||||||||||||||||||||||||||||||||||||||||||||||||||||||||||||||||||||||||||||||||||||||||||||||||||||||||||||||||||||||||||||||||||||||||||||||||||||||||||||||||||||||||||||||
Tree of Dependent Computations | |||||||||||||||||||||||||||||||||||||||||||||||||||||||||||||||||||||||||||||||||||||||||||||||||||||||||||||||||||||||||||||||||||||||||||||||||||||||||||||||||||||||||||||||||||||||||||||||||||||||||||||||||||||||||||||||||||||||||||||||||||||||||||||||||||||||||||||||||||||||||||||||||||||||||||||||||||||||||||||||||||||||||||||||||||||||||||||||||||||||||||||||||||||||||||||||||||||||||||||||||||||||||||||||||||||||||||||||||||||||||||||||||||||||||||||||||||||||||||||||||||||||||||||||||||||||||||||||||||||||||||||||||||||||||||||||||||||||||||||||||||||||||||||||||||||||||||||||||||||||||||||||||||||||||||||||||||||||||||||||||||||||||||||||||||||||||
| Family? (F = Feedback message, R = changed R code, M = changed R Module, P = changed Parameters, D = changed Data) | |||||||||||||||||||||||||||||||||||||||||||||||||||||||||||||||||||||||||||||||||||||||||||||||||||||||||||||||||||||||||||||||||||||||||||||||||||||||||||||||||||||||||||||||||||||||||||||||||||||||||||||||||||||||||||||||||||||||||||||||||||||||||||||||||||||||||||||||||||||||||||||||||||||||||||||||||||||||||||||||||||||||||||||||||||||||||||||||||||||||||||||||||||||||||||||||||||||||||||||||||||||||||||||||||||||||||||||||||||||||||||||||||||||||||||||||||||||||||||||||||||||||||||||||||||||||||||||||||||||||||||||||||||||||||||||||||||||||||||||||||||||||||||||||||||||||||||||||||||||||||||||||||||||||||||||||||||||||||||||||||||||||||||||||||||||||||
| - [Kendall tau Correlation Matrix] [Paper Kendall Tau...] [2011-12-15 21:57:01] [2934cd91706ad80fc42b61dc996a3109] [Current] | |||||||||||||||||||||||||||||||||||||||||||||||||||||||||||||||||||||||||||||||||||||||||||||||||||||||||||||||||||||||||||||||||||||||||||||||||||||||||||||||||||||||||||||||||||||||||||||||||||||||||||||||||||||||||||||||||||||||||||||||||||||||||||||||||||||||||||||||||||||||||||||||||||||||||||||||||||||||||||||||||||||||||||||||||||||||||||||||||||||||||||||||||||||||||||||||||||||||||||||||||||||||||||||||||||||||||||||||||||||||||||||||||||||||||||||||||||||||||||||||||||||||||||||||||||||||||||||||||||||||||||||||||||||||||||||||||||||||||||||||||||||||||||||||||||||||||||||||||||||||||||||||||||||||||||||||||||||||||||||||||||||||||||||||||||||||||
| Feedback Forum | |||||||||||||||||||||||||||||||||||||||||||||||||||||||||||||||||||||||||||||||||||||||||||||||||||||||||||||||||||||||||||||||||||||||||||||||||||||||||||||||||||||||||||||||||||||||||||||||||||||||||||||||||||||||||||||||||||||||||||||||||||||||||||||||||||||||||||||||||||||||||||||||||||||||||||||||||||||||||||||||||||||||||||||||||||||||||||||||||||||||||||||||||||||||||||||||||||||||||||||||||||||||||||||||||||||||||||||||||||||||||||||||||||||||||||||||||||||||||||||||||||||||||||||||||||||||||||||||||||||||||||||||||||||||||||||||||||||||||||||||||||||||||||||||||||||||||||||||||||||||||||||||||||||||||||||||||||||||||||||||||||||||||||||||||||||||||
Post a new message | |||||||||||||||||||||||||||||||||||||||||||||||||||||||||||||||||||||||||||||||||||||||||||||||||||||||||||||||||||||||||||||||||||||||||||||||||||||||||||||||||||||||||||||||||||||||||||||||||||||||||||||||||||||||||||||||||||||||||||||||||||||||||||||||||||||||||||||||||||||||||||||||||||||||||||||||||||||||||||||||||||||||||||||||||||||||||||||||||||||||||||||||||||||||||||||||||||||||||||||||||||||||||||||||||||||||||||||||||||||||||||||||||||||||||||||||||||||||||||||||||||||||||||||||||||||||||||||||||||||||||||||||||||||||||||||||||||||||||||||||||||||||||||||||||||||||||||||||||||||||||||||||||||||||||||||||||||||||||||||||||||||||||||||||||||||||||
Dataset | |||||||||||||||||||||||||||||||||||||||||||||||||||||||||||||||||||||||||||||||||||||||||||||||||||||||||||||||||||||||||||||||||||||||||||||||||||||||||||||||||||||||||||||||||||||||||||||||||||||||||||||||||||||||||||||||||||||||||||||||||||||||||||||||||||||||||||||||||||||||||||||||||||||||||||||||||||||||||||||||||||||||||||||||||||||||||||||||||||||||||||||||||||||||||||||||||||||||||||||||||||||||||||||||||||||||||||||||||||||||||||||||||||||||||||||||||||||||||||||||||||||||||||||||||||||||||||||||||||||||||||||||||||||||||||||||||||||||||||||||||||||||||||||||||||||||||||||||||||||||||||||||||||||||||||||||||||||||||||||||||||||||||||||||||||||||||
| Dataseries X: | |||||||||||||||||||||||||||||||||||||||||||||||||||||||||||||||||||||||||||||||||||||||||||||||||||||||||||||||||||||||||||||||||||||||||||||||||||||||||||||||||||||||||||||||||||||||||||||||||||||||||||||||||||||||||||||||||||||||||||||||||||||||||||||||||||||||||||||||||||||||||||||||||||||||||||||||||||||||||||||||||||||||||||||||||||||||||||||||||||||||||||||||||||||||||||||||||||||||||||||||||||||||||||||||||||||||||||||||||||||||||||||||||||||||||||||||||||||||||||||||||||||||||||||||||||||||||||||||||||||||||||||||||||||||||||||||||||||||||||||||||||||||||||||||||||||||||||||||||||||||||||||||||||||||||||||||||||||||||||||||||||||||||||||||||||||||||
112.285 1.418 146.283 115 94 144 30 79 84.786 869 98.364 109 103 103 28 58 83.123 1.530 86.146 146 93 98 38 60 101.193 2.172 96.933 116 103 135 30 108 38.361 901 79.234 68 51 61 22 49 68.504 463 42.551 101 70 39 26 0 119.182 3.201 195.663 96 91 150 25 121 22.807 371 6.853 67 22 5 18 1 17.140 1.192 21.529 44 38 28 11 20 116.174 1.583 95.757 100 93 84 26 43 57.635 1.439 85.584 93 60 80 25 69 66.198 1.764 143.983 140 123 130 38 78 71.701 1.495 75.851 166 148 82 44 86 57.793 1.373 59.238 99 90 60 30 44 80.444 2.187 93.163 139 124 131 40 104 53.855 1.491 96.037 130 70 84 34 63 97.668 4.041 151.511 181 168 140 47 158 133.824 1.706 136.368 116 115 151 30 102 101.481 2.152 112.642 116 71 91 31 77 99.645 1.036 94.728 88 66 138 23 82 114.789 1.882 105.499 139 134 150 36 115 99.052 1.929 121.527 135 117 124 36 101 67.654 2.242 127.766 108 108 119 30 80 65.553 1.220 98.958 89 84 73 25 50 97.500 1.289 77.900 156 156 110 39 83 69.112 2.515 85.646 129 120 123 34 123 82.753 2.147 98.579 118 114 90 31 73 85.323 2.352 130.767 118 94 116 31 81 72.654 1.638 131.741 125 120 113 33 105 30.727 1.222 53.907 95 81 56 25 47 77.873 1.812 178.812 126 110 115 33 105 117.478 1.677 146.761 135 133 119 35 94 74.007 1.579 82.036 154 122 129 42 44 90.183 1.731 163.253 165 158 127 43 114 61.542 807 27.032 113 109 27 30 38 101.494 2.452 171.975 127 124 175 33 107 27.570 829 65.990 52 39 35 13 30 55.813 1.940 86.572 121 92 64 32 71 79.215 2.662 159.676 136 126 96 36 84 1.423 186 1.929 0 0 0 0 0 55.461 1.499 85.371 108 70 84 28 59 31.081 865 58.391 46 37 41 14 33 22.996 1.793 31.580 54 38 47 17 42 83.122 2.527 136.815 124 120 126 32 96 70.106 2.747 120.642 115 93 105 30 106 60.578 1.324 69.107 128 95 80 35 56 39.992 2.702 50.495 80 77 70 20 57 79.892 1.383 108.016 97 90 73 28 59 49.810 1.179 46.341 104 80 57 28 39 71.570 2.099 78.348 59 31 40 39 34 100.708 4.308 79.336 125 110 68 34 76 33.032 918 56.968 82 66 21 26 20 82.875 1.831 93.176 149 138 127 39 91 139.077 3.373 161.632 149 133 154 39 115 71.595 1.713 87.850 122 113 116 33 85 72.260 1.438 127.969 118 100 102 28 76 5.950 496 15.049 12 7 7 4 8 115.762 2.253 155.135 144 140 148 39 79 32.551 744 25.109 67 61 21 18 21 31.701 1.161 45.824 52 41 35 14 30 80.670 2.352 102.996 108 96 112 29 76 143.558 2.144 160.604 166 164 137 44 101 117.105 4.691 158.051 80 78 135 21 94 23.789 1.112 44.547 60 49 26 16 27 120.733 2.694 162.647 107 102 230 28 92 105.195 1.973 174.141 127 124 181 35 123 73.107 1.769 60.622 107 99 71 28 75 132.068 3.148 179.566 146 129 147 38 128 149.193 2.474 184.301 84 62 190 23 105 46.821 2.084 75.661 141 73 64 36 55 87.011 1.954 96.144 123 114 105 32 56 95.260 1.226 129.847 111 99 107 29 41 55.183 1.389 117.286 98 70 94 25 72 106.671 1.496 71.180 105 104 116 27 67 73.511 2.269 109.377 135 116 106 36 75 92.945 1.833 85.298 107 91 143 28 114 78.664 1.268 73.631 85 74 81 23 118 70.054 1.943 86.767 155 138 89 40 77 22.618 893 23.824 88 67 26 23 22 74.011 1.762 93.487 155 151 84 40 66 83.737 1.403 82.981 104 72 113 28 69 69.094 1.425 73.815 132 120 120 34 105 93.133 1.857 94.552 127 115 110 33 116 95.536 1.840 132.190 108 105 134 28 88 225.920 1.502 128.754 129 104 54 34 73 62.133 1.441 66.363 116 108 96 30 99 61.370 1.420 67.808 122 98 78 33 62 43.836 1.416 61.724 85 69 51 22 53 106.117 2.970 131.722 147 111 121 38 118 38.692 1.317 68.580 99 99 38 26 30 84.651 1.644 106.175 87 71 145 35 100 56.622 870 55.792 28 27 59 8 49 15.986 1.654 25.157 90 69 27 24 24 95.364 1.054 76.669 109 107 91 29 67 26.706 937 57.283 78 73 48 20 46 89.691 3.004 105.805 111 107 68 29 57 67.267 2.008 129.484 158 93 58 45 75 126.846 2.547 72.413 141 129 150 37 135 41.140 1.885 87.831 122 69 74 33 68 102.860 1.626 96.971 124 118 181 33 124 51.715 1.468 71.299 93 73 65 25 33 55.801 2.445 77.494 124 119 97 32 98 111.813 1.964 120.336 112 104 121 29 58 120.293 1.381 93.913 108 107 99 28 68 138.599 1.369 136.048 99 99 152 28 81 161.647 1.659 181.248 117 90 188 31 131 115.929 2.888 146.123 199 197 138 52 110 24.266 1.290 32.036 78 36 40 21 37 162.901 2.845 186.646 91 85 254 24 130 109.825 1.982 102.255 158 139 87 41 93 129.838 1.904 168.237 126 106 178 33 118 37.510 1.391 64.219 122 50 51 32 39 43.750 602 19.630 71 64 49 19 13 40.652 1.743 76.825 75 31 73 20 74 87.771 1.559 115.338 115 63 176 31 81 85.872 2.014 109.427 119 92 94 31 109 89.275 2.143 118.168 124 106 120 32 151 44.418 2.146 84.845 72 63 66 18 51 192.565 874 153.197 91 69 56 23 28 35.232 1.590 29.877 45 41 39 17 40 40.909 1.590 63.506 78 56 66 20 56 13.294 1.210 22.445 39 25 27 12 27 32.387 2.072 47.695 68 65 65 17 37 140.867 1.281 68.370 119 93 58 30 83 120.662 1.401 146.304 117 114 98 31 54 21.233 834 38.233 39 38 25 10 27 44.332 1.105 42.071 50 44 26 13 28 61.056 1.272 50.517 88 87 77 22 59 101.338 1.944 103.950 155 110 130 42 133 1.168 391 5.841 0 0 11 1 12 13.497 761 2.341 36 27 2 9 0 65.567 1.605 84.396 123 83 101 32 106 25.162 530 24.610 32 30 31 11 23 32.334 1.988 35.753 99 80 36 25 44 40.735 1.386 55.515 136 98 120 36 71 91.413 2.395 209.056 117 82 195 31 116 855 387 6.622 0 0 4 0 4 97.068 1.742 115.814 88 60 89 24 62 44.339 620 11.609 39 28 24 13 12 14.116 449 13.155 25 9 39 8 18 10.288 800 18.274 52 33 14 13 14 65.622 1.684 72.875 75 59 78 19 60 16.563 1.050 10.112 71 49 15 18 7 76.643 2.699 142.775 124 115 106 33 98 110.681 1.606 68.847 151 140 83 40 64 29.011 1.502 17.659 71 49 24 22 29 92.696 1.204 20.112 145 120 37 38 32 94.785 1.138 61.023 87 66 77 24 25 8.773 568 13.983 27 21 16 8 16 83.209 1.459 65.176 131 124 56 35 48 93.815 2.158 132.432 162 152 132 43 100 86.687 1.111 112.494 165 139 144 43 46 34.553 1.421 45.109 54 38 40 14 45 105.547 2.833 170.875 159 144 153 41 129 103.487 1.955 180.759 147 120 143 38 130 213.688 2.922 214.921 170 160 220 45 136 71.220 1.002 100.226 119 114 79 31 59 23.517 1.060 32.043 49 39 50 13 25 56.926 956 54.454 104 78 39 28 32 91.721 2.186 78.876 120 119 95 31 63 115.168 3.604 170.745 150 141 169 40 95 111.194 1.035 6.940 112 101 12 30 14 51.009 1.417 49.025 59 56 63 16 36 135.777 3.261 122.037 136 133 134 37 113 51.513 1.587 53.782 107 83 69 30 47 74.163 1.424 127.748 130 116 119 35 92 51.633 1.701 86.839 115 90 119 32 70 75.345 1.249 44.830 107 36 75 27 19 33.416 946 77.395 75 50 63 20 50 83.305 1.926 89.324 71 61 55 18 41 98.952 3.352 103.300 120 97 103 31 91 102.372 1.641 112.283 116 98 197 31 111 37.238 2.035 10.901 79 78 16 21 41 103.772 2.312 120.691 150 117 140 39 120 123.969 1.369 58.106 156 148 89 41 135 27.142 1.577 57.140 51 41 40 13 27 135.400 2.201 122.422 118 105 125 32 87 21.399 961 25.899 71 55 21 18 25 130.115 1.900 139.296 144 132 167 39 131 24.874 1.254 52.678 47 44 32 14 45 34.988 1.335 23.853 28 21 36 7 29 45.549 1.597 17.306 68 50 13 17 58 6.023 207 7.953 0 0 5 0 4 64.466 1.645 89.455 110 73 96 30 47 54.990 2.429 147.866 147 86 151 37 109 1.644 151 4.245 0 0 6 0 7 6.179 474 21.509 15 13 13 5 12 3.926 141 7.670 4 4 3 1 0 32.755 1.639 66.675 64 57 57 16 37 34.777 872 14.336 111 48 23 32 37 73.224 1.318 53.608 85 46 61 24 46 27.114 1.018 30.059 68 48 21 17 15 20.760 1.383 29.668 40 32 43 11 42 37.636 1.314 22.097 80 68 20 24 7 65.461 1.335 96.841 88 87 82 22 54 30.080 1.403 41.907 48 43 90 12 54 24.094 910 27.080 76 67 25 19 14 69.008 616 35.885 51 46 60 13 16 54.968 1.407 41.247 67 46 61 17 33 46.090 771 28.313 59 56 85 15 32 27.507 766 36.845 61 48 43 16 21 10.672 473 16.548 76 44 25 24 15 34.029 1.376 36.134 60 60 41 15 38 46.300 1.232 55.764 68 65 26 17 22 24.760 1.521 28.910 71 55 38 18 28 18.779 572 13.339 76 38 12 20 10 21.280 1.059 25.319 62 52 29 16 31 40.662 1.544 66.956 61 60 49 16 32 28.987 1.230 47.487 67 54 46 18 32 22.827 1.206 52.785 88 86 41 22 43 18.513 1.205 44.683 30 24 31 8 27 30.594 1.255 35.619 64 52 41 17 37 24.006 613 21.920 68 49 26 18 20 27.913 721 45.608 64 61 23 16 32 42.744 1.109 7.721 91 61 14 23 0 12.934 740 20.634 88 81 16 22 5 22.574 1.126 29.788 52 43 25 13 26 41.385 728 31.931 49 40 21 13 10 18.653 689 37.754 62 40 32 16 27 18.472 592 32.505 61 56 9 16 11 30.976 995 40.557 76 68 35 20 29 63.339 1.613 94.238 88 79 42 22 25 25.568 2.048 44.197 66 47 68 17 55 33.747 705 43.228 71 57 32 18 23 4.154 301 4.103 68 41 6 17 5 19.474 1.803 44.144 48 29 68 12 43 35.130 799 32.868 25 3 33 7 23 39.067 861 27.640 68 60 84 17 34 13.310 1.186 14.063 41 30 46 14 36 65.892 1.451 28.990 90 79 30 23 35 4.143 628 4.694 66 47 0 17 0 28.579 1.161 42.648 54 40 36 14 37 51.776 1.463 64.329 59 48 47 15 28 21.152 742 21.928 60 36 20 17 16 38.084 979 25.836 77 42 50 21 26 27.717 675 22.779 68 49 30 18 38 32.928 1.241 40.820 72 57 30 18 23 11.342 676 27.530 67 12 34 17 22 19.499 1.049 32.378 64 40 33 17 30 16.380 620 10.824 63 43 34 16 16 36.874 1.081 39.613 59 33 37 15 18 48.259 1.688 60.865 84 77 83 21 28 16.734 736 19.787 64 43 32 16 32 28.207 617 20.107 56 45 30 14 21 30.143 812 36.605 54 47 43 15 23 41.369 1.051 40.961 67 43 41 17 29 45.833 1.656 48.231 58 45 51 15 50 29.156 705 39.725 59 50 19 15 12 35.944 945 21.455 40 35 37 10 21 36.278 554 23.430 22 7 33 6 18 45.588 1.597 62.991 83 71 41 22 27 45.097 982 49.363 81 67 54 21 41 3.895 222 9.604 2 0 14 1 13 28.394 1.212 24.552 72 62 25 18 12 18.632 1.143 31.493 61 54 25 17 21 2.325 435 3.439 15 4 8 4 8 25.139 532 19.555 32 25 26 10 26 27.975 882 21.228 62 40 20 16 27 14.483 608 23.177 58 38 11 16 13 13.127 459 22.094 36 19 14 9 16 5.839 578 2.342 59 17 3 16 2 24.069 826 38.798 68 67 40 17 42 3.738 509 3.255 21 14 5 7 5 18.625 717 24.261 55 30 38 15 37 36.341 637 18.511 54 54 32 14 17 24.548 857 40.798 55 35 41 14 38 21.792 830 28.893 72 59 46 18 37 26.263 652 21.425 41 24 47 12 29 23.686 707 50.276 61 58 37 16 32 49.303 954 37.643 67 42 51 21 35 25.659 1.461 30.377 76 46 49 19 17 28.904 672 27.126 64 61 21 16 20 2.781 778 13 3 3 1 1 7 29.236 1.141 42.097 63 52 44 16 46 19.546 680 24.451 40 25 26 10 24 22.818 1.090 14.335 69 40 21 19 40 32.689 616 5.084 48 32 4 12 3 5.752 285 9.927 8 4 10 2 10 22.197 1.145 43.527 52 49 43 14 37 20.055 733 27.184 66 63 34 17 17 25.272 888 21.610 76 67 32 19 28 82.206 849 20.484 43 32 20 14 19 32.073 1.182 20.156 39 23 34 11 29 5.444 528 6.012 14 7 6 4 8 20.154 642 18.475 61 54 12 16 10 36.944 947 12.645 71 37 24 20 15 8.019 819 11.017 44 35 16 12 15 30.884 757 37.623 60 51 72 15 28 19.540 894 35.873 64 39 27 16 17 | |||||||||||||||||||||||||||||||||||||||||||||||||||||||||||||||||||||||||||||||||||||||||||||||||||||||||||||||||||||||||||||||||||||||||||||||||||||||||||||||||||||||||||||||||||||||||||||||||||||||||||||||||||||||||||||||||||||||||||||||||||||||||||||||||||||||||||||||||||||||||||||||||||||||||||||||||||||||||||||||||||||||||||||||||||||||||||||||||||||||||||||||||||||||||||||||||||||||||||||||||||||||||||||||||||||||||||||||||||||||||||||||||||||||||||||||||||||||||||||||||||||||||||||||||||||||||||||||||||||||||||||||||||||||||||||||||||||||||||||||||||||||||||||||||||||||||||||||||||||||||||||||||||||||||||||||||||||||||||||||||||||||||||||||||||||||||
Tables (Output of Computation) | |||||||||||||||||||||||||||||||||||||||||||||||||||||||||||||||||||||||||||||||||||||||||||||||||||||||||||||||||||||||||||||||||||||||||||||||||||||||||||||||||||||||||||||||||||||||||||||||||||||||||||||||||||||||||||||||||||||||||||||||||||||||||||||||||||||||||||||||||||||||||||||||||||||||||||||||||||||||||||||||||||||||||||||||||||||||||||||||||||||||||||||||||||||||||||||||||||||||||||||||||||||||||||||||||||||||||||||||||||||||||||||||||||||||||||||||||||||||||||||||||||||||||||||||||||||||||||||||||||||||||||||||||||||||||||||||||||||||||||||||||||||||||||||||||||||||||||||||||||||||||||||||||||||||||||||||||||||||||||||||||||||||||||||||||||||||||
| |||||||||||||||||||||||||||||||||||||||||||||||||||||||||||||||||||||||||||||||||||||||||||||||||||||||||||||||||||||||||||||||||||||||||||||||||||||||||||||||||||||||||||||||||||||||||||||||||||||||||||||||||||||||||||||||||||||||||||||||||||||||||||||||||||||||||||||||||||||||||||||||||||||||||||||||||||||||||||||||||||||||||||||||||||||||||||||||||||||||||||||||||||||||||||||||||||||||||||||||||||||||||||||||||||||||||||||||||||||||||||||||||||||||||||||||||||||||||||||||||||||||||||||||||||||||||||||||||||||||||||||||||||||||||||||||||||||||||||||||||||||||||||||||||||||||||||||||||||||||||||||||||||||||||||||||||||||||||||||||||||||||||||||||||||||||||
Figures (Output of Computation) | |||||||||||||||||||||||||||||||||||||||||||||||||||||||||||||||||||||||||||||||||||||||||||||||||||||||||||||||||||||||||||||||||||||||||||||||||||||||||||||||||||||||||||||||||||||||||||||||||||||||||||||||||||||||||||||||||||||||||||||||||||||||||||||||||||||||||||||||||||||||||||||||||||||||||||||||||||||||||||||||||||||||||||||||||||||||||||||||||||||||||||||||||||||||||||||||||||||||||||||||||||||||||||||||||||||||||||||||||||||||||||||||||||||||||||||||||||||||||||||||||||||||||||||||||||||||||||||||||||||||||||||||||||||||||||||||||||||||||||||||||||||||||||||||||||||||||||||||||||||||||||||||||||||||||||||||||||||||||||||||||||||||||||||||||||||||||
Input Parameters & R Code | |||||||||||||||||||||||||||||||||||||||||||||||||||||||||||||||||||||||||||||||||||||||||||||||||||||||||||||||||||||||||||||||||||||||||||||||||||||||||||||||||||||||||||||||||||||||||||||||||||||||||||||||||||||||||||||||||||||||||||||||||||||||||||||||||||||||||||||||||||||||||||||||||||||||||||||||||||||||||||||||||||||||||||||||||||||||||||||||||||||||||||||||||||||||||||||||||||||||||||||||||||||||||||||||||||||||||||||||||||||||||||||||||||||||||||||||||||||||||||||||||||||||||||||||||||||||||||||||||||||||||||||||||||||||||||||||||||||||||||||||||||||||||||||||||||||||||||||||||||||||||||||||||||||||||||||||||||||||||||||||||||||||||||||||||||||||||
| Parameters (Session): | |||||||||||||||||||||||||||||||||||||||||||||||||||||||||||||||||||||||||||||||||||||||||||||||||||||||||||||||||||||||||||||||||||||||||||||||||||||||||||||||||||||||||||||||||||||||||||||||||||||||||||||||||||||||||||||||||||||||||||||||||||||||||||||||||||||||||||||||||||||||||||||||||||||||||||||||||||||||||||||||||||||||||||||||||||||||||||||||||||||||||||||||||||||||||||||||||||||||||||||||||||||||||||||||||||||||||||||||||||||||||||||||||||||||||||||||||||||||||||||||||||||||||||||||||||||||||||||||||||||||||||||||||||||||||||||||||||||||||||||||||||||||||||||||||||||||||||||||||||||||||||||||||||||||||||||||||||||||||||||||||||||||||||||||||||||||||
| par1 = pearson ; | |||||||||||||||||||||||||||||||||||||||||||||||||||||||||||||||||||||||||||||||||||||||||||||||||||||||||||||||||||||||||||||||||||||||||||||||||||||||||||||||||||||||||||||||||||||||||||||||||||||||||||||||||||||||||||||||||||||||||||||||||||||||||||||||||||||||||||||||||||||||||||||||||||||||||||||||||||||||||||||||||||||||||||||||||||||||||||||||||||||||||||||||||||||||||||||||||||||||||||||||||||||||||||||||||||||||||||||||||||||||||||||||||||||||||||||||||||||||||||||||||||||||||||||||||||||||||||||||||||||||||||||||||||||||||||||||||||||||||||||||||||||||||||||||||||||||||||||||||||||||||||||||||||||||||||||||||||||||||||||||||||||||||||||||||||||||||
| Parameters (R input): | |||||||||||||||||||||||||||||||||||||||||||||||||||||||||||||||||||||||||||||||||||||||||||||||||||||||||||||||||||||||||||||||||||||||||||||||||||||||||||||||||||||||||||||||||||||||||||||||||||||||||||||||||||||||||||||||||||||||||||||||||||||||||||||||||||||||||||||||||||||||||||||||||||||||||||||||||||||||||||||||||||||||||||||||||||||||||||||||||||||||||||||||||||||||||||||||||||||||||||||||||||||||||||||||||||||||||||||||||||||||||||||||||||||||||||||||||||||||||||||||||||||||||||||||||||||||||||||||||||||||||||||||||||||||||||||||||||||||||||||||||||||||||||||||||||||||||||||||||||||||||||||||||||||||||||||||||||||||||||||||||||||||||||||||||||||||||
| par1 = pearson ; | |||||||||||||||||||||||||||||||||||||||||||||||||||||||||||||||||||||||||||||||||||||||||||||||||||||||||||||||||||||||||||||||||||||||||||||||||||||||||||||||||||||||||||||||||||||||||||||||||||||||||||||||||||||||||||||||||||||||||||||||||||||||||||||||||||||||||||||||||||||||||||||||||||||||||||||||||||||||||||||||||||||||||||||||||||||||||||||||||||||||||||||||||||||||||||||||||||||||||||||||||||||||||||||||||||||||||||||||||||||||||||||||||||||||||||||||||||||||||||||||||||||||||||||||||||||||||||||||||||||||||||||||||||||||||||||||||||||||||||||||||||||||||||||||||||||||||||||||||||||||||||||||||||||||||||||||||||||||||||||||||||||||||||||||||||||||||
| R code (references can be found in the software module): | |||||||||||||||||||||||||||||||||||||||||||||||||||||||||||||||||||||||||||||||||||||||||||||||||||||||||||||||||||||||||||||||||||||||||||||||||||||||||||||||||||||||||||||||||||||||||||||||||||||||||||||||||||||||||||||||||||||||||||||||||||||||||||||||||||||||||||||||||||||||||||||||||||||||||||||||||||||||||||||||||||||||||||||||||||||||||||||||||||||||||||||||||||||||||||||||||||||||||||||||||||||||||||||||||||||||||||||||||||||||||||||||||||||||||||||||||||||||||||||||||||||||||||||||||||||||||||||||||||||||||||||||||||||||||||||||||||||||||||||||||||||||||||||||||||||||||||||||||||||||||||||||||||||||||||||||||||||||||||||||||||||||||||||||||||||||||
panel.tau <- function(x, y, digits=2, prefix='', cex.cor) | |||||||||||||||||||||||||||||||||||||||||||||||||||||||||||||||||||||||||||||||||||||||||||||||||||||||||||||||||||||||||||||||||||||||||||||||||||||||||||||||||||||||||||||||||||||||||||||||||||||||||||||||||||||||||||||||||||||||||||||||||||||||||||||||||||||||||||||||||||||||||||||||||||||||||||||||||||||||||||||||||||||||||||||||||||||||||||||||||||||||||||||||||||||||||||||||||||||||||||||||||||||||||||||||||||||||||||||||||||||||||||||||||||||||||||||||||||||||||||||||||||||||||||||||||||||||||||||||||||||||||||||||||||||||||||||||||||||||||||||||||||||||||||||||||||||||||||||||||||||||||||||||||||||||||||||||||||||||||||||||||||||||||||||||||||||||||