Free Statistics

of Irreproducible Research!

Author's title

Author*The author of this computation has been verified*
R Software Modulerwasp_multipleregression.wasp
Title produced by softwareMultiple Regression
Date of computationThu, 15 Dec 2011 14:29:03 -0500
Cite this page as followsStatistical Computations at FreeStatistics.org, Office for Research Development and Education, URL https://freestatistics.org/blog/index.php?v=date/2011/Dec/15/t1323977356usw8kwux6e3lhj8.htm/, Retrieved Wed, 08 May 2024 22:46:51 +0000
Statistical Computations at FreeStatistics.org, Office for Research Development and Education, URL https://freestatistics.org/blog/index.php?pk=155671, Retrieved Wed, 08 May 2024 22:46:51 +0000
QR Codes:

Original text written by user:
IsPrivate?No (this computation is public)
User-defined keywords
Estimated Impact90
Family? (F = Feedback message, R = changed R code, M = changed R Module, P = changed Parameters, D = changed Data)
-     [Kendall tau Correlation Matrix] [] [2010-12-05 18:04:16] [b98453cac15ba1066b407e146608df68]
- RMPD    [Multiple Regression] [] [2011-12-15 19:29:03] [d519577d845e738b812f706f10c86f64] [Current]
Feedback Forum

Post a new message
Dataseries X:
1461	103425	67
672	70344	28
778	43410	19
1141	104838	49
680	62215	27
1090	69304	30
616	53117	22
285	19764	12
1145	86680	31
733	84105	20
888	77945	20
849	89113	39
1182	91005	29
528	40248	16
642	64187	27
947	50857	21
819	56613	19
757	62792	35
894	72535	14


Summary of computational transaction
Raw Inputview raw input (R code)
Raw Outputview raw output of R engine
Computing time3 seconds
R Server'Gwilym Jenkins' @ jenkins.wessa.net

\begin{tabular}{lllllllll}
\hline
Summary of computational transaction \tabularnewline
Raw Input & view raw input (R code)  \tabularnewline
Raw Output & view raw output of R engine  \tabularnewline
Computing time & 3 seconds \tabularnewline
R Server & 'Gwilym Jenkins' @ jenkins.wessa.net \tabularnewline
\hline
\end{tabular}
%Source: https://freestatistics.org/blog/index.php?pk=155671&T=0

[TABLE]
[ROW][C]Summary of computational transaction[/C][/ROW]
[ROW][C]Raw Input[/C][C]view raw input (R code) [/C][/ROW]
[ROW][C]Raw Output[/C][C]view raw output of R engine [/C][/ROW]
[ROW][C]Computing time[/C][C]3 seconds[/C][/ROW]
[ROW][C]R Server[/C][C]'Gwilym Jenkins' @ jenkins.wessa.net[/C][/ROW]
[/TABLE]
Source: https://freestatistics.org/blog/index.php?pk=155671&T=0

Globally Unique Identifier (entire table): ba.freestatistics.org/blog/index.php?pk=155671&T=0

As an alternative you can also use a QR Code:  

The GUIDs for individual cells are displayed in the table below:

Summary of computational transaction
Raw Inputview raw input (R code)
Raw Outputview raw output of R engine
Computing time3 seconds
R Server'Gwilym Jenkins' @ jenkins.wessa.net


Multiple Linear Regression - Estimated Regression Equation
pageviews[t] = + 181.920119279424 + 0.00744587879947698time[t] + 5.623396066683logins[t] + e[t]

\begin{tabular}{lllllllll}
\hline
Multiple Linear Regression - Estimated Regression Equation \tabularnewline
pageviews[t] =  +  181.920119279424 +  0.00744587879947698time[t] +  5.623396066683logins[t]  + e[t] \tabularnewline
\hline
\end{tabular}
%Source: https://freestatistics.org/blog/index.php?pk=155671&T=1

[TABLE]
[ROW][C]Multiple Linear Regression - Estimated Regression Equation[/C][/ROW]
[ROW][C]pageviews[t] =  +  181.920119279424 +  0.00744587879947698time[t] +  5.623396066683logins[t]  + e[t][/C][/ROW]
[/TABLE]
Source: https://freestatistics.org/blog/index.php?pk=155671&T=1

Globally Unique Identifier (entire table): ba.freestatistics.org/blog/index.php?pk=155671&T=1

As an alternative you can also use a QR Code:  

The GUIDs for individual cells are displayed in the table below:

Multiple Linear Regression - Estimated Regression Equation
pageviews[t] = + 181.920119279424 + 0.00744587879947698time[t] + 5.623396066683logins[t] + e[t]


Multiple Linear Regression - Ordinary Least Squares
VariableParameterS.D.T-STATH0: parameter = 02-tail p-value1-tail p-value
(Intercept)181.920119279424126.8369021.43430.1707470.085374
time0.007445878799476980.0025782.88820.01070.00535
logins5.6233960666834.3168241.30270.2111260.105563

\begin{tabular}{lllllllll}
\hline
Multiple Linear Regression - Ordinary Least Squares \tabularnewline
Variable & Parameter & S.D. & T-STATH0: parameter = 0 & 2-tail p-value & 1-tail p-value \tabularnewline
(Intercept) & 181.920119279424 & 126.836902 & 1.4343 & 0.170747 & 0.085374 \tabularnewline
time & 0.00744587879947698 & 0.002578 & 2.8882 & 0.0107 & 0.00535 \tabularnewline
logins & 5.623396066683 & 4.316824 & 1.3027 & 0.211126 & 0.105563 \tabularnewline
\hline
\end{tabular}
%Source: https://freestatistics.org/blog/index.php?pk=155671&T=2

[TABLE]
[ROW][C]Multiple Linear Regression - Ordinary Least Squares[/C][/ROW]
[ROW][C]Variable[/C][C]Parameter[/C][C]S.D.[/C][C]T-STATH0: parameter = 0[/C][C]2-tail p-value[/C][C]1-tail p-value[/C][/ROW]
[ROW][C](Intercept)[/C][C]181.920119279424[/C][C]126.836902[/C][C]1.4343[/C][C]0.170747[/C][C]0.085374[/C][/ROW]
[ROW][C]time[/C][C]0.00744587879947698[/C][C]0.002578[/C][C]2.8882[/C][C]0.0107[/C][C]0.00535[/C][/ROW]
[ROW][C]logins[/C][C]5.623396066683[/C][C]4.316824[/C][C]1.3027[/C][C]0.211126[/C][C]0.105563[/C][/ROW]
[/TABLE]
Source: https://freestatistics.org/blog/index.php?pk=155671&T=2

Globally Unique Identifier (entire table): ba.freestatistics.org/blog/index.php?pk=155671&T=2

As an alternative you can also use a QR Code:  

The GUIDs for individual cells are displayed in the table below:

Multiple Linear Regression - Ordinary Least Squares
VariableParameterS.D.T-STATH0: parameter = 02-tail p-value1-tail p-value
(Intercept)181.920119279424126.8369021.43430.1707470.085374
time0.007445878799476980.0025782.88820.01070.00535
logins5.6233960666834.3168241.30270.2111260.105563


Multiple Linear Regression - Regression Statistics
Multiple R0.82191608114698
R-squared0.675546044448008
Adjusted R-squared0.634989300004009
F-TEST (value)16.6568114307303
F-TEST (DF numerator)2
F-TEST (DF denominator)16
p-value0.000122807413761139
Multiple Linear Regression - Residual Statistics
Residual Standard Deviation164.567830494519
Sum Squared Residuals433321.133338763

\begin{tabular}{lllllllll}
\hline
Multiple Linear Regression - Regression Statistics \tabularnewline
Multiple R & 0.82191608114698 \tabularnewline
R-squared & 0.675546044448008 \tabularnewline
Adjusted R-squared & 0.634989300004009 \tabularnewline
F-TEST (value) & 16.6568114307303 \tabularnewline
F-TEST (DF numerator) & 2 \tabularnewline
F-TEST (DF denominator) & 16 \tabularnewline
p-value & 0.000122807413761139 \tabularnewline
Multiple Linear Regression - Residual Statistics \tabularnewline
Residual Standard Deviation & 164.567830494519 \tabularnewline
Sum Squared Residuals & 433321.133338763 \tabularnewline
\hline
\end{tabular}
%Source: https://freestatistics.org/blog/index.php?pk=155671&T=3

[TABLE]
[ROW][C]Multiple Linear Regression - Regression Statistics[/C][/ROW]
[ROW][C]Multiple R[/C][C]0.82191608114698[/C][/ROW]
[ROW][C]R-squared[/C][C]0.675546044448008[/C][/ROW]
[ROW][C]Adjusted R-squared[/C][C]0.634989300004009[/C][/ROW]
[ROW][C]F-TEST (value)[/C][C]16.6568114307303[/C][/ROW]
[ROW][C]F-TEST (DF numerator)[/C][C]2[/C][/ROW]
[ROW][C]F-TEST (DF denominator)[/C][C]16[/C][/ROW]
[ROW][C]p-value[/C][C]0.000122807413761139[/C][/ROW]
[ROW][C]Multiple Linear Regression - Residual Statistics[/C][/ROW]
[ROW][C]Residual Standard Deviation[/C][C]164.567830494519[/C][/ROW]
[ROW][C]Sum Squared Residuals[/C][C]433321.133338763[/C][/ROW]
[/TABLE]
Source: https://freestatistics.org/blog/index.php?pk=155671&T=3

Globally Unique Identifier (entire table): ba.freestatistics.org/blog/index.php?pk=155671&T=3

As an alternative you can also use a QR Code:  

The GUIDs for individual cells are displayed in the table below:

Multiple Linear Regression - Regression Statistics
Multiple R0.82191608114698
R-squared0.675546044448008
Adjusted R-squared0.634989300004009
F-TEST (value)16.6568114307303
F-TEST (DF numerator)2
F-TEST (DF denominator)16
p-value0.000122807413761139
Multiple Linear Regression - Residual Statistics
Residual Standard Deviation164.567830494519
Sum Squared Residuals433321.133338763


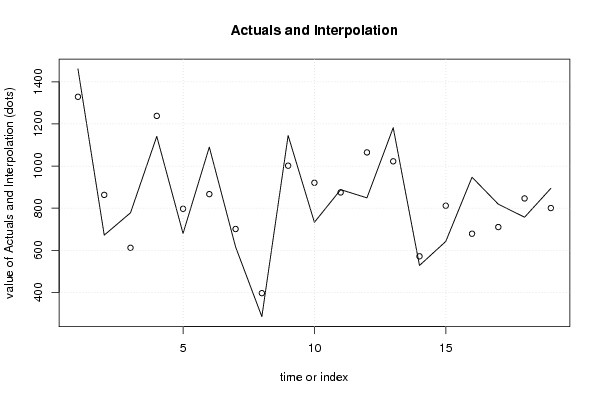
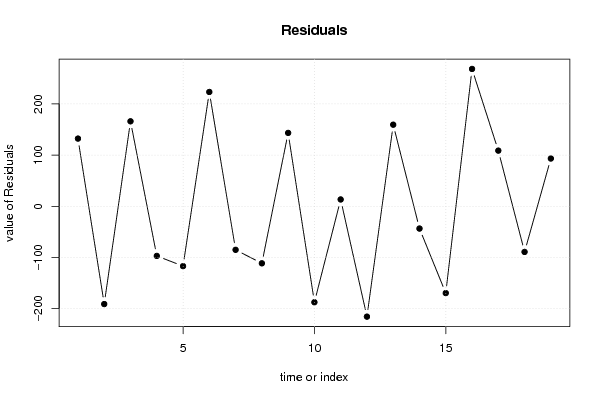
Multiple Linear Regression - Actuals, Interpolation, and Residuals
Time or IndexActualsInterpolationForecastResidualsPrediction Error
114611328.77767058309132.222329416909
2672863.148107416957-191.148107416957
3778611.990243231697166.009756768303
411411238.07756812646-97.0775681264586
5680796.997162589325-116.997162589325
61090866.651185598867223.348814401133
7616701.137576938269-85.1375769382689
8285396.561220672483-111.561220672483
911451001.65417168526143.345828314738
10733920.623677043095-187.623677043095
11888874.75706363831713.2429363616827
128491064.75716333785-215.757163337853
1311821022.61080535963159.389194640366
14528571.576186267702-43.5761862677016
15642811.680435581894-169.680435581894
16947678.686494784768268.313505215232
17819710.298181021191108.701818978809
18757846.280603190088-89.2806031900876
19894800.73448293304993.2655170669512

\begin{tabular}{lllllllll}
\hline
Multiple Linear Regression - Actuals, Interpolation, and Residuals \tabularnewline
Time or Index & Actuals & InterpolationForecast & ResidualsPrediction Error \tabularnewline
1 & 1461 & 1328.77767058309 & 132.222329416909 \tabularnewline
2 & 672 & 863.148107416957 & -191.148107416957 \tabularnewline
3 & 778 & 611.990243231697 & 166.009756768303 \tabularnewline
4 & 1141 & 1238.07756812646 & -97.0775681264586 \tabularnewline
5 & 680 & 796.997162589325 & -116.997162589325 \tabularnewline
6 & 1090 & 866.651185598867 & 223.348814401133 \tabularnewline
7 & 616 & 701.137576938269 & -85.1375769382689 \tabularnewline
8 & 285 & 396.561220672483 & -111.561220672483 \tabularnewline
9 & 1145 & 1001.65417168526 & 143.345828314738 \tabularnewline
10 & 733 & 920.623677043095 & -187.623677043095 \tabularnewline
11 & 888 & 874.757063638317 & 13.2429363616827 \tabularnewline
12 & 849 & 1064.75716333785 & -215.757163337853 \tabularnewline
13 & 1182 & 1022.61080535963 & 159.389194640366 \tabularnewline
14 & 528 & 571.576186267702 & -43.5761862677016 \tabularnewline
15 & 642 & 811.680435581894 & -169.680435581894 \tabularnewline
16 & 947 & 678.686494784768 & 268.313505215232 \tabularnewline
17 & 819 & 710.298181021191 & 108.701818978809 \tabularnewline
18 & 757 & 846.280603190088 & -89.2806031900876 \tabularnewline
19 & 894 & 800.734482933049 & 93.2655170669512 \tabularnewline
\hline
\end{tabular}
%Source: https://freestatistics.org/blog/index.php?pk=155671&T=4

[TABLE]
[ROW][C]Multiple Linear Regression - Actuals, Interpolation, and Residuals[/C][/ROW]
[ROW][C]Time or Index[/C][C]Actuals[/C][C]InterpolationForecast[/C][C]ResidualsPrediction Error[/C][/ROW]
[ROW][C]1[/C][C]1461[/C][C]1328.77767058309[/C][C]132.222329416909[/C][/ROW]
[ROW][C]2[/C][C]672[/C][C]863.148107416957[/C][C]-191.148107416957[/C][/ROW]
[ROW][C]3[/C][C]778[/C][C]611.990243231697[/C][C]166.009756768303[/C][/ROW]
[ROW][C]4[/C][C]1141[/C][C]1238.07756812646[/C][C]-97.0775681264586[/C][/ROW]
[ROW][C]5[/C][C]680[/C][C]796.997162589325[/C][C]-116.997162589325[/C][/ROW]
[ROW][C]6[/C][C]1090[/C][C]866.651185598867[/C][C]223.348814401133[/C][/ROW]
[ROW][C]7[/C][C]616[/C][C]701.137576938269[/C][C]-85.1375769382689[/C][/ROW]
[ROW][C]8[/C][C]285[/C][C]396.561220672483[/C][C]-111.561220672483[/C][/ROW]
[ROW][C]9[/C][C]1145[/C][C]1001.65417168526[/C][C]143.345828314738[/C][/ROW]
[ROW][C]10[/C][C]733[/C][C]920.623677043095[/C][C]-187.623677043095[/C][/ROW]
[ROW][C]11[/C][C]888[/C][C]874.757063638317[/C][C]13.2429363616827[/C][/ROW]
[ROW][C]12[/C][C]849[/C][C]1064.75716333785[/C][C]-215.757163337853[/C][/ROW]
[ROW][C]13[/C][C]1182[/C][C]1022.61080535963[/C][C]159.389194640366[/C][/ROW]
[ROW][C]14[/C][C]528[/C][C]571.576186267702[/C][C]-43.5761862677016[/C][/ROW]
[ROW][C]15[/C][C]642[/C][C]811.680435581894[/C][C]-169.680435581894[/C][/ROW]
[ROW][C]16[/C][C]947[/C][C]678.686494784768[/C][C]268.313505215232[/C][/ROW]
[ROW][C]17[/C][C]819[/C][C]710.298181021191[/C][C]108.701818978809[/C][/ROW]
[ROW][C]18[/C][C]757[/C][C]846.280603190088[/C][C]-89.2806031900876[/C][/ROW]
[ROW][C]19[/C][C]894[/C][C]800.734482933049[/C][C]93.2655170669512[/C][/ROW]
[/TABLE]
Source: https://freestatistics.org/blog/index.php?pk=155671&T=4

Globally Unique Identifier (entire table): ba.freestatistics.org/blog/index.php?pk=155671&T=4

As an alternative you can also use a QR Code:  

The GUIDs for individual cells are displayed in the table below:

Multiple Linear Regression - Actuals, Interpolation, and Residuals
Time or IndexActualsInterpolationForecastResidualsPrediction Error
114611328.77767058309132.222329416909
2672863.148107416957-191.148107416957
3778611.990243231697166.009756768303
411411238.07756812646-97.0775681264586
5680796.997162589325-116.997162589325
61090866.651185598867223.348814401133
7616701.137576938269-85.1375769382689
8285396.561220672483-111.561220672483
911451001.65417168526143.345828314738
10733920.623677043095-187.623677043095
11888874.75706363831713.2429363616827
128491064.75716333785-215.757163337853
1311821022.61080535963159.389194640366
14528571.576186267702-43.5761862677016
15642811.680435581894-169.680435581894
16947678.686494784768268.313505215232
17819710.298181021191108.701818978809
18757846.280603190088-89.2806031900876
19894800.73448293304993.2655170669512


Parameters (Session):
par1 = 1 ; par2 = Do not include Seasonal Dummies ; par3 = No Linear Trend ;
Parameters (R input):
par1 = 1 ; par2 = Do not include Seasonal Dummies ; par3 = No Linear Trend ;
R code (references can be found in the software module):
library(lattice)
library(lmtest)
n25 <- 25 #minimum number of obs. for Goldfeld-Quandt test
par1 <- as.numeric(par1)
x <- t(y)
k <- length(x[1,])
n <- length(x[,1])
x1 <- cbind(x[,par1], x[,1:k!=par1])
mycolnames <- c(colnames(x)[par1], colnames(x)[1:k!=par1])
colnames(x1) <- mycolnames #colnames(x)[par1]
x <- x1
if (par3 == 'First Differences'){
x2 <- array(0, dim=c(n-1,k), dimnames=list(1:(n-1), paste('(1-B)',colnames(x),sep='')))
for (i in 1:n-1) {
for (j in 1:k) {
x2[i,j] <- x[i+1,j] - x[i,j]
}
}
x <- x2
}
if (par2 == 'Include Monthly Dummies'){
x2 <- array(0, dim=c(n,11), dimnames=list(1:n, paste('M', seq(1:11), sep ='')))
for (i in 1:11){
x2[seq(i,n,12),i] <- 1
}
x <- cbind(x, x2)
}
if (par2 == 'Include Quarterly Dummies'){
x2 <- array(0, dim=c(n,3), dimnames=list(1:n, paste('Q', seq(1:3), sep ='')))
for (i in 1:3){
x2[seq(i,n,4),i] <- 1
}
x <- cbind(x, x2)
}
k <- length(x[1,])
if (par3 == 'Linear Trend'){
x <- cbind(x, c(1:n))
colnames(x)[k+1] <- 't'
}
x
k <- length(x[1,])
df <- as.data.frame(x)
(mylm <- lm(df))
(mysum <- summary(mylm))
if (n > n25) {
kp3 <- k + 3
nmkm3 <- n - k - 3
gqarr <- array(NA, dim=c(nmkm3-kp3+1,3))
numgqtests <- 0
numsignificant1 <- 0
numsignificant5 <- 0
numsignificant10 <- 0
for (mypoint in kp3:nmkm3) {
j <- 0
numgqtests <- numgqtests + 1
for (myalt in c('greater', 'two.sided', 'less')) {
j <- j + 1
gqarr[mypoint-kp3+1,j] <- gqtest(mylm, point=mypoint, alternative=myalt)$p.value
}
if (gqarr[mypoint-kp3+1,2] < 0.01) numsignificant1 <- numsignificant1 + 1
if (gqarr[mypoint-kp3+1,2] < 0.05) numsignificant5 <- numsignificant5 + 1
if (gqarr[mypoint-kp3+1,2] < 0.10) numsignificant10 <- numsignificant10 + 1
}
gqarr
}
bitmap(file='test0.png')
plot(x[,1], type='l', main='Actuals and Interpolation', ylab='value of Actuals and Interpolation (dots)', xlab='time or index')
points(x[,1]-mysum$resid)
grid()
dev.off()
bitmap(file='test1.png')
plot(mysum$resid, type='b', pch=19, main='Residuals', ylab='value of Residuals', xlab='time or index')
grid()
dev.off()
bitmap(file='test2.png')
hist(mysum$resid, main='Residual Histogram', xlab='values of Residuals')
grid()
dev.off()
bitmap(file='test3.png')
densityplot(~mysum$resid,col='black',main='Residual Density Plot', xlab='values of Residuals')
dev.off()
bitmap(file='test4.png')
qqnorm(mysum$resid, main='Residual Normal Q-Q Plot')
qqline(mysum$resid)
grid()
dev.off()
(myerror <- as.ts(mysum$resid))
bitmap(file='test5.png')
dum <- cbind(lag(myerror,k=1),myerror)
dum
dum1 <- dum[2:length(myerror),]
dum1
z <- as.data.frame(dum1)
z
plot(z,main=paste('Residual Lag plot, lowess, and regression line'), ylab='values of Residuals', xlab='lagged values of Residuals')
lines(lowess(z))
abline(lm(z))
grid()
dev.off()
bitmap(file='test6.png')
acf(mysum$resid, lag.max=length(mysum$resid)/2, main='Residual Autocorrelation Function')
grid()
dev.off()
bitmap(file='test7.png')
pacf(mysum$resid, lag.max=length(mysum$resid)/2, main='Residual Partial Autocorrelation Function')
grid()
dev.off()
bitmap(file='test8.png')
opar <- par(mfrow = c(2,2), oma = c(0, 0, 1.1, 0))
plot(mylm, las = 1, sub='Residual Diagnostics')
par(opar)
dev.off()
if (n > n25) {
bitmap(file='test9.png')
plot(kp3:nmkm3,gqarr[,2], main='Goldfeld-Quandt test',ylab='2-sided p-value',xlab='breakpoint')
grid()
dev.off()
}
load(file='createtable')
a<-table.start()
a<-table.row.start(a)
a<-table.element(a, 'Multiple Linear Regression - Estimated Regression Equation', 1, TRUE)
a<-table.row.end(a)
myeq <- colnames(x)[1]
myeq <- paste(myeq, '[t] = ', sep='')
for (i in 1:k){
if (mysum$coefficients[i,1] > 0) myeq <- paste(myeq, '+', '')
myeq <- paste(myeq, mysum$coefficients[i,1], sep=' ')
if (rownames(mysum$coefficients)[i] != '(Intercept)') {
myeq <- paste(myeq, rownames(mysum$coefficients)[i], sep='')
if (rownames(mysum$coefficients)[i] != 't') myeq <- paste(myeq, '[t]', sep='')
}
}
myeq <- paste(myeq, ' + e[t]')
a<-table.row.start(a)
a<-table.element(a, myeq)
a<-table.row.end(a)
a<-table.end(a)
table.save(a,file='mytable1.tab')
a<-table.start()
a<-table.row.start(a)
a<-table.element(a,hyperlink('ols1.htm','Multiple Linear Regression - Ordinary Least Squares',''), 6, TRUE)
a<-table.row.end(a)
a<-table.row.start(a)
a<-table.element(a,'Variable',header=TRUE)
a<-table.element(a,'Parameter',header=TRUE)
a<-table.element(a,'S.D.',header=TRUE)
a<-table.element(a,'T-STAT
H0: parameter = 0',header=TRUE)
a<-table.element(a,'2-tail p-value',header=TRUE)
a<-table.element(a,'1-tail p-value',header=TRUE)
a<-table.row.end(a)
for (i in 1:k){
a<-table.row.start(a)
a<-table.element(a,rownames(mysum$coefficients)[i],header=TRUE)
a<-table.element(a,mysum$coefficients[i,1])
a<-table.element(a, round(mysum$coefficients[i,2],6))
a<-table.element(a, round(mysum$coefficients[i,3],4))
a<-table.element(a, round(mysum$coefficients[i,4],6))
a<-table.element(a, round(mysum$coefficients[i,4]/2,6))
a<-table.row.end(a)
}
a<-table.end(a)
table.save(a,file='mytable2.tab')
a<-table.start()
a<-table.row.start(a)
a<-table.element(a, 'Multiple Linear Regression - Regression Statistics', 2, TRUE)
a<-table.row.end(a)
a<-table.row.start(a)
a<-table.element(a, 'Multiple R',1,TRUE)
a<-table.element(a, sqrt(mysum$r.squared))
a<-table.row.end(a)
a<-table.row.start(a)
a<-table.element(a, 'R-squared',1,TRUE)
a<-table.element(a, mysum$r.squared)
a<-table.row.end(a)
a<-table.row.start(a)
a<-table.element(a, 'Adjusted R-squared',1,TRUE)
a<-table.element(a, mysum$adj.r.squared)
a<-table.row.end(a)
a<-table.row.start(a)
a<-table.element(a, 'F-TEST (value)',1,TRUE)
a<-table.element(a, mysum$fstatistic[1])
a<-table.row.end(a)
a<-table.row.start(a)
a<-table.element(a, 'F-TEST (DF numerator)',1,TRUE)
a<-table.element(a, mysum$fstatistic[2])
a<-table.row.end(a)
a<-table.row.start(a)
a<-table.element(a, 'F-TEST (DF denominator)',1,TRUE)
a<-table.element(a, mysum$fstatistic[3])
a<-table.row.end(a)
a<-table.row.start(a)
a<-table.element(a, 'p-value',1,TRUE)
a<-table.element(a, 1-pf(mysum$fstatistic[1],mysum$fstatistic[2],mysum$fstatistic[3]))
a<-table.row.end(a)
a<-table.row.start(a)
a<-table.element(a, 'Multiple Linear Regression - Residual Statistics', 2, TRUE)
a<-table.row.end(a)
a<-table.row.start(a)
a<-table.element(a, 'Residual Standard Deviation',1,TRUE)
a<-table.element(a, mysum$sigma)
a<-table.row.end(a)
a<-table.row.start(a)
a<-table.element(a, 'Sum Squared Residuals',1,TRUE)
a<-table.element(a, sum(myerror*myerror))
a<-table.row.end(a)
a<-table.end(a)
table.save(a,file='mytable3.tab')
a<-table.start()
a<-table.row.start(a)
a<-table.element(a, 'Multiple Linear Regression - Actuals, Interpolation, and Residuals', 4, TRUE)
a<-table.row.end(a)
a<-table.row.start(a)
a<-table.element(a, 'Time or Index', 1, TRUE)
a<-table.element(a, 'Actuals', 1, TRUE)
a<-table.element(a, 'Interpolation
Forecast', 1, TRUE)
a<-table.element(a, 'Residuals
Prediction Error', 1, TRUE)
a<-table.row.end(a)
for (i in 1:n) {
a<-table.row.start(a)
a<-table.element(a,i, 1, TRUE)
a<-table.element(a,x[i])
a<-table.element(a,x[i]-mysum$resid[i])
a<-table.element(a,mysum$resid[i])
a<-table.row.end(a)
}
a<-table.end(a)
table.save(a,file='mytable4.tab')
if (n > n25) {
a<-table.start()
a<-table.row.start(a)
a<-table.element(a,'Goldfeld-Quandt test for Heteroskedasticity',4,TRUE)
a<-table.row.end(a)
a<-table.row.start(a)
a<-table.element(a,'p-values',header=TRUE)
a<-table.element(a,'Alternative Hypothesis',3,header=TRUE)
a<-table.row.end(a)
a<-table.row.start(a)
a<-table.element(a,'breakpoint index',header=TRUE)
a<-table.element(a,'greater',header=TRUE)
a<-table.element(a,'2-sided',header=TRUE)
a<-table.element(a,'less',header=TRUE)
a<-table.row.end(a)
for (mypoint in kp3:nmkm3) {
a<-table.row.start(a)
a<-table.element(a,mypoint,header=TRUE)
a<-table.element(a,gqarr[mypoint-kp3+1,1])
a<-table.element(a,gqarr[mypoint-kp3+1,2])
a<-table.element(a,gqarr[mypoint-kp3+1,3])
a<-table.row.end(a)
}
a<-table.end(a)
table.save(a,file='mytable5.tab')
a<-table.start()
a<-table.row.start(a)
a<-table.element(a,'Meta Analysis of Goldfeld-Quandt test for Heteroskedasticity',4,TRUE)
a<-table.row.end(a)
a<-table.row.start(a)
a<-table.element(a,'Description',header=TRUE)
a<-table.element(a,'# significant tests',header=TRUE)
a<-table.element(a,'% significant tests',header=TRUE)
a<-table.element(a,'OK/NOK',header=TRUE)
a<-table.row.end(a)
a<-table.row.start(a)
a<-table.element(a,'1% type I error level',header=TRUE)
a<-table.element(a,numsignificant1)
a<-table.element(a,numsignificant1/numgqtests)
if (numsignificant1/numgqtests < 0.01) dum <- 'OK' else dum <- 'NOK'
a<-table.element(a,dum)
a<-table.row.end(a)
a<-table.row.start(a)
a<-table.element(a,'5% type I error level',header=TRUE)
a<-table.element(a,numsignificant5)
a<-table.element(a,numsignificant5/numgqtests)
if (numsignificant5/numgqtests < 0.05) dum <- 'OK' else dum <- 'NOK'
a<-table.element(a,dum)
a<-table.row.end(a)
a<-table.row.start(a)
a<-table.element(a,'10% type I error level',header=TRUE)
a<-table.element(a,numsignificant10)
a<-table.element(a,numsignificant10/numgqtests)
if (numsignificant10/numgqtests < 0.1) dum <- 'OK' else dum <- 'NOK'
a<-table.element(a,dum)
a<-table.row.end(a)
a<-table.end(a)
table.save(a,file='mytable6.tab')
}