Free Statistics

of Irreproducible Research!

Author's title

Author*The author of this computation has been verified*
R Software Modulerwasp_arimaforecasting.wasp
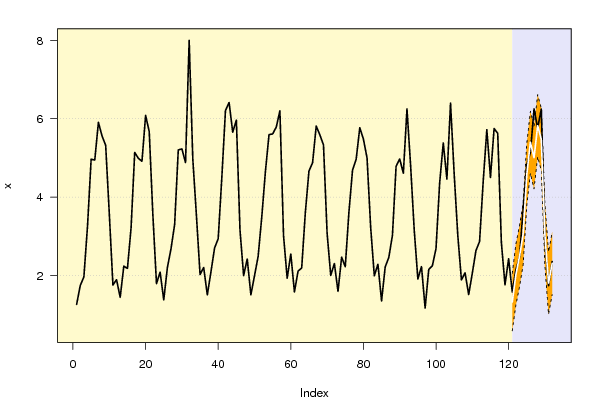
Title produced by softwareARIMA Forecasting
Date of computationThu, 15 Dec 2011 13:59:44 -0500
Cite this page as followsStatistical Computations at FreeStatistics.org, Office for Research Development and Education, URL https://freestatistics.org/blog/index.php?v=date/2011/Dec/15/t1323975599181cgz9vwxe91pg.htm/, Retrieved Wed, 08 May 2024 08:22:09 +0000
Statistical Computations at FreeStatistics.org, Office for Research Development and Education, URL https://freestatistics.org/blog/index.php?pk=155646, Retrieved Wed, 08 May 2024 08:22:09 +0000
QR Codes:

Original text written by user:
IsPrivate?No (this computation is public)
User-defined keywords
Estimated Impact99
Family? (F = Feedback message, R = changed R code, M = changed R Module, P = changed Parameters, D = changed Data)
-       [ARIMA Forecasting] [] [2011-12-15 18:59:44] [ff205c8f94ca61ac7cf7eb30cad83105] [Current]
-    D    [ARIMA Forecasting] [] [2011-12-23 10:42:38] [80bca13c5f9401fbb753952fd2952f4a]
-   PD    [ARIMA Forecasting] [Arima Forecasting] [2011-12-23 15:09:17] [19d77e37efa419fdc040c74a96874aff]
Feedback Forum

Post a new message
Dataseries X:
1.262
1.743
1.964
3.258
4.966
4.944
5.907
5.561
5.321
3.582
1.757
1.894
1.442
2.238
2.179
3.218
5.139
4.990
4.914
6.084
5.672
3.548
1.793
2.086
1.376
2.202
2.683
3.303
5.202
5.231
4.880
7.998
4.977
3.531
2.025
2.205
1.504
2.090
2.702
2.939
4.500
6.208
6.415
5.657
5.964
3.163
1.997
2.422
1.507
1.992
2.487
3.490
4.647
5.594
5.611
5.788
6.204
3.013
1.931
2.549
1.580
2.111
2.192
3.601
4.665
4.876
5.813
5.589
5.331
3.075
2.002
2.306
1.594
2.467
2.222
3.607
4.685
4.962
5.770
5.480
5.000
3.228
1.993
2.288
1.351
2.218
2.461
3.028
4.784
4.975
4.607
6.249
4.809
3.157
1.910
2.228
1.169
2.154
2.249
2.687
4.359
5.382
4.459
6.398
4.596
3.024
1.887
2.070
1.511
2.059
2.635
2.867
4.403
5.720
4.502
5.749
5.627
2.846
1.762
2.429
1.579
2.146
2.462
3.695
4.831
5.134
6.250
5.760
6.249
2.917
1.741
2.359


Summary of computational transaction
Raw Inputview raw input (R code)
Raw Outputview raw output of R engine
Computing time5 seconds
R Server'AstonUniversity' @ aston.wessa.net

\begin{tabular}{lllllllll}
\hline
Summary of computational transaction \tabularnewline
Raw Input & view raw input (R code)  \tabularnewline
Raw Output & view raw output of R engine  \tabularnewline
Computing time & 5 seconds \tabularnewline
R Server & 'AstonUniversity' @ aston.wessa.net \tabularnewline
\hline
\end{tabular}
%Source: https://freestatistics.org/blog/index.php?pk=155646&T=0

[TABLE]
[ROW][C]Summary of computational transaction[/C][/ROW]
[ROW][C]Raw Input[/C][C]view raw input (R code) [/C][/ROW]
[ROW][C]Raw Output[/C][C]view raw output of R engine [/C][/ROW]
[ROW][C]Computing time[/C][C]5 seconds[/C][/ROW]
[ROW][C]R Server[/C][C]'AstonUniversity' @ aston.wessa.net[/C][/ROW]
[/TABLE]
Source: https://freestatistics.org/blog/index.php?pk=155646&T=0

Globally Unique Identifier (entire table): ba.freestatistics.org/blog/index.php?pk=155646&T=0

As an alternative you can also use a QR Code:  

The GUIDs for individual cells are displayed in the table below:

Summary of computational transaction
Raw Inputview raw input (R code)
Raw Outputview raw output of R engine
Computing time5 seconds
R Server'AstonUniversity' @ aston.wessa.net


Univariate ARIMA Extrapolation Forecast
timeY[t]F[t]95% LB95% UBp-value(H0: Y[t] = F[t])P(F[t]>Y[t-1])P(F[t]>Y[t-s])P(F[t]>Y[120])
1082.07-------
1091.511-------
1102.059-------
1112.635-------
1122.867-------
1134.403-------
1145.72-------
1154.502-------
1165.749-------
1175.627-------
1182.846-------
1191.762-------
1202.429-------
1211.5791.32040.58892.0520.24420.00150.30480.0015
1222.1462.02281.24552.80020.37810.86840.46370.1529
1232.4622.49011.71273.26740.47180.80720.35740.5612
1243.6953.06022.26923.85110.05780.93090.68390.9411
1254.8314.57273.78185.36360.2610.98520.66291
1265.1345.3994.60766.19050.25580.92030.21331
1276.255.0044.21085.79720.0010.3740.89261
1285.765.82185.02796.61570.43940.14520.57131
1296.2495.47354.67896.26810.02790.23990.35251
1302.9173.02732.23183.82270.392900.67240.9298
1311.7411.80631.01012.60240.43620.00310.54340.0626
1322.3592.31091.51433.10760.45290.91960.38570.3857

\begin{tabular}{lllllllll}
\hline
Univariate ARIMA Extrapolation Forecast \tabularnewline
time & Y[t] & F[t] & 95% LB & 95% UB & p-value(H0: Y[t] = F[t]) & P(F[t]>Y[t-1]) & P(F[t]>Y[t-s]) & P(F[t]>Y[120]) \tabularnewline
108 & 2.07 & - & - & - & - & - & - & - \tabularnewline
109 & 1.511 & - & - & - & - & - & - & - \tabularnewline
110 & 2.059 & - & - & - & - & - & - & - \tabularnewline
111 & 2.635 & - & - & - & - & - & - & - \tabularnewline
112 & 2.867 & - & - & - & - & - & - & - \tabularnewline
113 & 4.403 & - & - & - & - & - & - & - \tabularnewline
114 & 5.72 & - & - & - & - & - & - & - \tabularnewline
115 & 4.502 & - & - & - & - & - & - & - \tabularnewline
116 & 5.749 & - & - & - & - & - & - & - \tabularnewline
117 & 5.627 & - & - & - & - & - & - & - \tabularnewline
118 & 2.846 & - & - & - & - & - & - & - \tabularnewline
119 & 1.762 & - & - & - & - & - & - & - \tabularnewline
120 & 2.429 & - & - & - & - & - & - & - \tabularnewline
121 & 1.579 & 1.3204 & 0.5889 & 2.052 & 0.2442 & 0.0015 & 0.3048 & 0.0015 \tabularnewline
122 & 2.146 & 2.0228 & 1.2455 & 2.8002 & 0.3781 & 0.8684 & 0.4637 & 0.1529 \tabularnewline
123 & 2.462 & 2.4901 & 1.7127 & 3.2674 & 0.4718 & 0.8072 & 0.3574 & 0.5612 \tabularnewline
124 & 3.695 & 3.0602 & 2.2692 & 3.8511 & 0.0578 & 0.9309 & 0.6839 & 0.9411 \tabularnewline
125 & 4.831 & 4.5727 & 3.7818 & 5.3636 & 0.261 & 0.9852 & 0.6629 & 1 \tabularnewline
126 & 5.134 & 5.399 & 4.6076 & 6.1905 & 0.2558 & 0.9203 & 0.2133 & 1 \tabularnewline
127 & 6.25 & 5.004 & 4.2108 & 5.7972 & 0.001 & 0.374 & 0.8926 & 1 \tabularnewline
128 & 5.76 & 5.8218 & 5.0279 & 6.6157 & 0.4394 & 0.1452 & 0.5713 & 1 \tabularnewline
129 & 6.249 & 5.4735 & 4.6789 & 6.2681 & 0.0279 & 0.2399 & 0.3525 & 1 \tabularnewline
130 & 2.917 & 3.0273 & 2.2318 & 3.8227 & 0.3929 & 0 & 0.6724 & 0.9298 \tabularnewline
131 & 1.741 & 1.8063 & 1.0101 & 2.6024 & 0.4362 & 0.0031 & 0.5434 & 0.0626 \tabularnewline
132 & 2.359 & 2.3109 & 1.5143 & 3.1076 & 0.4529 & 0.9196 & 0.3857 & 0.3857 \tabularnewline
\hline
\end{tabular}
%Source: https://freestatistics.org/blog/index.php?pk=155646&T=1

[TABLE]
[ROW][C]Univariate ARIMA Extrapolation Forecast[/C][/ROW]
[ROW][C]time[/C][C]Y[t][/C][C]F[t][/C][C]95% LB[/C][C]95% UB[/C][C]p-value(H0: Y[t] = F[t])[/C][C]P(F[t]>Y[t-1])[/C][C]P(F[t]>Y[t-s])[/C][C]P(F[t]>Y[120])[/C][/ROW]
[ROW][C]108[/C][C]2.07[/C][C]-[/C][C]-[/C][C]-[/C][C]-[/C][C]-[/C][C]-[/C][C]-[/C][/ROW]
[ROW][C]109[/C][C]1.511[/C][C]-[/C][C]-[/C][C]-[/C][C]-[/C][C]-[/C][C]-[/C][C]-[/C][/ROW]
[ROW][C]110[/C][C]2.059[/C][C]-[/C][C]-[/C][C]-[/C][C]-[/C][C]-[/C][C]-[/C][C]-[/C][/ROW]
[ROW][C]111[/C][C]2.635[/C][C]-[/C][C]-[/C][C]-[/C][C]-[/C][C]-[/C][C]-[/C][C]-[/C][/ROW]
[ROW][C]112[/C][C]2.867[/C][C]-[/C][C]-[/C][C]-[/C][C]-[/C][C]-[/C][C]-[/C][C]-[/C][/ROW]
[ROW][C]113[/C][C]4.403[/C][C]-[/C][C]-[/C][C]-[/C][C]-[/C][C]-[/C][C]-[/C][C]-[/C][/ROW]
[ROW][C]114[/C][C]5.72[/C][C]-[/C][C]-[/C][C]-[/C][C]-[/C][C]-[/C][C]-[/C][C]-[/C][/ROW]
[ROW][C]115[/C][C]4.502[/C][C]-[/C][C]-[/C][C]-[/C][C]-[/C][C]-[/C][C]-[/C][C]-[/C][/ROW]
[ROW][C]116[/C][C]5.749[/C][C]-[/C][C]-[/C][C]-[/C][C]-[/C][C]-[/C][C]-[/C][C]-[/C][/ROW]
[ROW][C]117[/C][C]5.627[/C][C]-[/C][C]-[/C][C]-[/C][C]-[/C][C]-[/C][C]-[/C][C]-[/C][/ROW]
[ROW][C]118[/C][C]2.846[/C][C]-[/C][C]-[/C][C]-[/C][C]-[/C][C]-[/C][C]-[/C][C]-[/C][/ROW]
[ROW][C]119[/C][C]1.762[/C][C]-[/C][C]-[/C][C]-[/C][C]-[/C][C]-[/C][C]-[/C][C]-[/C][/ROW]
[ROW][C]120[/C][C]2.429[/C][C]-[/C][C]-[/C][C]-[/C][C]-[/C][C]-[/C][C]-[/C][C]-[/C][/ROW]
[ROW][C]121[/C][C]1.579[/C][C]1.3204[/C][C]0.5889[/C][C]2.052[/C][C]0.2442[/C][C]0.0015[/C][C]0.3048[/C][C]0.0015[/C][/ROW]
[ROW][C]122[/C][C]2.146[/C][C]2.0228[/C][C]1.2455[/C][C]2.8002[/C][C]0.3781[/C][C]0.8684[/C][C]0.4637[/C][C]0.1529[/C][/ROW]
[ROW][C]123[/C][C]2.462[/C][C]2.4901[/C][C]1.7127[/C][C]3.2674[/C][C]0.4718[/C][C]0.8072[/C][C]0.3574[/C][C]0.5612[/C][/ROW]
[ROW][C]124[/C][C]3.695[/C][C]3.0602[/C][C]2.2692[/C][C]3.8511[/C][C]0.0578[/C][C]0.9309[/C][C]0.6839[/C][C]0.9411[/C][/ROW]
[ROW][C]125[/C][C]4.831[/C][C]4.5727[/C][C]3.7818[/C][C]5.3636[/C][C]0.261[/C][C]0.9852[/C][C]0.6629[/C][C]1[/C][/ROW]
[ROW][C]126[/C][C]5.134[/C][C]5.399[/C][C]4.6076[/C][C]6.1905[/C][C]0.2558[/C][C]0.9203[/C][C]0.2133[/C][C]1[/C][/ROW]
[ROW][C]127[/C][C]6.25[/C][C]5.004[/C][C]4.2108[/C][C]5.7972[/C][C]0.001[/C][C]0.374[/C][C]0.8926[/C][C]1[/C][/ROW]
[ROW][C]128[/C][C]5.76[/C][C]5.8218[/C][C]5.0279[/C][C]6.6157[/C][C]0.4394[/C][C]0.1452[/C][C]0.5713[/C][C]1[/C][/ROW]
[ROW][C]129[/C][C]6.249[/C][C]5.4735[/C][C]4.6789[/C][C]6.2681[/C][C]0.0279[/C][C]0.2399[/C][C]0.3525[/C][C]1[/C][/ROW]
[ROW][C]130[/C][C]2.917[/C][C]3.0273[/C][C]2.2318[/C][C]3.8227[/C][C]0.3929[/C][C]0[/C][C]0.6724[/C][C]0.9298[/C][/ROW]
[ROW][C]131[/C][C]1.741[/C][C]1.8063[/C][C]1.0101[/C][C]2.6024[/C][C]0.4362[/C][C]0.0031[/C][C]0.5434[/C][C]0.0626[/C][/ROW]
[ROW][C]132[/C][C]2.359[/C][C]2.3109[/C][C]1.5143[/C][C]3.1076[/C][C]0.4529[/C][C]0.9196[/C][C]0.3857[/C][C]0.3857[/C][/ROW]
[/TABLE]
Source: https://freestatistics.org/blog/index.php?pk=155646&T=1

Globally Unique Identifier (entire table): ba.freestatistics.org/blog/index.php?pk=155646&T=1

As an alternative you can also use a QR Code:  

The GUIDs for individual cells are displayed in the table below:

Univariate ARIMA Extrapolation Forecast
timeY[t]F[t]95% LB95% UBp-value(H0: Y[t] = F[t])P(F[t]>Y[t-1])P(F[t]>Y[t-s])P(F[t]>Y[120])
1082.07-------
1091.511-------
1102.059-------
1112.635-------
1122.867-------
1134.403-------
1145.72-------
1154.502-------
1165.749-------
1175.627-------
1182.846-------
1191.762-------
1202.429-------
1211.5791.32040.58892.0520.24420.00150.30480.0015
1222.1462.02281.24552.80020.37810.86840.46370.1529
1232.4622.49011.71273.26740.47180.80720.35740.5612
1243.6953.06022.26923.85110.05780.93090.68390.9411
1254.8314.57273.78185.36360.2610.98520.66291
1265.1345.3994.60766.19050.25580.92030.21331
1276.255.0044.21085.79720.0010.3740.89261
1285.765.82185.02796.61570.43940.14520.57131
1296.2495.47354.67896.26810.02790.23990.35251
1302.9173.02732.23183.82270.392900.67240.9298
1311.7411.80631.01012.60240.43620.00310.54340.0626
1322.3592.31091.51433.10760.45290.91960.38570.3857


Univariate ARIMA Extrapolation Forecast Performance
time% S.E.PEMAPESq.EMSERMSE
1210.28270.195800.066800
1220.19610.06090.12830.01520.0410.2025
1230.1593-0.01130.08938e-040.02760.1661
1240.13190.20750.11890.4030.12150.3485
1250.08820.05650.10640.06670.11050.3324
1260.0748-0.04910.09680.07030.10380.3222
1270.08090.2490.11861.55240.31080.5575
1280.0696-0.01060.10510.00380.27240.5219
1290.07410.14170.10910.60140.30890.5558
1300.1341-0.03640.10190.01220.27930.5285
1310.2249-0.03610.09590.00430.25430.5042
1320.17590.02080.08960.00230.23330.483

\begin{tabular}{lllllllll}
\hline
Univariate ARIMA Extrapolation Forecast Performance \tabularnewline
time & % S.E. & PE & MAPE & Sq.E & MSE & RMSE \tabularnewline
121 & 0.2827 & 0.1958 & 0 & 0.0668 & 0 & 0 \tabularnewline
122 & 0.1961 & 0.0609 & 0.1283 & 0.0152 & 0.041 & 0.2025 \tabularnewline
123 & 0.1593 & -0.0113 & 0.0893 & 8e-04 & 0.0276 & 0.1661 \tabularnewline
124 & 0.1319 & 0.2075 & 0.1189 & 0.403 & 0.1215 & 0.3485 \tabularnewline
125 & 0.0882 & 0.0565 & 0.1064 & 0.0667 & 0.1105 & 0.3324 \tabularnewline
126 & 0.0748 & -0.0491 & 0.0968 & 0.0703 & 0.1038 & 0.3222 \tabularnewline
127 & 0.0809 & 0.249 & 0.1186 & 1.5524 & 0.3108 & 0.5575 \tabularnewline
128 & 0.0696 & -0.0106 & 0.1051 & 0.0038 & 0.2724 & 0.5219 \tabularnewline
129 & 0.0741 & 0.1417 & 0.1091 & 0.6014 & 0.3089 & 0.5558 \tabularnewline
130 & 0.1341 & -0.0364 & 0.1019 & 0.0122 & 0.2793 & 0.5285 \tabularnewline
131 & 0.2249 & -0.0361 & 0.0959 & 0.0043 & 0.2543 & 0.5042 \tabularnewline
132 & 0.1759 & 0.0208 & 0.0896 & 0.0023 & 0.2333 & 0.483 \tabularnewline
\hline
\end{tabular}
%Source: https://freestatistics.org/blog/index.php?pk=155646&T=2

[TABLE]
[ROW][C]Univariate ARIMA Extrapolation Forecast Performance[/C][/ROW]
[ROW][C]time[/C][C]% S.E.[/C][C]PE[/C][C]MAPE[/C][C]Sq.E[/C][C]MSE[/C][C]RMSE[/C][/ROW]
[ROW][C]121[/C][C]0.2827[/C][C]0.1958[/C][C]0[/C][C]0.0668[/C][C]0[/C][C]0[/C][/ROW]
[ROW][C]122[/C][C]0.1961[/C][C]0.0609[/C][C]0.1283[/C][C]0.0152[/C][C]0.041[/C][C]0.2025[/C][/ROW]
[ROW][C]123[/C][C]0.1593[/C][C]-0.0113[/C][C]0.0893[/C][C]8e-04[/C][C]0.0276[/C][C]0.1661[/C][/ROW]
[ROW][C]124[/C][C]0.1319[/C][C]0.2075[/C][C]0.1189[/C][C]0.403[/C][C]0.1215[/C][C]0.3485[/C][/ROW]
[ROW][C]125[/C][C]0.0882[/C][C]0.0565[/C][C]0.1064[/C][C]0.0667[/C][C]0.1105[/C][C]0.3324[/C][/ROW]
[ROW][C]126[/C][C]0.0748[/C][C]-0.0491[/C][C]0.0968[/C][C]0.0703[/C][C]0.1038[/C][C]0.3222[/C][/ROW]
[ROW][C]127[/C][C]0.0809[/C][C]0.249[/C][C]0.1186[/C][C]1.5524[/C][C]0.3108[/C][C]0.5575[/C][/ROW]
[ROW][C]128[/C][C]0.0696[/C][C]-0.0106[/C][C]0.1051[/C][C]0.0038[/C][C]0.2724[/C][C]0.5219[/C][/ROW]
[ROW][C]129[/C][C]0.0741[/C][C]0.1417[/C][C]0.1091[/C][C]0.6014[/C][C]0.3089[/C][C]0.5558[/C][/ROW]
[ROW][C]130[/C][C]0.1341[/C][C]-0.0364[/C][C]0.1019[/C][C]0.0122[/C][C]0.2793[/C][C]0.5285[/C][/ROW]
[ROW][C]131[/C][C]0.2249[/C][C]-0.0361[/C][C]0.0959[/C][C]0.0043[/C][C]0.2543[/C][C]0.5042[/C][/ROW]
[ROW][C]132[/C][C]0.1759[/C][C]0.0208[/C][C]0.0896[/C][C]0.0023[/C][C]0.2333[/C][C]0.483[/C][/ROW]
[/TABLE]
Source: https://freestatistics.org/blog/index.php?pk=155646&T=2

Globally Unique Identifier (entire table): ba.freestatistics.org/blog/index.php?pk=155646&T=2

As an alternative you can also use a QR Code:  

The GUIDs for individual cells are displayed in the table below:

Univariate ARIMA Extrapolation Forecast Performance
time% S.E.PEMAPESq.EMSERMSE
1210.28270.195800.066800
1220.19610.06090.12830.01520.0410.2025
1230.1593-0.01130.08938e-040.02760.1661
1240.13190.20750.11890.4030.12150.3485
1250.08820.05650.10640.06670.11050.3324
1260.0748-0.04910.09680.07030.10380.3222
1270.08090.2490.11861.55240.31080.5575
1280.0696-0.01060.10510.00380.27240.5219
1290.07410.14170.10910.60140.30890.5558
1300.1341-0.03640.10190.01220.27930.5285
1310.2249-0.03610.09590.00430.25430.5042
1320.17590.02080.08960.00230.23330.483


Parameters (Session):
par1 = 12 ; par2 = 1 ; par3 = 0 ; par4 = 1 ; par5 = 12 ; par6 = 3 ; par7 = 1 ; par8 = 2 ; par9 = 1 ; par10 = FALSE ;
Parameters (R input):
par1 = 12 ; par2 = 1 ; par3 = 0 ; par4 = 1 ; par5 = 12 ; par6 = 3 ; par7 = 1 ; par8 = 2 ; par9 = 1 ; par10 = FALSE ;
R code (references can be found in the software module):
par1 <- as.numeric(par1) #cut off periods
par2 <- as.numeric(par2) #lambda
par3 <- as.numeric(par3) #degree of non-seasonal differencing
par4 <- as.numeric(par4) #degree of seasonal differencing
par5 <- as.numeric(par5) #seasonal period
par6 <- as.numeric(par6) #p
par7 <- as.numeric(par7) #q
par8 <- as.numeric(par8) #P
par9 <- as.numeric(par9) #Q
if (par10 == 'TRUE') par10 <- TRUE
if (par10 == 'FALSE') par10 <- FALSE
if (par2 == 0) x <- log(x)
if (par2 != 0) x <- x^par2
lx <- length(x)
first <- lx - 2*par1
nx <- lx - par1
nx1 <- nx + 1
fx <- lx - nx
if (fx < 1) {
fx <- par5
nx1 <- lx + fx - 1
first <- lx - 2*fx
}
first <- 1
if (fx < 3) fx <- round(lx/10,0)
(arima.out <- arima(x[1:nx], order=c(par6,par3,par7), seasonal=list(order=c(par8,par4,par9), period=par5), include.mean=par10, method='ML'))
(forecast <- predict(arima.out,par1))
(lb <- forecast$pred - 1.96 * forecast$se)
(ub <- forecast$pred + 1.96 * forecast$se)
if (par2 == 0) {
x <- exp(x)
forecast$pred <- exp(forecast$pred)
lb <- exp(lb)
ub <- exp(ub)
}
if (par2 != 0) {
x <- x^(1/par2)
forecast$pred <- forecast$pred^(1/par2)
lb <- lb^(1/par2)
ub <- ub^(1/par2)
}
if (par2 < 0) {
olb <- lb
lb <- ub
ub <- olb
}
(actandfor <- c(x[1:nx], forecast$pred))
(perc.se <- (ub-forecast$pred)/1.96/forecast$pred)
bitmap(file='test1.png')
opar <- par(mar=c(4,4,2,2),las=1)
ylim <- c( min(x[first:nx],lb), max(x[first:nx],ub))
plot(x,ylim=ylim,type='n',xlim=c(first,lx))
usr <- par('usr')
rect(usr[1],usr[3],nx+1,usr[4],border=NA,col='lemonchiffon')
rect(nx1,usr[3],usr[2],usr[4],border=NA,col='lavender')
abline(h= (-3:3)*2 , col ='gray', lty =3)
polygon( c(nx1:lx,lx:nx1), c(lb,rev(ub)), col = 'orange', lty=2,border=NA)
lines(nx1:lx, lb , lty=2)
lines(nx1:lx, ub , lty=2)
lines(x, lwd=2)
lines(nx1:lx, forecast$pred , lwd=2 , col ='white')
box()
par(opar)
dev.off()
prob.dec <- array(NA, dim=fx)
prob.sdec <- array(NA, dim=fx)
prob.ldec <- array(NA, dim=fx)
prob.pval <- array(NA, dim=fx)
perf.pe <- array(0, dim=fx)
perf.mape <- array(0, dim=fx)
perf.mape1 <- array(0, dim=fx)
perf.se <- array(0, dim=fx)
perf.mse <- array(0, dim=fx)
perf.mse1 <- array(0, dim=fx)
perf.rmse <- array(0, dim=fx)
for (i in 1:fx) {
locSD <- (ub[i] - forecast$pred[i]) / 1.96
perf.pe[i] = (x[nx+i] - forecast$pred[i]) / forecast$pred[i]
perf.se[i] = (x[nx+i] - forecast$pred[i])^2
prob.dec[i] = pnorm((x[nx+i-1] - forecast$pred[i]) / locSD)
prob.sdec[i] = pnorm((x[nx+i-par5] - forecast$pred[i]) / locSD)
prob.ldec[i] = pnorm((x[nx] - forecast$pred[i]) / locSD)
prob.pval[i] = pnorm(abs(x[nx+i] - forecast$pred[i]) / locSD)
}
perf.mape[1] = abs(perf.pe[1])
perf.mse[1] = abs(perf.se[1])
for (i in 2:fx) {
perf.mape[i] = perf.mape[i-1] + abs(perf.pe[i])
perf.mape1[i] = perf.mape[i] / i
perf.mse[i] = perf.mse[i-1] + perf.se[i]
perf.mse1[i] = perf.mse[i] / i
}
perf.rmse = sqrt(perf.mse1)
bitmap(file='test2.png')
plot(forecast$pred, pch=19, type='b',main='ARIMA Extrapolation Forecast', ylab='Forecast and 95% CI', xlab='time',ylim=c(min(lb),max(ub)))
dum <- forecast$pred
dum[1:par1] <- x[(nx+1):lx]
lines(dum, lty=1)
lines(ub,lty=3)
lines(lb,lty=3)
dev.off()
load(file='createtable')
a<-table.start()
a<-table.row.start(a)
a<-table.element(a,'Univariate ARIMA Extrapolation Forecast',9,TRUE)
a<-table.row.end(a)
a<-table.row.start(a)
a<-table.element(a,'time',1,header=TRUE)
a<-table.element(a,'Y[t]',1,header=TRUE)
a<-table.element(a,'F[t]',1,header=TRUE)
a<-table.element(a,'95% LB',1,header=TRUE)
a<-table.element(a,'95% UB',1,header=TRUE)
a<-table.element(a,'p-value
(H0: Y[t] = F[t])',1,header=TRUE)
a<-table.element(a,'P(F[t]>Y[t-1])',1,header=TRUE)
a<-table.element(a,'P(F[t]>Y[t-s])',1,header=TRUE)
mylab <- paste('P(F[t]>Y[',nx,sep='')
mylab <- paste(mylab,'])',sep='')
a<-table.element(a,mylab,1,header=TRUE)
a<-table.row.end(a)
for (i in (nx-par5):nx) {
a<-table.row.start(a)
a<-table.element(a,i,header=TRUE)
a<-table.element(a,x[i])
a<-table.element(a,'-')
a<-table.row.end(a)
}
for (i in 1:fx) {
a<-table.row.start(a)
a<-table.element(a,nx+i,header=TRUE)
a<-table.element(a,round(x[nx+i],4))
a<-table.element(a,round(forecast$pred[i],4))
a<-table.element(a,round(lb[i],4))
a<-table.element(a,round(ub[i],4))
a<-table.element(a,round((1-prob.pval[i]),4))
a<-table.element(a,round((1-prob.dec[i]),4))
a<-table.element(a,round((1-prob.sdec[i]),4))
a<-table.element(a,round((1-prob.ldec[i]),4))
a<-table.row.end(a)
}
a<-table.end(a)
table.save(a,file='mytable.tab')
a<-table.start()
a<-table.row.start(a)
a<-table.element(a,'Univariate ARIMA Extrapolation Forecast Performance',7,TRUE)
a<-table.row.end(a)
a<-table.row.start(a)
a<-table.element(a,'time',1,header=TRUE)
a<-table.element(a,'% S.E.',1,header=TRUE)
a<-table.element(a,'PE',1,header=TRUE)
a<-table.element(a,'MAPE',1,header=TRUE)
a<-table.element(a,'Sq.E',1,header=TRUE)
a<-table.element(a,'MSE',1,header=TRUE)
a<-table.element(a,'RMSE',1,header=TRUE)
a<-table.row.end(a)
for (i in 1:fx) {
a<-table.row.start(a)
a<-table.element(a,nx+i,header=TRUE)
a<-table.element(a,round(perc.se[i],4))
a<-table.element(a,round(perf.pe[i],4))
a<-table.element(a,round(perf.mape1[i],4))
a<-table.element(a,round(perf.se[i],4))
a<-table.element(a,round(perf.mse1[i],4))
a<-table.element(a,round(perf.rmse[i],4))
a<-table.row.end(a)
}
a<-table.end(a)
table.save(a,file='mytable1.tab')