Free Statistics

of Irreproducible Research!

Author's title

Author*The author of this computation has been verified*
R Software Modulerwasp_arimaforecasting.wasp
Title produced by softwareARIMA Forecasting
Date of computationThu, 15 Dec 2011 13:32:05 -0500
Cite this page as followsStatistical Computations at FreeStatistics.org, Office for Research Development and Education, URL https://freestatistics.org/blog/index.php?v=date/2011/Dec/15/t1323973949pct5bxofk0yiq7t.htm/, Retrieved Wed, 08 May 2024 11:17:31 +0000
Statistical Computations at FreeStatistics.org, Office for Research Development and Education, URL https://freestatistics.org/blog/index.php?pk=155631, Retrieved Wed, 08 May 2024 11:17:31 +0000
QR Codes:

Original text written by user:
IsPrivate?No (this computation is public)
User-defined keywords
Estimated Impact113
Family? (F = Feedback message, R = changed R code, M = changed R Module, P = changed Parameters, D = changed Data)
-     [Kendall tau Correlation Matrix] [] [2010-12-05 17:44:33] [b98453cac15ba1066b407e146608df68]
- RMPD  [Kendall tau Correlation Matrix] [WS 10 - Pearson c...] [2010-12-10 16:13:49] [033eb2749a430605d9b2be7c4aac4a0c]
-         [Kendall tau Correlation Matrix] [] [2010-12-13 18:15:16] [d7b28a0391ab3b2ddc9f9fba95a43f33]
- RMPD      [ARIMA Forecasting] [] [2010-12-24 12:12:29] [b07cd1964830aab808142229b1166ece]
-   PD          [ARIMA Forecasting] [ARIMA forecast mo...] [2011-12-15 18:32:05] [0e2c18186cab982e7ba7b89fbe242e59] [Current]
Feedback Forum

Post a new message
Dataseries X:
1770
2203
2836
1976
2150
2180
2631
1781
2327
2260
2051
2250
2102
2957
2485
2871
2447
2570
2622
1840
2682
2369
2119
2531
2214
3206
2709
2734
2348
2702
2642
2064
2647
2534
2297
2718
2321
3112
2664
2808
2668
2934
2616
2228
2463
2416
2407
2582
2101
3305
2818
2401
3019
2507
2948
2210
2467
2596
2451
2233
2393
3122
2801
2656
2782
2604
2803
2178
2324
2536
2408
2261
2166
3243
2296
2719
2734
2297
2732
1904
2397
2473
1967
2471
2203
3053
2350
2807
2639
2646
2577
1860
2624
2590
2261
3342
2840
3328
3245
3025
2915
3579
2787
2397
3065
2154
2689
3187
2540
3469
3005
2573
2998
2768
2556
2414
2467
2136
2493
2735
2316
3042
2364
2248
2714
2583
2631
1965
2209
1964
2132


Summary of computational transaction
Raw Inputview raw input (R code)
Raw Outputview raw output of R engine
Computing time3 seconds
R Server'George Udny Yule' @ yule.wessa.net

\begin{tabular}{lllllllll}
\hline
Summary of computational transaction \tabularnewline
Raw Input & view raw input (R code)  \tabularnewline
Raw Output & view raw output of R engine  \tabularnewline
Computing time & 3 seconds \tabularnewline
R Server & 'George Udny Yule' @ yule.wessa.net \tabularnewline
\hline
\end{tabular}
%Source: https://freestatistics.org/blog/index.php?pk=155631&T=0

[TABLE]
[ROW][C]Summary of computational transaction[/C][/ROW]
[ROW][C]Raw Input[/C][C]view raw input (R code) [/C][/ROW]
[ROW][C]Raw Output[/C][C]view raw output of R engine [/C][/ROW]
[ROW][C]Computing time[/C][C]3 seconds[/C][/ROW]
[ROW][C]R Server[/C][C]'George Udny Yule' @ yule.wessa.net[/C][/ROW]
[/TABLE]
Source: https://freestatistics.org/blog/index.php?pk=155631&T=0

Globally Unique Identifier (entire table): ba.freestatistics.org/blog/index.php?pk=155631&T=0

As an alternative you can also use a QR Code:  

The GUIDs for individual cells are displayed in the table below:

Summary of computational transaction
Raw Inputview raw input (R code)
Raw Outputview raw output of R engine
Computing time3 seconds
R Server'George Udny Yule' @ yule.wessa.net


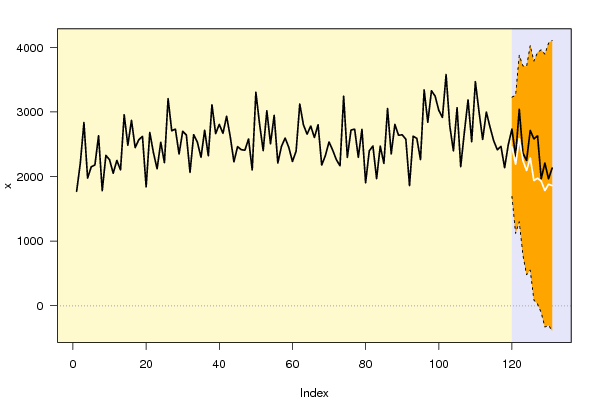
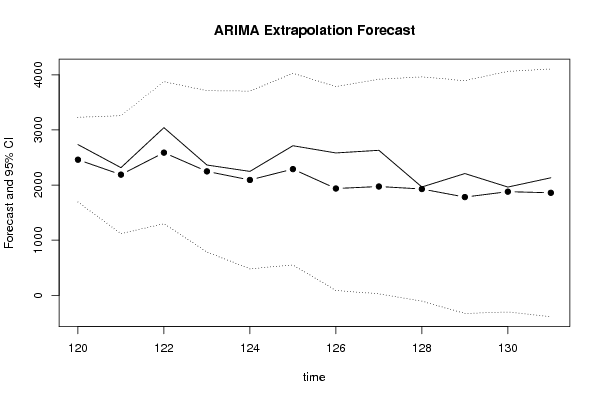
Univariate ARIMA Extrapolation Forecast
timeY[t]F[t]95% LB95% UBp-value(H0: Y[t] = F[t])P(F[t]>Y[t-1])P(F[t]>Y[t-s])P(F[t]>Y[119])
1072689-------
1083187-------
1092540-------
1103469-------
1113005-------
1122573-------
1132998-------
1142768-------
1152556-------
1162414-------
1172467-------
1182136-------
1192493-------
12027352460.32241691.30663229.33820.24190.46680.0320.4668
12123162189.05911119.15043258.96780.40810.15860.26010.2888
12230422588.55951299.21983877.89920.24530.66070.09040.5577
12323642248.349783.1643713.5340.43850.14420.15570.3717
12422482092.6463480.20723705.08550.42510.37080.27960.3133
12527142289.8269550.86674028.78710.31630.51880.21240.4094
12625831937.278987.76223786.79560.24690.20520.18930.278
12726311973.797626.51613921.07920.25410.26990.27890.3006
12819651928.4639-106.04013962.96790.4860.24930.320.2933
12922091782.2679-330.58633895.1220.34610.43270.26270.2548
13019641880.2824-303.33464063.89930.470.3840.40920.2912
13121321859.6296-388.1794107.43830.40610.46370.29040.2904

\begin{tabular}{lllllllll}
\hline
Univariate ARIMA Extrapolation Forecast \tabularnewline
time & Y[t] & F[t] & 95% LB & 95% UB & p-value(H0: Y[t] = F[t]) & P(F[t]>Y[t-1]) & P(F[t]>Y[t-s]) & P(F[t]>Y[119]) \tabularnewline
107 & 2689 & - & - & - & - & - & - & - \tabularnewline
108 & 3187 & - & - & - & - & - & - & - \tabularnewline
109 & 2540 & - & - & - & - & - & - & - \tabularnewline
110 & 3469 & - & - & - & - & - & - & - \tabularnewline
111 & 3005 & - & - & - & - & - & - & - \tabularnewline
112 & 2573 & - & - & - & - & - & - & - \tabularnewline
113 & 2998 & - & - & - & - & - & - & - \tabularnewline
114 & 2768 & - & - & - & - & - & - & - \tabularnewline
115 & 2556 & - & - & - & - & - & - & - \tabularnewline
116 & 2414 & - & - & - & - & - & - & - \tabularnewline
117 & 2467 & - & - & - & - & - & - & - \tabularnewline
118 & 2136 & - & - & - & - & - & - & - \tabularnewline
119 & 2493 & - & - & - & - & - & - & - \tabularnewline
120 & 2735 & 2460.3224 & 1691.3066 & 3229.3382 & 0.2419 & 0.4668 & 0.032 & 0.4668 \tabularnewline
121 & 2316 & 2189.0591 & 1119.1504 & 3258.9678 & 0.4081 & 0.1586 & 0.2601 & 0.2888 \tabularnewline
122 & 3042 & 2588.5595 & 1299.2198 & 3877.8992 & 0.2453 & 0.6607 & 0.0904 & 0.5577 \tabularnewline
123 & 2364 & 2248.349 & 783.164 & 3713.534 & 0.4385 & 0.1442 & 0.1557 & 0.3717 \tabularnewline
124 & 2248 & 2092.6463 & 480.2072 & 3705.0855 & 0.4251 & 0.3708 & 0.2796 & 0.3133 \tabularnewline
125 & 2714 & 2289.8269 & 550.8667 & 4028.7871 & 0.3163 & 0.5188 & 0.2124 & 0.4094 \tabularnewline
126 & 2583 & 1937.2789 & 87.7622 & 3786.7956 & 0.2469 & 0.2052 & 0.1893 & 0.278 \tabularnewline
127 & 2631 & 1973.7976 & 26.5161 & 3921.0792 & 0.2541 & 0.2699 & 0.2789 & 0.3006 \tabularnewline
128 & 1965 & 1928.4639 & -106.0401 & 3962.9679 & 0.486 & 0.2493 & 0.32 & 0.2933 \tabularnewline
129 & 2209 & 1782.2679 & -330.5863 & 3895.122 & 0.3461 & 0.4327 & 0.2627 & 0.2548 \tabularnewline
130 & 1964 & 1880.2824 & -303.3346 & 4063.8993 & 0.47 & 0.384 & 0.4092 & 0.2912 \tabularnewline
131 & 2132 & 1859.6296 & -388.179 & 4107.4383 & 0.4061 & 0.4637 & 0.2904 & 0.2904 \tabularnewline
\hline
\end{tabular}
%Source: https://freestatistics.org/blog/index.php?pk=155631&T=1

[TABLE]
[ROW][C]Univariate ARIMA Extrapolation Forecast[/C][/ROW]
[ROW][C]time[/C][C]Y[t][/C][C]F[t][/C][C]95% LB[/C][C]95% UB[/C][C]p-value(H0: Y[t] = F[t])[/C][C]P(F[t]>Y[t-1])[/C][C]P(F[t]>Y[t-s])[/C][C]P(F[t]>Y[119])[/C][/ROW]
[ROW][C]107[/C][C]2689[/C][C]-[/C][C]-[/C][C]-[/C][C]-[/C][C]-[/C][C]-[/C][C]-[/C][/ROW]
[ROW][C]108[/C][C]3187[/C][C]-[/C][C]-[/C][C]-[/C][C]-[/C][C]-[/C][C]-[/C][C]-[/C][/ROW]
[ROW][C]109[/C][C]2540[/C][C]-[/C][C]-[/C][C]-[/C][C]-[/C][C]-[/C][C]-[/C][C]-[/C][/ROW]
[ROW][C]110[/C][C]3469[/C][C]-[/C][C]-[/C][C]-[/C][C]-[/C][C]-[/C][C]-[/C][C]-[/C][/ROW]
[ROW][C]111[/C][C]3005[/C][C]-[/C][C]-[/C][C]-[/C][C]-[/C][C]-[/C][C]-[/C][C]-[/C][/ROW]
[ROW][C]112[/C][C]2573[/C][C]-[/C][C]-[/C][C]-[/C][C]-[/C][C]-[/C][C]-[/C][C]-[/C][/ROW]
[ROW][C]113[/C][C]2998[/C][C]-[/C][C]-[/C][C]-[/C][C]-[/C][C]-[/C][C]-[/C][C]-[/C][/ROW]
[ROW][C]114[/C][C]2768[/C][C]-[/C][C]-[/C][C]-[/C][C]-[/C][C]-[/C][C]-[/C][C]-[/C][/ROW]
[ROW][C]115[/C][C]2556[/C][C]-[/C][C]-[/C][C]-[/C][C]-[/C][C]-[/C][C]-[/C][C]-[/C][/ROW]
[ROW][C]116[/C][C]2414[/C][C]-[/C][C]-[/C][C]-[/C][C]-[/C][C]-[/C][C]-[/C][C]-[/C][/ROW]
[ROW][C]117[/C][C]2467[/C][C]-[/C][C]-[/C][C]-[/C][C]-[/C][C]-[/C][C]-[/C][C]-[/C][/ROW]
[ROW][C]118[/C][C]2136[/C][C]-[/C][C]-[/C][C]-[/C][C]-[/C][C]-[/C][C]-[/C][C]-[/C][/ROW]
[ROW][C]119[/C][C]2493[/C][C]-[/C][C]-[/C][C]-[/C][C]-[/C][C]-[/C][C]-[/C][C]-[/C][/ROW]
[ROW][C]120[/C][C]2735[/C][C]2460.3224[/C][C]1691.3066[/C][C]3229.3382[/C][C]0.2419[/C][C]0.4668[/C][C]0.032[/C][C]0.4668[/C][/ROW]
[ROW][C]121[/C][C]2316[/C][C]2189.0591[/C][C]1119.1504[/C][C]3258.9678[/C][C]0.4081[/C][C]0.1586[/C][C]0.2601[/C][C]0.2888[/C][/ROW]
[ROW][C]122[/C][C]3042[/C][C]2588.5595[/C][C]1299.2198[/C][C]3877.8992[/C][C]0.2453[/C][C]0.6607[/C][C]0.0904[/C][C]0.5577[/C][/ROW]
[ROW][C]123[/C][C]2364[/C][C]2248.349[/C][C]783.164[/C][C]3713.534[/C][C]0.4385[/C][C]0.1442[/C][C]0.1557[/C][C]0.3717[/C][/ROW]
[ROW][C]124[/C][C]2248[/C][C]2092.6463[/C][C]480.2072[/C][C]3705.0855[/C][C]0.4251[/C][C]0.3708[/C][C]0.2796[/C][C]0.3133[/C][/ROW]
[ROW][C]125[/C][C]2714[/C][C]2289.8269[/C][C]550.8667[/C][C]4028.7871[/C][C]0.3163[/C][C]0.5188[/C][C]0.2124[/C][C]0.4094[/C][/ROW]
[ROW][C]126[/C][C]2583[/C][C]1937.2789[/C][C]87.7622[/C][C]3786.7956[/C][C]0.2469[/C][C]0.2052[/C][C]0.1893[/C][C]0.278[/C][/ROW]
[ROW][C]127[/C][C]2631[/C][C]1973.7976[/C][C]26.5161[/C][C]3921.0792[/C][C]0.2541[/C][C]0.2699[/C][C]0.2789[/C][C]0.3006[/C][/ROW]
[ROW][C]128[/C][C]1965[/C][C]1928.4639[/C][C]-106.0401[/C][C]3962.9679[/C][C]0.486[/C][C]0.2493[/C][C]0.32[/C][C]0.2933[/C][/ROW]
[ROW][C]129[/C][C]2209[/C][C]1782.2679[/C][C]-330.5863[/C][C]3895.122[/C][C]0.3461[/C][C]0.4327[/C][C]0.2627[/C][C]0.2548[/C][/ROW]
[ROW][C]130[/C][C]1964[/C][C]1880.2824[/C][C]-303.3346[/C][C]4063.8993[/C][C]0.47[/C][C]0.384[/C][C]0.4092[/C][C]0.2912[/C][/ROW]
[ROW][C]131[/C][C]2132[/C][C]1859.6296[/C][C]-388.179[/C][C]4107.4383[/C][C]0.4061[/C][C]0.4637[/C][C]0.2904[/C][C]0.2904[/C][/ROW]
[/TABLE]
Source: https://freestatistics.org/blog/index.php?pk=155631&T=1

Globally Unique Identifier (entire table): ba.freestatistics.org/blog/index.php?pk=155631&T=1

As an alternative you can also use a QR Code:  

The GUIDs for individual cells are displayed in the table below:

Univariate ARIMA Extrapolation Forecast
timeY[t]F[t]95% LB95% UBp-value(H0: Y[t] = F[t])P(F[t]>Y[t-1])P(F[t]>Y[t-s])P(F[t]>Y[119])
1072689-------
1083187-------
1092540-------
1103469-------
1113005-------
1122573-------
1132998-------
1142768-------
1152556-------
1162414-------
1172467-------
1182136-------
1192493-------
12027352460.32241691.30663229.33820.24190.46680.0320.4668
12123162189.05911119.15043258.96780.40810.15860.26010.2888
12230422588.55951299.21983877.89920.24530.66070.09040.5577
12323642248.349783.1643713.5340.43850.14420.15570.3717
12422482092.6463480.20723705.08550.42510.37080.27960.3133
12527142289.8269550.86674028.78710.31630.51880.21240.4094
12625831937.278987.76223786.79560.24690.20520.18930.278
12726311973.797626.51613921.07920.25410.26990.27890.3006
12819651928.4639-106.04013962.96790.4860.24930.320.2933
12922091782.2679-330.58633895.1220.34610.43270.26270.2548
13019641880.2824-303.33464063.89930.470.3840.40920.2912
13121321859.6296-388.1794107.43830.40610.46370.29040.2904


Univariate ARIMA Extrapolation Forecast Performance
time% S.E.PEMAPESq.EMSERMSE
1200.15950.1116075447.793900
1210.24940.0580.084816113.997545780.8957213.9647
1220.25410.17520.1149205608.308599056.7314.7327
1230.33250.05140.099113375.158277636.3145278.6329
1240.39310.07420.094124134.766366936.0049258.7199
1250.38750.18520.1093179922.808285767.1388292.8603
1260.48710.33330.1413416955.719133079.7931364.801
1270.50330.3330.1652431914.9677170434.1899412.8368
1280.53830.01890.1491334.8869151645.3785389.4167
1290.60480.23940.158182100.3167154690.8723393.3076
1300.59250.04450.14777008.644141265.2152375.8527
1310.61670.14650.147674185.6153135675.2485368.3412

\begin{tabular}{lllllllll}
\hline
Univariate ARIMA Extrapolation Forecast Performance \tabularnewline
time & % S.E. & PE & MAPE & Sq.E & MSE & RMSE \tabularnewline
120 & 0.1595 & 0.1116 & 0 & 75447.7939 & 0 & 0 \tabularnewline
121 & 0.2494 & 0.058 & 0.0848 & 16113.9975 & 45780.8957 & 213.9647 \tabularnewline
122 & 0.2541 & 0.1752 & 0.1149 & 205608.3085 & 99056.7 & 314.7327 \tabularnewline
123 & 0.3325 & 0.0514 & 0.0991 & 13375.1582 & 77636.3145 & 278.6329 \tabularnewline
124 & 0.3931 & 0.0742 & 0.0941 & 24134.7663 & 66936.0049 & 258.7199 \tabularnewline
125 & 0.3875 & 0.1852 & 0.1093 & 179922.8082 & 85767.1388 & 292.8603 \tabularnewline
126 & 0.4871 & 0.3333 & 0.1413 & 416955.719 & 133079.7931 & 364.801 \tabularnewline
127 & 0.5033 & 0.333 & 0.1652 & 431914.9677 & 170434.1899 & 412.8368 \tabularnewline
128 & 0.5383 & 0.0189 & 0.149 & 1334.8869 & 151645.3785 & 389.4167 \tabularnewline
129 & 0.6048 & 0.2394 & 0.158 & 182100.3167 & 154690.8723 & 393.3076 \tabularnewline
130 & 0.5925 & 0.0445 & 0.1477 & 7008.644 & 141265.2152 & 375.8527 \tabularnewline
131 & 0.6167 & 0.1465 & 0.1476 & 74185.6153 & 135675.2485 & 368.3412 \tabularnewline
\hline
\end{tabular}
%Source: https://freestatistics.org/blog/index.php?pk=155631&T=2

[TABLE]
[ROW][C]Univariate ARIMA Extrapolation Forecast Performance[/C][/ROW]
[ROW][C]time[/C][C]% S.E.[/C][C]PE[/C][C]MAPE[/C][C]Sq.E[/C][C]MSE[/C][C]RMSE[/C][/ROW]
[ROW][C]120[/C][C]0.1595[/C][C]0.1116[/C][C]0[/C][C]75447.7939[/C][C]0[/C][C]0[/C][/ROW]
[ROW][C]121[/C][C]0.2494[/C][C]0.058[/C][C]0.0848[/C][C]16113.9975[/C][C]45780.8957[/C][C]213.9647[/C][/ROW]
[ROW][C]122[/C][C]0.2541[/C][C]0.1752[/C][C]0.1149[/C][C]205608.3085[/C][C]99056.7[/C][C]314.7327[/C][/ROW]
[ROW][C]123[/C][C]0.3325[/C][C]0.0514[/C][C]0.0991[/C][C]13375.1582[/C][C]77636.3145[/C][C]278.6329[/C][/ROW]
[ROW][C]124[/C][C]0.3931[/C][C]0.0742[/C][C]0.0941[/C][C]24134.7663[/C][C]66936.0049[/C][C]258.7199[/C][/ROW]
[ROW][C]125[/C][C]0.3875[/C][C]0.1852[/C][C]0.1093[/C][C]179922.8082[/C][C]85767.1388[/C][C]292.8603[/C][/ROW]
[ROW][C]126[/C][C]0.4871[/C][C]0.3333[/C][C]0.1413[/C][C]416955.719[/C][C]133079.7931[/C][C]364.801[/C][/ROW]
[ROW][C]127[/C][C]0.5033[/C][C]0.333[/C][C]0.1652[/C][C]431914.9677[/C][C]170434.1899[/C][C]412.8368[/C][/ROW]
[ROW][C]128[/C][C]0.5383[/C][C]0.0189[/C][C]0.149[/C][C]1334.8869[/C][C]151645.3785[/C][C]389.4167[/C][/ROW]
[ROW][C]129[/C][C]0.6048[/C][C]0.2394[/C][C]0.158[/C][C]182100.3167[/C][C]154690.8723[/C][C]393.3076[/C][/ROW]
[ROW][C]130[/C][C]0.5925[/C][C]0.0445[/C][C]0.1477[/C][C]7008.644[/C][C]141265.2152[/C][C]375.8527[/C][/ROW]
[ROW][C]131[/C][C]0.6167[/C][C]0.1465[/C][C]0.1476[/C][C]74185.6153[/C][C]135675.2485[/C][C]368.3412[/C][/ROW]
[/TABLE]
Source: https://freestatistics.org/blog/index.php?pk=155631&T=2

Globally Unique Identifier (entire table): ba.freestatistics.org/blog/index.php?pk=155631&T=2

As an alternative you can also use a QR Code:  

The GUIDs for individual cells are displayed in the table below:

Univariate ARIMA Extrapolation Forecast Performance
time% S.E.PEMAPESq.EMSERMSE
1200.15950.1116075447.793900
1210.24940.0580.084816113.997545780.8957213.9647
1220.25410.17520.1149205608.308599056.7314.7327
1230.33250.05140.099113375.158277636.3145278.6329
1240.39310.07420.094124134.766366936.0049258.7199
1250.38750.18520.1093179922.808285767.1388292.8603
1260.48710.33330.1413416955.719133079.7931364.801
1270.50330.3330.1652431914.9677170434.1899412.8368
1280.53830.01890.1491334.8869151645.3785389.4167
1290.60480.23940.158182100.3167154690.8723393.3076
1300.59250.04450.14777008.644141265.2152375.8527
1310.61670.14650.147674185.6153135675.2485368.3412


Parameters (Session):
par1 = 12 ; par2 = 1 ; par3 = 0 ; par4 = 0 ; par5 = 12 ; par6 = 1 ; par7 = 0 ; par8 = 0 ; par9 = 1 ; par10 = FALSE ;
Parameters (R input):
par1 = 12 ; par2 = 1 ; par3 = 0 ; par4 = 0 ; par5 = 12 ; par6 = 1 ; par7 = 0 ; par8 = 0 ; par9 = 1 ; par10 = FALSE ;
R code (references can be found in the software module):
par1 <- as.numeric(par1) #cut off periods
par2 <- as.numeric(par2) #lambda
par3 <- as.numeric(par3) #degree of non-seasonal differencing
par4 <- as.numeric(par4) #degree of seasonal differencing
par5 <- as.numeric(par5) #seasonal period
par6 <- as.numeric(par6) #p
par7 <- as.numeric(par7) #q
par8 <- as.numeric(par8) #P
par9 <- as.numeric(par9) #Q
if (par10 == 'TRUE') par10 <- TRUE
if (par10 == 'FALSE') par10 <- FALSE
if (par2 == 0) x <- log(x)
if (par2 != 0) x <- x^par2
lx <- length(x)
first <- lx - 2*par1
nx <- lx - par1
nx1 <- nx + 1
fx <- lx - nx
if (fx < 1) {
fx <- par5
nx1 <- lx + fx - 1
first <- lx - 2*fx
}
first <- 1
if (fx < 3) fx <- round(lx/10,0)
(arima.out <- arima(x[1:nx], order=c(par6,par3,par7), seasonal=list(order=c(par8,par4,par9), period=par5), include.mean=par10, method='ML'))
(forecast <- predict(arima.out,par1))
(lb <- forecast$pred - 1.96 * forecast$se)
(ub <- forecast$pred + 1.96 * forecast$se)
if (par2 == 0) {
x <- exp(x)
forecast$pred <- exp(forecast$pred)
lb <- exp(lb)
ub <- exp(ub)
}
if (par2 != 0) {
x <- x^(1/par2)
forecast$pred <- forecast$pred^(1/par2)
lb <- lb^(1/par2)
ub <- ub^(1/par2)
}
if (par2 < 0) {
olb <- lb
lb <- ub
ub <- olb
}
(actandfor <- c(x[1:nx], forecast$pred))
(perc.se <- (ub-forecast$pred)/1.96/forecast$pred)
bitmap(file='test1.png')
opar <- par(mar=c(4,4,2,2),las=1)
ylim <- c( min(x[first:nx],lb), max(x[first:nx],ub))
plot(x,ylim=ylim,type='n',xlim=c(first,lx))
usr <- par('usr')
rect(usr[1],usr[3],nx+1,usr[4],border=NA,col='lemonchiffon')
rect(nx1,usr[3],usr[2],usr[4],border=NA,col='lavender')
abline(h= (-3:3)*2 , col ='gray', lty =3)
polygon( c(nx1:lx,lx:nx1), c(lb,rev(ub)), col = 'orange', lty=2,border=NA)
lines(nx1:lx, lb , lty=2)
lines(nx1:lx, ub , lty=2)
lines(x, lwd=2)
lines(nx1:lx, forecast$pred , lwd=2 , col ='white')
box()
par(opar)
dev.off()
prob.dec <- array(NA, dim=fx)
prob.sdec <- array(NA, dim=fx)
prob.ldec <- array(NA, dim=fx)
prob.pval <- array(NA, dim=fx)
perf.pe <- array(0, dim=fx)
perf.mape <- array(0, dim=fx)
perf.mape1 <- array(0, dim=fx)
perf.se <- array(0, dim=fx)
perf.mse <- array(0, dim=fx)
perf.mse1 <- array(0, dim=fx)
perf.rmse <- array(0, dim=fx)
for (i in 1:fx) {
locSD <- (ub[i] - forecast$pred[i]) / 1.96
perf.pe[i] = (x[nx+i] - forecast$pred[i]) / forecast$pred[i]
perf.se[i] = (x[nx+i] - forecast$pred[i])^2
prob.dec[i] = pnorm((x[nx+i-1] - forecast$pred[i]) / locSD)
prob.sdec[i] = pnorm((x[nx+i-par5] - forecast$pred[i]) / locSD)
prob.ldec[i] = pnorm((x[nx] - forecast$pred[i]) / locSD)
prob.pval[i] = pnorm(abs(x[nx+i] - forecast$pred[i]) / locSD)
}
perf.mape[1] = abs(perf.pe[1])
perf.mse[1] = abs(perf.se[1])
for (i in 2:fx) {
perf.mape[i] = perf.mape[i-1] + abs(perf.pe[i])
perf.mape1[i] = perf.mape[i] / i
perf.mse[i] = perf.mse[i-1] + perf.se[i]
perf.mse1[i] = perf.mse[i] / i
}
perf.rmse = sqrt(perf.mse1)
bitmap(file='test2.png')
plot(forecast$pred, pch=19, type='b',main='ARIMA Extrapolation Forecast', ylab='Forecast and 95% CI', xlab='time',ylim=c(min(lb),max(ub)))
dum <- forecast$pred
dum[1:par1] <- x[(nx+1):lx]
lines(dum, lty=1)
lines(ub,lty=3)
lines(lb,lty=3)
dev.off()
load(file='createtable')
a<-table.start()
a<-table.row.start(a)
a<-table.element(a,'Univariate ARIMA Extrapolation Forecast',9,TRUE)
a<-table.row.end(a)
a<-table.row.start(a)
a<-table.element(a,'time',1,header=TRUE)
a<-table.element(a,'Y[t]',1,header=TRUE)
a<-table.element(a,'F[t]',1,header=TRUE)
a<-table.element(a,'95% LB',1,header=TRUE)
a<-table.element(a,'95% UB',1,header=TRUE)
a<-table.element(a,'p-value
(H0: Y[t] = F[t])',1,header=TRUE)
a<-table.element(a,'P(F[t]>Y[t-1])',1,header=TRUE)
a<-table.element(a,'P(F[t]>Y[t-s])',1,header=TRUE)
mylab <- paste('P(F[t]>Y[',nx,sep='')
mylab <- paste(mylab,'])',sep='')
a<-table.element(a,mylab,1,header=TRUE)
a<-table.row.end(a)
for (i in (nx-par5):nx) {
a<-table.row.start(a)
a<-table.element(a,i,header=TRUE)
a<-table.element(a,x[i])
a<-table.element(a,'-')
a<-table.row.end(a)
}
for (i in 1:fx) {
a<-table.row.start(a)
a<-table.element(a,nx+i,header=TRUE)
a<-table.element(a,round(x[nx+i],4))
a<-table.element(a,round(forecast$pred[i],4))
a<-table.element(a,round(lb[i],4))
a<-table.element(a,round(ub[i],4))
a<-table.element(a,round((1-prob.pval[i]),4))
a<-table.element(a,round((1-prob.dec[i]),4))
a<-table.element(a,round((1-prob.sdec[i]),4))
a<-table.element(a,round((1-prob.ldec[i]),4))
a<-table.row.end(a)
}
a<-table.end(a)
table.save(a,file='mytable.tab')
a<-table.start()
a<-table.row.start(a)
a<-table.element(a,'Univariate ARIMA Extrapolation Forecast Performance',7,TRUE)
a<-table.row.end(a)
a<-table.row.start(a)
a<-table.element(a,'time',1,header=TRUE)
a<-table.element(a,'% S.E.',1,header=TRUE)
a<-table.element(a,'PE',1,header=TRUE)
a<-table.element(a,'MAPE',1,header=TRUE)
a<-table.element(a,'Sq.E',1,header=TRUE)
a<-table.element(a,'MSE',1,header=TRUE)
a<-table.element(a,'RMSE',1,header=TRUE)
a<-table.row.end(a)
for (i in 1:fx) {
a<-table.row.start(a)
a<-table.element(a,nx+i,header=TRUE)
a<-table.element(a,round(perc.se[i],4))
a<-table.element(a,round(perf.pe[i],4))
a<-table.element(a,round(perf.mape1[i],4))
a<-table.element(a,round(perf.se[i],4))
a<-table.element(a,round(perf.mse1[i],4))
a<-table.element(a,round(perf.rmse[i],4))
a<-table.row.end(a)
}
a<-table.end(a)
table.save(a,file='mytable1.tab')