Free Statistics

of Irreproducible Research!

Author's title

Author*The author of this computation has been verified*
R Software Modulerwasp_arimabackwardselection.wasp
Title produced by softwareARIMA Backward Selection
Date of computationThu, 15 Dec 2011 13:15:44 -0500
Cite this page as followsStatistical Computations at FreeStatistics.org, Office for Research Development and Education, URL https://freestatistics.org/blog/index.php?v=date/2011/Dec/15/t1323973124hji17fau2jl1fy2.htm/, Retrieved Wed, 08 May 2024 21:06:29 +0000
Statistical Computations at FreeStatistics.org, Office for Research Development and Education, URL https://freestatistics.org/blog/index.php?pk=155622, Retrieved Wed, 08 May 2024 21:06:29 +0000
QR Codes:

Original text written by user:
IsPrivate?No (this computation is public)
User-defined keywords
Estimated Impact104
Family? (F = Feedback message, R = changed R code, M = changed R Module, P = changed Parameters, D = changed Data)
-     [Kendall tau Correlation Matrix] [] [2010-12-05 17:44:33] [b98453cac15ba1066b407e146608df68]
- RMPD  [Kendall tau Correlation Matrix] [WS 10 - Pearson c...] [2010-12-10 16:13:49] [033eb2749a430605d9b2be7c4aac4a0c]
-         [Kendall tau Correlation Matrix] [] [2010-12-13 18:15:16] [d7b28a0391ab3b2ddc9f9fba95a43f33]
- RMPD      [ARIMA Backward Selection] [] [2010-12-24 12:10:07] [b07cd1964830aab808142229b1166ece]
-    D          [ARIMA Backward Selection] [ARIMA backward s....] [2011-12-15 18:15:44] [0e2c18186cab982e7ba7b89fbe242e59] [Current]
Feedback Forum

Post a new message
Dataseries X:
1770
2203
2836
1976
2150
2180
2631
1781
2327
2260
2051
2250
2102
2957
2485
2871
2447
2570
2622
1840
2682
2369
2119
2531
2214
3206
2709
2734
2348
2702
2642
2064
2647
2534
2297
2718
2321
3112
2664
2808
2668
2934
2616
2228
2463
2416
2407
2582
2101
3305
2818
2401
3019
2507
2948
2210
2467
2596
2451
2233
2393
3122
2801
2656
2782
2604
2803
2178
2324
2536
2408
2261
2166
3243
2296
2719
2734
2297
2732
1904
2397
2473
1967
2471
2203
3053
2350
2807
2639
2646
2577
1860
2624
2590
2261
3342
2840
3328
3245
3025
2915
3579
2787
2397
3065
2154
2689
3187
2540
3469
3005
2573
2998
2768
2556
2414
2467
2136
2493
2735
2316
3042
2364
2248
2714
2583
2631
1965
2209
1964
2132


Summary of computational transaction
Raw Inputview raw input (R code)
Raw Outputview raw output of R engine
Computing time9 seconds
R Server'AstonUniversity' @ aston.wessa.net

\begin{tabular}{lllllllll}
\hline
Summary of computational transaction \tabularnewline
Raw Input & view raw input (R code)  \tabularnewline
Raw Output & view raw output of R engine  \tabularnewline
Computing time & 9 seconds \tabularnewline
R Server & 'AstonUniversity' @ aston.wessa.net \tabularnewline
\hline
\end{tabular}
%Source: https://freestatistics.org/blog/index.php?pk=155622&T=0

[TABLE]
[ROW][C]Summary of computational transaction[/C][/ROW]
[ROW][C]Raw Input[/C][C]view raw input (R code) [/C][/ROW]
[ROW][C]Raw Output[/C][C]view raw output of R engine [/C][/ROW]
[ROW][C]Computing time[/C][C]9 seconds[/C][/ROW]
[ROW][C]R Server[/C][C]'AstonUniversity' @ aston.wessa.net[/C][/ROW]
[/TABLE]
Source: https://freestatistics.org/blog/index.php?pk=155622&T=0

Globally Unique Identifier (entire table): ba.freestatistics.org/blog/index.php?pk=155622&T=0

As an alternative you can also use a QR Code:  

The GUIDs for individual cells are displayed in the table below:

Summary of computational transaction
Raw Inputview raw input (R code)
Raw Outputview raw output of R engine
Computing time9 seconds
R Server'AstonUniversity' @ aston.wessa.net


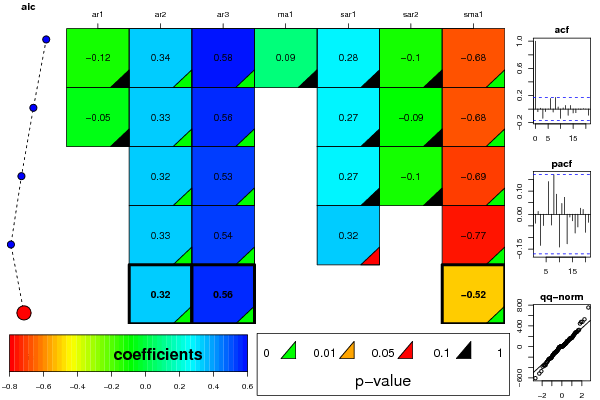
ARIMA Parameter Estimation and Backward Selection
Iterationar1ar2ar3ma1sar1sar2sma1
Estimates ( 1 )-0.12010.33940.58290.09310.2815-0.1002-0.6767
(p-val)(0.3963 )(0 )(0 )(0.5713 )(0.1276 )(0.4354 )(2e-04 )
Estimates ( 2 )-0.05220.330.556400.2698-0.0908-0.6776
(p-val)(0.5182 )(0 )(0 )(NA )(0.1447 )(0.478 )(2e-04 )
Estimates ( 3 )00.32070.533600.27-0.1015-0.6894
(p-val)(NA )(0 )(0 )(NA )(0.1308 )(0.4188 )(1e-04 )
Estimates ( 4 )00.32530.542500.32350-0.7664
(p-val)(NA )(0 )(0 )(NA )(0.0574 )(NA )(0 )
Estimates ( 5 )00.32390.5597000-0.5185
(p-val)(NA )(0 )(0 )(NA )(NA )(NA )(0 )
Estimates ( 6 )NANANANANANANA
(p-val)(NA )(NA )(NA )(NA )(NA )(NA )(NA )
Estimates ( 7 )NANANANANANANA
(p-val)(NA )(NA )(NA )(NA )(NA )(NA )(NA )
Estimates ( 8 )NANANANANANANA
(p-val)(NA )(NA )(NA )(NA )(NA )(NA )(NA )
Estimates ( 9 )NANANANANANANA
(p-val)(NA )(NA )(NA )(NA )(NA )(NA )(NA )
Estimates ( 10 )NANANANANANANA
(p-val)(NA )(NA )(NA )(NA )(NA )(NA )(NA )
Estimates ( 11 )NANANANANANANA
(p-val)(NA )(NA )(NA )(NA )(NA )(NA )(NA )
Estimates ( 12 )NANANANANANANA
(p-val)(NA )(NA )(NA )(NA )(NA )(NA )(NA )
Estimates ( 13 )NANANANANANANA
(p-val)(NA )(NA )(NA )(NA )(NA )(NA )(NA )

\begin{tabular}{lllllllll}
\hline
ARIMA Parameter Estimation and Backward Selection \tabularnewline
Iteration & ar1 & ar2 & ar3 & ma1 & sar1 & sar2 & sma1 \tabularnewline
Estimates ( 1 ) & -0.1201 & 0.3394 & 0.5829 & 0.0931 & 0.2815 & -0.1002 & -0.6767 \tabularnewline
(p-val) & (0.3963 ) & (0 ) & (0 ) & (0.5713 ) & (0.1276 ) & (0.4354 ) & (2e-04 ) \tabularnewline
Estimates ( 2 ) & -0.0522 & 0.33 & 0.5564 & 0 & 0.2698 & -0.0908 & -0.6776 \tabularnewline
(p-val) & (0.5182 ) & (0 ) & (0 ) & (NA ) & (0.1447 ) & (0.478 ) & (2e-04 ) \tabularnewline
Estimates ( 3 ) & 0 & 0.3207 & 0.5336 & 0 & 0.27 & -0.1015 & -0.6894 \tabularnewline
(p-val) & (NA ) & (0 ) & (0 ) & (NA ) & (0.1308 ) & (0.4188 ) & (1e-04 ) \tabularnewline
Estimates ( 4 ) & 0 & 0.3253 & 0.5425 & 0 & 0.3235 & 0 & -0.7664 \tabularnewline
(p-val) & (NA ) & (0 ) & (0 ) & (NA ) & (0.0574 ) & (NA ) & (0 ) \tabularnewline
Estimates ( 5 ) & 0 & 0.3239 & 0.5597 & 0 & 0 & 0 & -0.5185 \tabularnewline
(p-val) & (NA ) & (0 ) & (0 ) & (NA ) & (NA ) & (NA ) & (0 ) \tabularnewline
Estimates ( 6 ) & NA & NA & NA & NA & NA & NA & NA \tabularnewline
(p-val) & (NA ) & (NA ) & (NA ) & (NA ) & (NA ) & (NA ) & (NA ) \tabularnewline
Estimates ( 7 ) & NA & NA & NA & NA & NA & NA & NA \tabularnewline
(p-val) & (NA ) & (NA ) & (NA ) & (NA ) & (NA ) & (NA ) & (NA ) \tabularnewline
Estimates ( 8 ) & NA & NA & NA & NA & NA & NA & NA \tabularnewline
(p-val) & (NA ) & (NA ) & (NA ) & (NA ) & (NA ) & (NA ) & (NA ) \tabularnewline
Estimates ( 9 ) & NA & NA & NA & NA & NA & NA & NA \tabularnewline
(p-val) & (NA ) & (NA ) & (NA ) & (NA ) & (NA ) & (NA ) & (NA ) \tabularnewline
Estimates ( 10 ) & NA & NA & NA & NA & NA & NA & NA \tabularnewline
(p-val) & (NA ) & (NA ) & (NA ) & (NA ) & (NA ) & (NA ) & (NA ) \tabularnewline
Estimates ( 11 ) & NA & NA & NA & NA & NA & NA & NA \tabularnewline
(p-val) & (NA ) & (NA ) & (NA ) & (NA ) & (NA ) & (NA ) & (NA ) \tabularnewline
Estimates ( 12 ) & NA & NA & NA & NA & NA & NA & NA \tabularnewline
(p-val) & (NA ) & (NA ) & (NA ) & (NA ) & (NA ) & (NA ) & (NA ) \tabularnewline
Estimates ( 13 ) & NA & NA & NA & NA & NA & NA & NA \tabularnewline
(p-val) & (NA ) & (NA ) & (NA ) & (NA ) & (NA ) & (NA ) & (NA ) \tabularnewline
\hline
\end{tabular}
%Source: https://freestatistics.org/blog/index.php?pk=155622&T=1

[TABLE]
[ROW][C]ARIMA Parameter Estimation and Backward Selection[/C][/ROW]
[ROW][C]Iteration[/C][C]ar1[/C][C]ar2[/C][C]ar3[/C][C]ma1[/C][C]sar1[/C][C]sar2[/C][C]sma1[/C][/ROW]
[ROW][C]Estimates ( 1 )[/C][C]-0.1201[/C][C]0.3394[/C][C]0.5829[/C][C]0.0931[/C][C]0.2815[/C][C]-0.1002[/C][C]-0.6767[/C][/ROW]
[ROW][C](p-val)[/C][C](0.3963 )[/C][C](0 )[/C][C](0 )[/C][C](0.5713 )[/C][C](0.1276 )[/C][C](0.4354 )[/C][C](2e-04 )[/C][/ROW]
[ROW][C]Estimates ( 2 )[/C][C]-0.0522[/C][C]0.33[/C][C]0.5564[/C][C]0[/C][C]0.2698[/C][C]-0.0908[/C][C]-0.6776[/C][/ROW]
[ROW][C](p-val)[/C][C](0.5182 )[/C][C](0 )[/C][C](0 )[/C][C](NA )[/C][C](0.1447 )[/C][C](0.478 )[/C][C](2e-04 )[/C][/ROW]
[ROW][C]Estimates ( 3 )[/C][C]0[/C][C]0.3207[/C][C]0.5336[/C][C]0[/C][C]0.27[/C][C]-0.1015[/C][C]-0.6894[/C][/ROW]
[ROW][C](p-val)[/C][C](NA )[/C][C](0 )[/C][C](0 )[/C][C](NA )[/C][C](0.1308 )[/C][C](0.4188 )[/C][C](1e-04 )[/C][/ROW]
[ROW][C]Estimates ( 4 )[/C][C]0[/C][C]0.3253[/C][C]0.5425[/C][C]0[/C][C]0.3235[/C][C]0[/C][C]-0.7664[/C][/ROW]
[ROW][C](p-val)[/C][C](NA )[/C][C](0 )[/C][C](0 )[/C][C](NA )[/C][C](0.0574 )[/C][C](NA )[/C][C](0 )[/C][/ROW]
[ROW][C]Estimates ( 5 )[/C][C]0[/C][C]0.3239[/C][C]0.5597[/C][C]0[/C][C]0[/C][C]0[/C][C]-0.5185[/C][/ROW]
[ROW][C](p-val)[/C][C](NA )[/C][C](0 )[/C][C](0 )[/C][C](NA )[/C][C](NA )[/C][C](NA )[/C][C](0 )[/C][/ROW]
[ROW][C]Estimates ( 6 )[/C][C]NA[/C][C]NA[/C][C]NA[/C][C]NA[/C][C]NA[/C][C]NA[/C][C]NA[/C][/ROW]
[ROW][C](p-val)[/C][C](NA )[/C][C](NA )[/C][C](NA )[/C][C](NA )[/C][C](NA )[/C][C](NA )[/C][C](NA )[/C][/ROW]
[ROW][C]Estimates ( 7 )[/C][C]NA[/C][C]NA[/C][C]NA[/C][C]NA[/C][C]NA[/C][C]NA[/C][C]NA[/C][/ROW]
[ROW][C](p-val)[/C][C](NA )[/C][C](NA )[/C][C](NA )[/C][C](NA )[/C][C](NA )[/C][C](NA )[/C][C](NA )[/C][/ROW]
[ROW][C]Estimates ( 8 )[/C][C]NA[/C][C]NA[/C][C]NA[/C][C]NA[/C][C]NA[/C][C]NA[/C][C]NA[/C][/ROW]
[ROW][C](p-val)[/C][C](NA )[/C][C](NA )[/C][C](NA )[/C][C](NA )[/C][C](NA )[/C][C](NA )[/C][C](NA )[/C][/ROW]
[ROW][C]Estimates ( 9 )[/C][C]NA[/C][C]NA[/C][C]NA[/C][C]NA[/C][C]NA[/C][C]NA[/C][C]NA[/C][/ROW]
[ROW][C](p-val)[/C][C](NA )[/C][C](NA )[/C][C](NA )[/C][C](NA )[/C][C](NA )[/C][C](NA )[/C][C](NA )[/C][/ROW]
[ROW][C]Estimates ( 10 )[/C][C]NA[/C][C]NA[/C][C]NA[/C][C]NA[/C][C]NA[/C][C]NA[/C][C]NA[/C][/ROW]
[ROW][C](p-val)[/C][C](NA )[/C][C](NA )[/C][C](NA )[/C][C](NA )[/C][C](NA )[/C][C](NA )[/C][C](NA )[/C][/ROW]
[ROW][C]Estimates ( 11 )[/C][C]NA[/C][C]NA[/C][C]NA[/C][C]NA[/C][C]NA[/C][C]NA[/C][C]NA[/C][/ROW]
[ROW][C](p-val)[/C][C](NA )[/C][C](NA )[/C][C](NA )[/C][C](NA )[/C][C](NA )[/C][C](NA )[/C][C](NA )[/C][/ROW]
[ROW][C]Estimates ( 12 )[/C][C]NA[/C][C]NA[/C][C]NA[/C][C]NA[/C][C]NA[/C][C]NA[/C][C]NA[/C][/ROW]
[ROW][C](p-val)[/C][C](NA )[/C][C](NA )[/C][C](NA )[/C][C](NA )[/C][C](NA )[/C][C](NA )[/C][C](NA )[/C][/ROW]
[ROW][C]Estimates ( 13 )[/C][C]NA[/C][C]NA[/C][C]NA[/C][C]NA[/C][C]NA[/C][C]NA[/C][C]NA[/C][/ROW]
[ROW][C](p-val)[/C][C](NA )[/C][C](NA )[/C][C](NA )[/C][C](NA )[/C][C](NA )[/C][C](NA )[/C][C](NA )[/C][/ROW]
[/TABLE]
Source: https://freestatistics.org/blog/index.php?pk=155622&T=1

Globally Unique Identifier (entire table): ba.freestatistics.org/blog/index.php?pk=155622&T=1

As an alternative you can also use a QR Code:  

The GUIDs for individual cells are displayed in the table below:

ARIMA Parameter Estimation and Backward Selection
Iterationar1ar2ar3ma1sar1sar2sma1
Estimates ( 1 )-0.12010.33940.58290.09310.2815-0.1002-0.6767
(p-val)(0.3963 )(0 )(0 )(0.5713 )(0.1276 )(0.4354 )(2e-04 )
Estimates ( 2 )-0.05220.330.556400.2698-0.0908-0.6776
(p-val)(0.5182 )(0 )(0 )(NA )(0.1447 )(0.478 )(2e-04 )
Estimates ( 3 )00.32070.533600.27-0.1015-0.6894
(p-val)(NA )(0 )(0 )(NA )(0.1308 )(0.4188 )(1e-04 )
Estimates ( 4 )00.32530.542500.32350-0.7664
(p-val)(NA )(0 )(0 )(NA )(0.0574 )(NA )(0 )
Estimates ( 5 )00.32390.5597000-0.5185
(p-val)(NA )(0 )(0 )(NA )(NA )(NA )(0 )
Estimates ( 6 )NANANANANANANA
(p-val)(NA )(NA )(NA )(NA )(NA )(NA )(NA )
Estimates ( 7 )NANANANANANANA
(p-val)(NA )(NA )(NA )(NA )(NA )(NA )(NA )
Estimates ( 8 )NANANANANANANA
(p-val)(NA )(NA )(NA )(NA )(NA )(NA )(NA )
Estimates ( 9 )NANANANANANANA
(p-val)(NA )(NA )(NA )(NA )(NA )(NA )(NA )
Estimates ( 10 )NANANANANANANA
(p-val)(NA )(NA )(NA )(NA )(NA )(NA )(NA )
Estimates ( 11 )NANANANANANANA
(p-val)(NA )(NA )(NA )(NA )(NA )(NA )(NA )
Estimates ( 12 )NANANANANANANA
(p-val)(NA )(NA )(NA )(NA )(NA )(NA )(NA )
Estimates ( 13 )NANANANANANANA
(p-val)(NA )(NA )(NA )(NA )(NA )(NA )(NA )


Estimated ARIMA Residuals
Value
2.24998346993725
230.179516071637
478.218512203185
-472.170972862455
444.014659607644
39.1690052471545
295.56533252801
-517.159942044055
-153.420798615829
155.297894778955
100.532376526203
21.8950221806249
38.2576051512493
66.2123870376125
271.329811412105
-80.666274289154
-113.744330283504
-265.220705248043
159.863608880457
-39.0596087994742
198.131869657464
-44.7971441803313
117.250146974424
112.915091861884
157.646811560361
-1.69147646829911
-87.6560803490525
-239.978546906374
52.4083739638625
285.269975895028
323.954694323681
-231.209601173815
-13.8700685108347
-289.552213501385
-95.3632870571166
138.009117435386
62.9170666315666
-176.410228090231
192.796193181935
175.877158852419
-321.035912707114
279.854991377026
-208.306605409156
315.783297172056
-51.480624911036
10.4216897837269
-14.2980980038122
128.672953780154
-356.301577867706
108.99530941889
-6.42729132906613
109.856369937291
27.2443774385406
15.8188066109989
-11.3950724822604
-108.569193585006
48.3218456646586
-180.633941526452
16.5194238963832
99.9683621226952
-11.4657911034856
-154.994356096012
159.55889212197
-386.294083744497
116.000776410328
104.678381526604
-69.6122732296195
-105.268826004316
-131.884769903131
172.202934095672
66.9081327652383
-245.518291725945
140.312677048424
154.101389898298
58.362774994699
-220.717915570695
170.211615178087
53.8104105632492
254.586467215197
-222.382479859325
-158.067279541953
134.04600644941
244.91411260035
158.951430274918
753.122647930544
525.344032986513
-116.145298800365
70.951858756207
-128.275500567857
-119.537497623531
476.486591876196
-111.655781447578
-2.21145854560156
-58.9247361066238
-605.548596867539
35.916307865424
93.4928139194853
44.0714343085243
-75.1490730005277
-73.6683101364857
-362.772752217563
46.1557056099382
-290.849766381798
-98.9311074498651
206.646409078145
-84.853589036995
-127.087368825287
18.8963715052704
31.2834241642847
-51.2284445540043
-217.873120388666
-360.312848740823
-233.849290032512
163.974336462838
218.247568967975
271.88908319339
-152.768054251307
-220.151486454335
-196.793298617159
-15.6334451936838

\begin{tabular}{lllllllll}
\hline
Estimated ARIMA Residuals \tabularnewline
Value \tabularnewline
2.24998346993725 \tabularnewline
230.179516071637 \tabularnewline
478.218512203185 \tabularnewline
-472.170972862455 \tabularnewline
444.014659607644 \tabularnewline
39.1690052471545 \tabularnewline
295.56533252801 \tabularnewline
-517.159942044055 \tabularnewline
-153.420798615829 \tabularnewline
155.297894778955 \tabularnewline
100.532376526203 \tabularnewline
21.8950221806249 \tabularnewline
38.2576051512493 \tabularnewline
66.2123870376125 \tabularnewline
271.329811412105 \tabularnewline
-80.666274289154 \tabularnewline
-113.744330283504 \tabularnewline
-265.220705248043 \tabularnewline
159.863608880457 \tabularnewline
-39.0596087994742 \tabularnewline
198.131869657464 \tabularnewline
-44.7971441803313 \tabularnewline
117.250146974424 \tabularnewline
112.915091861884 \tabularnewline
157.646811560361 \tabularnewline
-1.69147646829911 \tabularnewline
-87.6560803490525 \tabularnewline
-239.978546906374 \tabularnewline
52.4083739638625 \tabularnewline
285.269975895028 \tabularnewline
323.954694323681 \tabularnewline
-231.209601173815 \tabularnewline
-13.8700685108347 \tabularnewline
-289.552213501385 \tabularnewline
-95.3632870571166 \tabularnewline
138.009117435386 \tabularnewline
62.9170666315666 \tabularnewline
-176.410228090231 \tabularnewline
192.796193181935 \tabularnewline
175.877158852419 \tabularnewline
-321.035912707114 \tabularnewline
279.854991377026 \tabularnewline
-208.306605409156 \tabularnewline
315.783297172056 \tabularnewline
-51.480624911036 \tabularnewline
10.4216897837269 \tabularnewline
-14.2980980038122 \tabularnewline
128.672953780154 \tabularnewline
-356.301577867706 \tabularnewline
108.99530941889 \tabularnewline
-6.42729132906613 \tabularnewline
109.856369937291 \tabularnewline
27.2443774385406 \tabularnewline
15.8188066109989 \tabularnewline
-11.3950724822604 \tabularnewline
-108.569193585006 \tabularnewline
48.3218456646586 \tabularnewline
-180.633941526452 \tabularnewline
16.5194238963832 \tabularnewline
99.9683621226952 \tabularnewline
-11.4657911034856 \tabularnewline
-154.994356096012 \tabularnewline
159.55889212197 \tabularnewline
-386.294083744497 \tabularnewline
116.000776410328 \tabularnewline
104.678381526604 \tabularnewline
-69.6122732296195 \tabularnewline
-105.268826004316 \tabularnewline
-131.884769903131 \tabularnewline
172.202934095672 \tabularnewline
66.9081327652383 \tabularnewline
-245.518291725945 \tabularnewline
140.312677048424 \tabularnewline
154.101389898298 \tabularnewline
58.362774994699 \tabularnewline
-220.717915570695 \tabularnewline
170.211615178087 \tabularnewline
53.8104105632492 \tabularnewline
254.586467215197 \tabularnewline
-222.382479859325 \tabularnewline
-158.067279541953 \tabularnewline
134.04600644941 \tabularnewline
244.91411260035 \tabularnewline
158.951430274918 \tabularnewline
753.122647930544 \tabularnewline
525.344032986513 \tabularnewline
-116.145298800365 \tabularnewline
70.951858756207 \tabularnewline
-128.275500567857 \tabularnewline
-119.537497623531 \tabularnewline
476.486591876196 \tabularnewline
-111.655781447578 \tabularnewline
-2.21145854560156 \tabularnewline
-58.9247361066238 \tabularnewline
-605.548596867539 \tabularnewline
35.916307865424 \tabularnewline
93.4928139194853 \tabularnewline
44.0714343085243 \tabularnewline
-75.1490730005277 \tabularnewline
-73.6683101364857 \tabularnewline
-362.772752217563 \tabularnewline
46.1557056099382 \tabularnewline
-290.849766381798 \tabularnewline
-98.9311074498651 \tabularnewline
206.646409078145 \tabularnewline
-84.853589036995 \tabularnewline
-127.087368825287 \tabularnewline
18.8963715052704 \tabularnewline
31.2834241642847 \tabularnewline
-51.2284445540043 \tabularnewline
-217.873120388666 \tabularnewline
-360.312848740823 \tabularnewline
-233.849290032512 \tabularnewline
163.974336462838 \tabularnewline
218.247568967975 \tabularnewline
271.88908319339 \tabularnewline
-152.768054251307 \tabularnewline
-220.151486454335 \tabularnewline
-196.793298617159 \tabularnewline
-15.6334451936838 \tabularnewline
\hline
\end{tabular}
%Source: https://freestatistics.org/blog/index.php?pk=155622&T=2

[TABLE]
[ROW][C]Estimated ARIMA Residuals[/C][/ROW]
[ROW][C]Value[/C][/ROW]
[ROW][C]2.24998346993725[/C][/ROW]
[ROW][C]230.179516071637[/C][/ROW]
[ROW][C]478.218512203185[/C][/ROW]
[ROW][C]-472.170972862455[/C][/ROW]
[ROW][C]444.014659607644[/C][/ROW]
[ROW][C]39.1690052471545[/C][/ROW]
[ROW][C]295.56533252801[/C][/ROW]
[ROW][C]-517.159942044055[/C][/ROW]
[ROW][C]-153.420798615829[/C][/ROW]
[ROW][C]155.297894778955[/C][/ROW]
[ROW][C]100.532376526203[/C][/ROW]
[ROW][C]21.8950221806249[/C][/ROW]
[ROW][C]38.2576051512493[/C][/ROW]
[ROW][C]66.2123870376125[/C][/ROW]
[ROW][C]271.329811412105[/C][/ROW]
[ROW][C]-80.666274289154[/C][/ROW]
[ROW][C]-113.744330283504[/C][/ROW]
[ROW][C]-265.220705248043[/C][/ROW]
[ROW][C]159.863608880457[/C][/ROW]
[ROW][C]-39.0596087994742[/C][/ROW]
[ROW][C]198.131869657464[/C][/ROW]
[ROW][C]-44.7971441803313[/C][/ROW]
[ROW][C]117.250146974424[/C][/ROW]
[ROW][C]112.915091861884[/C][/ROW]
[ROW][C]157.646811560361[/C][/ROW]
[ROW][C]-1.69147646829911[/C][/ROW]
[ROW][C]-87.6560803490525[/C][/ROW]
[ROW][C]-239.978546906374[/C][/ROW]
[ROW][C]52.4083739638625[/C][/ROW]
[ROW][C]285.269975895028[/C][/ROW]
[ROW][C]323.954694323681[/C][/ROW]
[ROW][C]-231.209601173815[/C][/ROW]
[ROW][C]-13.8700685108347[/C][/ROW]
[ROW][C]-289.552213501385[/C][/ROW]
[ROW][C]-95.3632870571166[/C][/ROW]
[ROW][C]138.009117435386[/C][/ROW]
[ROW][C]62.9170666315666[/C][/ROW]
[ROW][C]-176.410228090231[/C][/ROW]
[ROW][C]192.796193181935[/C][/ROW]
[ROW][C]175.877158852419[/C][/ROW]
[ROW][C]-321.035912707114[/C][/ROW]
[ROW][C]279.854991377026[/C][/ROW]
[ROW][C]-208.306605409156[/C][/ROW]
[ROW][C]315.783297172056[/C][/ROW]
[ROW][C]-51.480624911036[/C][/ROW]
[ROW][C]10.4216897837269[/C][/ROW]
[ROW][C]-14.2980980038122[/C][/ROW]
[ROW][C]128.672953780154[/C][/ROW]
[ROW][C]-356.301577867706[/C][/ROW]
[ROW][C]108.99530941889[/C][/ROW]
[ROW][C]-6.42729132906613[/C][/ROW]
[ROW][C]109.856369937291[/C][/ROW]
[ROW][C]27.2443774385406[/C][/ROW]
[ROW][C]15.8188066109989[/C][/ROW]
[ROW][C]-11.3950724822604[/C][/ROW]
[ROW][C]-108.569193585006[/C][/ROW]
[ROW][C]48.3218456646586[/C][/ROW]
[ROW][C]-180.633941526452[/C][/ROW]
[ROW][C]16.5194238963832[/C][/ROW]
[ROW][C]99.9683621226952[/C][/ROW]
[ROW][C]-11.4657911034856[/C][/ROW]
[ROW][C]-154.994356096012[/C][/ROW]
[ROW][C]159.55889212197[/C][/ROW]
[ROW][C]-386.294083744497[/C][/ROW]
[ROW][C]116.000776410328[/C][/ROW]
[ROW][C]104.678381526604[/C][/ROW]
[ROW][C]-69.6122732296195[/C][/ROW]
[ROW][C]-105.268826004316[/C][/ROW]
[ROW][C]-131.884769903131[/C][/ROW]
[ROW][C]172.202934095672[/C][/ROW]
[ROW][C]66.9081327652383[/C][/ROW]
[ROW][C]-245.518291725945[/C][/ROW]
[ROW][C]140.312677048424[/C][/ROW]
[ROW][C]154.101389898298[/C][/ROW]
[ROW][C]58.362774994699[/C][/ROW]
[ROW][C]-220.717915570695[/C][/ROW]
[ROW][C]170.211615178087[/C][/ROW]
[ROW][C]53.8104105632492[/C][/ROW]
[ROW][C]254.586467215197[/C][/ROW]
[ROW][C]-222.382479859325[/C][/ROW]
[ROW][C]-158.067279541953[/C][/ROW]
[ROW][C]134.04600644941[/C][/ROW]
[ROW][C]244.91411260035[/C][/ROW]
[ROW][C]158.951430274918[/C][/ROW]
[ROW][C]753.122647930544[/C][/ROW]
[ROW][C]525.344032986513[/C][/ROW]
[ROW][C]-116.145298800365[/C][/ROW]
[ROW][C]70.951858756207[/C][/ROW]
[ROW][C]-128.275500567857[/C][/ROW]
[ROW][C]-119.537497623531[/C][/ROW]
[ROW][C]476.486591876196[/C][/ROW]
[ROW][C]-111.655781447578[/C][/ROW]
[ROW][C]-2.21145854560156[/C][/ROW]
[ROW][C]-58.9247361066238[/C][/ROW]
[ROW][C]-605.548596867539[/C][/ROW]
[ROW][C]35.916307865424[/C][/ROW]
[ROW][C]93.4928139194853[/C][/ROW]
[ROW][C]44.0714343085243[/C][/ROW]
[ROW][C]-75.1490730005277[/C][/ROW]
[ROW][C]-73.6683101364857[/C][/ROW]
[ROW][C]-362.772752217563[/C][/ROW]
[ROW][C]46.1557056099382[/C][/ROW]
[ROW][C]-290.849766381798[/C][/ROW]
[ROW][C]-98.9311074498651[/C][/ROW]
[ROW][C]206.646409078145[/C][/ROW]
[ROW][C]-84.853589036995[/C][/ROW]
[ROW][C]-127.087368825287[/C][/ROW]
[ROW][C]18.8963715052704[/C][/ROW]
[ROW][C]31.2834241642847[/C][/ROW]
[ROW][C]-51.2284445540043[/C][/ROW]
[ROW][C]-217.873120388666[/C][/ROW]
[ROW][C]-360.312848740823[/C][/ROW]
[ROW][C]-233.849290032512[/C][/ROW]
[ROW][C]163.974336462838[/C][/ROW]
[ROW][C]218.247568967975[/C][/ROW]
[ROW][C]271.88908319339[/C][/ROW]
[ROW][C]-152.768054251307[/C][/ROW]
[ROW][C]-220.151486454335[/C][/ROW]
[ROW][C]-196.793298617159[/C][/ROW]
[ROW][C]-15.6334451936838[/C][/ROW]
[/TABLE]
Source: https://freestatistics.org/blog/index.php?pk=155622&T=2

Globally Unique Identifier (entire table): ba.freestatistics.org/blog/index.php?pk=155622&T=2

As an alternative you can also use a QR Code:  

The GUIDs for individual cells are displayed in the table below:

Estimated ARIMA Residuals
Value
2.24998346993725
230.179516071637
478.218512203185
-472.170972862455
444.014659607644
39.1690052471545
295.56533252801
-517.159942044055
-153.420798615829
155.297894778955
100.532376526203
21.8950221806249
38.2576051512493
66.2123870376125
271.329811412105
-80.666274289154
-113.744330283504
-265.220705248043
159.863608880457
-39.0596087994742
198.131869657464
-44.7971441803313
117.250146974424
112.915091861884
157.646811560361
-1.69147646829911
-87.6560803490525
-239.978546906374
52.4083739638625
285.269975895028
323.954694323681
-231.209601173815
-13.8700685108347
-289.552213501385
-95.3632870571166
138.009117435386
62.9170666315666
-176.410228090231
192.796193181935
175.877158852419
-321.035912707114
279.854991377026
-208.306605409156
315.783297172056
-51.480624911036
10.4216897837269
-14.2980980038122
128.672953780154
-356.301577867706
108.99530941889
-6.42729132906613
109.856369937291
27.2443774385406
15.8188066109989
-11.3950724822604
-108.569193585006
48.3218456646586
-180.633941526452
16.5194238963832
99.9683621226952
-11.4657911034856
-154.994356096012
159.55889212197
-386.294083744497
116.000776410328
104.678381526604
-69.6122732296195
-105.268826004316
-131.884769903131
172.202934095672
66.9081327652383
-245.518291725945
140.312677048424
154.101389898298
58.362774994699
-220.717915570695
170.211615178087
53.8104105632492
254.586467215197
-222.382479859325
-158.067279541953
134.04600644941
244.91411260035
158.951430274918
753.122647930544
525.344032986513
-116.145298800365
70.951858756207
-128.275500567857
-119.537497623531
476.486591876196
-111.655781447578
-2.21145854560156
-58.9247361066238
-605.548596867539
35.916307865424
93.4928139194853
44.0714343085243
-75.1490730005277
-73.6683101364857
-362.772752217563
46.1557056099382
-290.849766381798
-98.9311074498651
206.646409078145
-84.853589036995
-127.087368825287
18.8963715052704
31.2834241642847
-51.2284445540043
-217.873120388666
-360.312848740823
-233.849290032512
163.974336462838
218.247568967975
271.88908319339
-152.768054251307
-220.151486454335
-196.793298617159
-15.6334451936838


Parameters (Session):
par1 = FALSE ; par2 = 1 ; par3 = 0 ; par4 = 1 ; par5 = 12 ; par6 = 3 ; par7 = 1 ; par8 = 2 ; par9 = 1 ;
Parameters (R input):
par1 = FALSE ; par2 = 1 ; par3 = 0 ; par4 = 1 ; par5 = 12 ; par6 = 3 ; par7 = 1 ; par8 = 2 ; par9 = 1 ;
R code (references can be found in the software module):
library(lattice)
if (par1 == 'TRUE') par1 <- TRUE
if (par1 == 'FALSE') par1 <- FALSE
par2 <- as.numeric(par2) #Box-Cox lambda transformation parameter
par3 <- as.numeric(par3) #degree of non-seasonal differencing
par4 <- as.numeric(par4) #degree of seasonal differencing
par5 <- as.numeric(par5) #seasonal period
par6 <- as.numeric(par6) #degree (p) of the non-seasonal AR(p) polynomial
par7 <- as.numeric(par7) #degree (q) of the non-seasonal MA(q) polynomial
par8 <- as.numeric(par8) #degree (P) of the seasonal AR(P) polynomial
par9 <- as.numeric(par9) #degree (Q) of the seasonal MA(Q) polynomial
armaGR <- function(arima.out, names, n){
try1 <- arima.out$coef
try2 <- sqrt(diag(arima.out$var.coef))
try.data.frame <- data.frame(matrix(NA,ncol=4,nrow=length(names)))
dimnames(try.data.frame) <- list(names,c('coef','std','tstat','pv'))
try.data.frame[,1] <- try1
for(i in 1:length(try2)) try.data.frame[which(rownames(try.data.frame)==names(try2)[i]),2] <- try2[i]
try.data.frame[,3] <- try.data.frame[,1] / try.data.frame[,2]
try.data.frame[,4] <- round((1-pt(abs(try.data.frame[,3]),df=n-(length(try2)+1)))*2,5)
vector <- rep(NA,length(names))
vector[is.na(try.data.frame[,4])] <- 0
maxi <- which.max(try.data.frame[,4])
continue <- max(try.data.frame[,4],na.rm=TRUE) > .05
vector[maxi] <- 0
list(summary=try.data.frame,next.vector=vector,continue=continue)
}
arimaSelect <- function(series, order=c(13,0,0), seasonal=list(order=c(2,0,0),period=12), include.mean=F){
nrc <- order[1]+order[3]+seasonal$order[1]+seasonal$order[3]
coeff <- matrix(NA, nrow=nrc*2, ncol=nrc)
pval <- matrix(NA, nrow=nrc*2, ncol=nrc)
mylist <- rep(list(NULL), nrc)
names <- NULL
if(order[1] > 0) names <- paste('ar',1:order[1],sep='')
if(order[3] > 0) names <- c( names , paste('ma',1:order[3],sep='') )
if(seasonal$order[1] > 0) names <- c(names, paste('sar',1:seasonal$order[1],sep=''))
if(seasonal$order[3] > 0) names <- c(names, paste('sma',1:seasonal$order[3],sep=''))
arima.out <- arima(series, order=order, seasonal=seasonal, include.mean=include.mean, method='ML')
mylist[[1]] <- arima.out
last.arma <- armaGR(arima.out, names, length(series))
mystop <- FALSE
i <- 1
coeff[i,] <- last.arma[[1]][,1]
pval [i,] <- last.arma[[1]][,4]
i <- 2
aic <- arima.out$aic
while(!mystop){
mylist[[i]] <- arima.out
arima.out <- arima(series, order=order, seasonal=seasonal, include.mean=include.mean, method='ML', fixed=last.arma$next.vector)
aic <- c(aic, arima.out$aic)
last.arma <- armaGR(arima.out, names, length(series))
mystop <- !last.arma$continue
coeff[i,] <- last.arma[[1]][,1]
pval [i,] <- last.arma[[1]][,4]
i <- i+1
}
list(coeff, pval, mylist, aic=aic)
}
arimaSelectplot <- function(arimaSelect.out,noms,choix){
noms <- names(arimaSelect.out[[3]][[1]]$coef)
coeff <- arimaSelect.out[[1]]
k <- min(which(is.na(coeff[,1])))-1
coeff <- coeff[1:k,]
pval <- arimaSelect.out[[2]][1:k,]
aic <- arimaSelect.out$aic[1:k]
coeff[coeff==0] <- NA
n <- ncol(coeff)
if(missing(choix)) choix <- k
layout(matrix(c(1,1,1,2,
3,3,3,2,
3,3,3,4,
5,6,7,7),nr=4),
widths=c(10,35,45,15),
heights=c(30,30,15,15))
couleurs <- rainbow(75)[1:50]#(50)
ticks <- pretty(coeff)
par(mar=c(1,1,3,1))
plot(aic,k:1-.5,type='o',pch=21,bg='blue',cex=2,axes=F,lty=2,xpd=NA)
points(aic[choix],k-choix+.5,pch=21,cex=4,bg=2,xpd=NA)
title('aic',line=2)
par(mar=c(3,0,0,0))
plot(0,axes=F,xlab='',ylab='',xlim=range(ticks),ylim=c(.1,1))
rect(xleft = min(ticks) + (0:49)/50*(max(ticks)-min(ticks)),
xright = min(ticks) + (1:50)/50*(max(ticks)-min(ticks)),
ytop = rep(1,50),
ybottom= rep(0,50),col=couleurs,border=NA)
axis(1,ticks)
rect(xleft=min(ticks),xright=max(ticks),ytop=1,ybottom=0)
text(mean(coeff,na.rm=T),.5,'coefficients',cex=2,font=2)
par(mar=c(1,1,3,1))
image(1:n,1:k,t(coeff[k:1,]),axes=F,col=couleurs,zlim=range(ticks))
for(i in 1:n) for(j in 1:k) if(!is.na(coeff[j,i])) {
if(pval[j,i]<.01) symb = 'green'
else if( (pval[j,i]<.05) & (pval[j,i]>=.01)) symb = 'orange'
else if( (pval[j,i]<.1) & (pval[j,i]>=.05)) symb = 'red'
else symb = 'black'
polygon(c(i+.5 ,i+.2 ,i+.5 ,i+.5),
c(k-j+0.5,k-j+0.5,k-j+0.8,k-j+0.5),
col=symb)
if(j==choix) {
rect(xleft=i-.5,
xright=i+.5,
ybottom=k-j+1.5,
ytop=k-j+.5,
lwd=4)
text(i,
k-j+1,
round(coeff[j,i],2),
cex=1.2,
font=2)
}
else{
rect(xleft=i-.5,xright=i+.5,ybottom=k-j+1.5,ytop=k-j+.5)
text(i,k-j+1,round(coeff[j,i],2),cex=1.2,font=1)
}
}
axis(3,1:n,noms)
par(mar=c(0.5,0,0,0.5))
plot(0,axes=F,xlab='',ylab='',type='n',xlim=c(0,8),ylim=c(-.2,.8))
cols <- c('green','orange','red','black')
niv <- c('0','0.01','0.05','0.1')
for(i in 0:3){
polygon(c(1+2*i ,1+2*i ,1+2*i-.5 ,1+2*i),
c(.4 ,.7 , .4 , .4),
col=cols[i+1])
text(2*i,0.5,niv[i+1],cex=1.5)
}
text(8,.5,1,cex=1.5)
text(4,0,'p-value',cex=2)
box()
residus <- arimaSelect.out[[3]][[choix]]$res
par(mar=c(1,2,4,1))
acf(residus,main='')
title('acf',line=.5)
par(mar=c(1,2,4,1))
pacf(residus,main='')
title('pacf',line=.5)
par(mar=c(2,2,4,1))
qqnorm(residus,main='')
title('qq-norm',line=.5)
qqline(residus)
residus
}
if (par2 == 0) x <- log(x)
if (par2 != 0) x <- x^par2
(selection <- arimaSelect(x, order=c(par6,par3,par7), seasonal=list(order=c(par8,par4,par9), period=par5)))
bitmap(file='test1.png')
resid <- arimaSelectplot(selection)
dev.off()
resid
bitmap(file='test2.png')
acf(resid,length(resid)/2, main='Residual Autocorrelation Function')
dev.off()
bitmap(file='test3.png')
pacf(resid,length(resid)/2, main='Residual Partial Autocorrelation Function')
dev.off()
bitmap(file='test4.png')
cpgram(resid, main='Residual Cumulative Periodogram')
dev.off()
bitmap(file='test5.png')
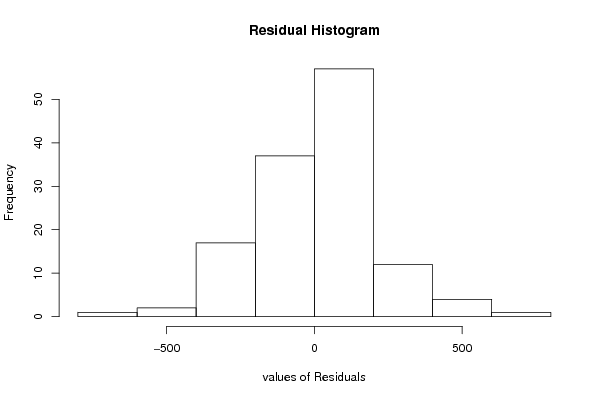
hist(resid, main='Residual Histogram', xlab='values of Residuals')
dev.off()
bitmap(file='test6.png')
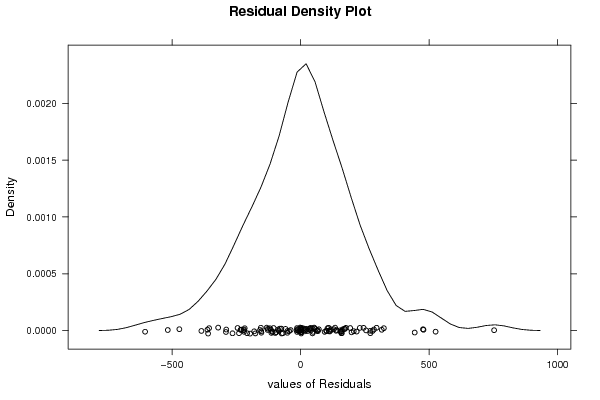
densityplot(~resid,col='black',main='Residual Density Plot', xlab='values of Residuals')
dev.off()
bitmap(file='test7.png')
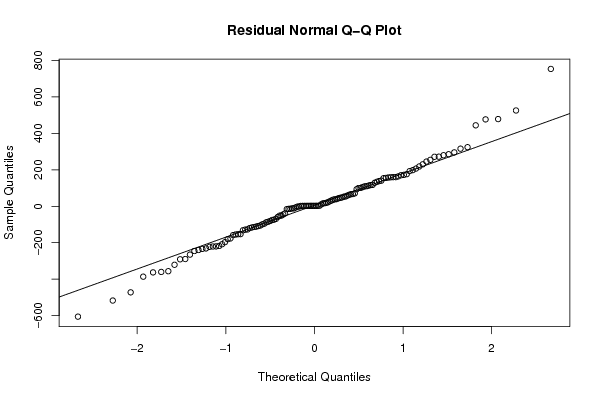
qqnorm(resid, main='Residual Normal Q-Q Plot')
qqline(resid)
dev.off()
ncols <- length(selection[[1]][1,])
nrows <- length(selection[[2]][,1])-1
load(file='createtable')
a<-table.start()
a<-table.row.start(a)
a<-table.element(a,'ARIMA Parameter Estimation and Backward Selection', ncols+1,TRUE)
a<-table.row.end(a)
a<-table.row.start(a)
a<-table.element(a,'Iteration', header=TRUE)
for (i in 1:ncols) {
a<-table.element(a,names(selection[[3]][[1]]$coef)[i],header=TRUE)
}
a<-table.row.end(a)
for (j in 1:nrows) {
a<-table.row.start(a)
mydum <- 'Estimates ('
mydum <- paste(mydum,j)
mydum <- paste(mydum,')')
a<-table.element(a,mydum, header=TRUE)
for (i in 1:ncols) {
a<-table.element(a,round(selection[[1]][j,i],4))
}
a<-table.row.end(a)
a<-table.row.start(a)
a<-table.element(a,'(p-val)', header=TRUE)
for (i in 1:ncols) {
mydum <- '('
mydum <- paste(mydum,round(selection[[2]][j,i],4),sep='')
mydum <- paste(mydum,')')
a<-table.element(a,mydum)
}
a<-table.row.end(a)
}
a<-table.end(a)
table.save(a,file='mytable.tab')
a<-table.start()
a<-table.row.start(a)
a<-table.element(a,'Estimated ARIMA Residuals', 1,TRUE)
a<-table.row.end(a)
a<-table.row.start(a)
a<-table.element(a,'Value', 1,TRUE)
a<-table.row.end(a)
for (i in (par4*par5+par3):length(resid)) {
a<-table.row.start(a)
a<-table.element(a,resid[i])
a<-table.row.end(a)
}
a<-table.end(a)
table.save(a,file='mytable1.tab')