Free Statistics

of Irreproducible Research!

Author's title

Author*The author of this computation has been verified*
R Software Modulerwasp_arimabackwardselection.wasp
Title produced by softwareARIMA Backward Selection
Date of computationThu, 15 Dec 2011 13:08:18 -0500
Cite this page as followsStatistical Computations at FreeStatistics.org, Office for Research Development and Education, URL https://freestatistics.org/blog/index.php?v=date/2011/Dec/15/t1323972533pecmgmye0p8mhzg.htm/, Retrieved Wed, 08 May 2024 16:30:58 +0000
Statistical Computations at FreeStatistics.org, Office for Research Development and Education, URL https://freestatistics.org/blog/index.php?pk=155618, Retrieved Wed, 08 May 2024 16:30:58 +0000
QR Codes:

Original text written by user:
IsPrivate?No (this computation is public)
User-defined keywords
Estimated Impact81
Family? (F = Feedback message, R = changed R code, M = changed R Module, P = changed Parameters, D = changed Data)
-       [ARIMA Backward Selection] [ARIMA backw paper...] [2011-12-15 18:08:18] [0e2c18186cab982e7ba7b89fbe242e59] [Current]
Feedback Forum

Post a new message
Dataseries X:
1770
2203
2836
1976
2150
2180
2631
1781
2327
2260
2051
2250
2102
2957
2485
2871
2447
2570
2622
1840
2682
2369
2119
2531
2214
3206
2709
2734
2348
2702
2642
2064
2647
2534
2297
2718
2321
3112
2664
2808
2668
2934
2616
2228
2463
2416
2407
2582
2101
3305
2818
2401
3019
2507
2948
2210
2467
2596
2451
2233
2393
3122
2801
2656
2782
2604
2803
2178
2324
2536
2408
2261
2166
3243
2296
2719
2734
2297
2732
1904
2397
2473
1967
2471
2203
3053
2350
2807
2639
2646
2577
1860
2624
2590
2261
3342
2840
3328
3245
3025
2915
3579
2787
2397
3065
2154
2689
3187
2540
3469
3005
2573
2998
2768
2556
2414
2467
2136
2493
2735
2316
3042
2364
2248
2714
2583
2631
1965
2209
1964
2132


Summary of computational transaction
Raw Inputview raw input (R code)
Raw Outputview raw output of R engine
Computing time3 seconds
R Server'Gwilym Jenkins' @ jenkins.wessa.net

\begin{tabular}{lllllllll}
\hline
Summary of computational transaction \tabularnewline
Raw Input & view raw input (R code)  \tabularnewline
Raw Output & view raw output of R engine  \tabularnewline
Computing time & 3 seconds \tabularnewline
R Server & 'Gwilym Jenkins' @ jenkins.wessa.net \tabularnewline
\hline
\end{tabular}
%Source: https://freestatistics.org/blog/index.php?pk=155618&T=0

[TABLE]
[ROW][C]Summary of computational transaction[/C][/ROW]
[ROW][C]Raw Input[/C][C]view raw input (R code) [/C][/ROW]
[ROW][C]Raw Output[/C][C]view raw output of R engine [/C][/ROW]
[ROW][C]Computing time[/C][C]3 seconds[/C][/ROW]
[ROW][C]R Server[/C][C]'Gwilym Jenkins' @ jenkins.wessa.net[/C][/ROW]
[/TABLE]
Source: https://freestatistics.org/blog/index.php?pk=155618&T=0

Globally Unique Identifier (entire table): ba.freestatistics.org/blog/index.php?pk=155618&T=0

As an alternative you can also use a QR Code:  

The GUIDs for individual cells are displayed in the table below:

Summary of computational transaction
Raw Inputview raw input (R code)
Raw Outputview raw output of R engine
Computing time3 seconds
R Server'Gwilym Jenkins' @ jenkins.wessa.net


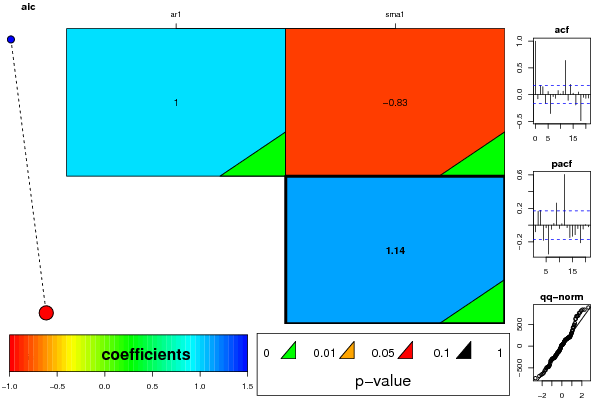
ARIMA Parameter Estimation and Backward Selection
Iterationar1sma1
Estimates ( 1 )0.9997-0.8348
(p-val)(0 )(0 )
Estimates ( 2 )01.1377
(p-val)(NA )(0 )
Estimates ( 3 )NANA
(p-val)(NA )(NA )

\begin{tabular}{lllllllll}
\hline
ARIMA Parameter Estimation and Backward Selection \tabularnewline
Iteration & ar1 & sma1 \tabularnewline
Estimates ( 1 ) & 0.9997 & -0.8348 \tabularnewline
(p-val) & (0 ) & (0 ) \tabularnewline
Estimates ( 2 ) & 0 & 1.1377 \tabularnewline
(p-val) & (NA ) & (0 ) \tabularnewline
Estimates ( 3 ) & NA & NA \tabularnewline
(p-val) & (NA ) & (NA ) \tabularnewline
\hline
\end{tabular}
%Source: https://freestatistics.org/blog/index.php?pk=155618&T=1

[TABLE]
[ROW][C]ARIMA Parameter Estimation and Backward Selection[/C][/ROW]
[ROW][C]Iteration[/C][C]ar1[/C][C]sma1[/C][/ROW]
[ROW][C]Estimates ( 1 )[/C][C]0.9997[/C][C]-0.8348[/C][/ROW]
[ROW][C](p-val)[/C][C](0 )[/C][C](0 )[/C][/ROW]
[ROW][C]Estimates ( 2 )[/C][C]0[/C][C]1.1377[/C][/ROW]
[ROW][C](p-val)[/C][C](NA )[/C][C](0 )[/C][/ROW]
[ROW][C]Estimates ( 3 )[/C][C]NA[/C][C]NA[/C][/ROW]
[ROW][C](p-val)[/C][C](NA )[/C][C](NA )[/C][/ROW]
[/TABLE]
Source: https://freestatistics.org/blog/index.php?pk=155618&T=1

Globally Unique Identifier (entire table): ba.freestatistics.org/blog/index.php?pk=155618&T=1

As an alternative you can also use a QR Code:  

The GUIDs for individual cells are displayed in the table below:

ARIMA Parameter Estimation and Backward Selection
Iterationar1sma1
Estimates ( 1 )0.9997-0.8348
(p-val)(0 )(0 )
Estimates ( 2 )01.1377
(p-val)(NA )(0 )
Estimates ( 3 )NANA
(p-val)(NA )(NA )


Estimated ARIMA Residuals
Value
276.055017061658
362.264589712578
765.7728796696
-274.181700512606
-36.7958275273778
1.30419555660417
444.242026863494
-479.050700830664
150.47690936851
57.9590948238326
-159.475710180676
66.9230237285119
-91.3478174830189
778.526302494412
177.849885201362
534.810632837417
23.1267926660707
143.080005514857
172.237275902814
-637.258578053179
310.684704468161
-52.7536803277894
-293.217489468669
167.944511270067
-175.941676415604
845.861191645688
210.202497069834
201.392615376092
-216.949647057275
173.684651590572
85.9079591135363
-505.387342653175
161.798627264215
22.967431235523
-216.96788638049
240.651787358416
-195.181084151145
628.847611035066
78.0212522583367
210.035358824133
36.2905821328666
297.199636513816
-68.9012852799281
-444.632952110056
-135.428186134753
-159.22198577308
-141.101163977195
58.0231896099335
-431.686929328974
844.336211394132
218.97836856226
-233.240311282916
424.102666804333
-156.932820581206
310.840679380633
-477.508879995725
-140.879382126702
12.2286637915739
-133.911819734637
-328.960181229525
-113.861960519926
634.757947805193
209.958773670827
31.2242995364758
152.96621684364
-49.3599754164579
158.676207697107
-491.586114516155
-263.642011493013
-7.30300253366774
-133.237338912488
-257.411688907433
-309.123226061783
819.675385120476
-261.629688885013
205.367413138949
187.363611635774
-279.661021861301
202.315052571714
-658.180118357957
-55.8088422495974
30.2225054588621
-479.932094121728
104.015364406359
-180.329909433903
700.205601181541
-117.428386645641
359.766097523158
133.286671413942
119.16293213088
31.3746946495866
-689.934999459696
188.667023439718
124.389805648278
-224.280844308282
894.534665070065
245.896974021729
694.239007716287
497.683831369977
196.569892784391
55.1230531301658
711.004841585347
-197.234872313898
-553.70892055671
206.571581759027
-737.513904720147
-79.952607865901
432.166036443204
-285.144532626469
691.819709381261
114.711956595894
-335.219376027069
146.028015316772
-107.07885428993
-300.452401300887
-391.953999238915
-273.388370403481
-558.390887778946
-108.425395368793
152.330318120064
-290.906753570275
483.933464502403
-272.977804129094
-343.083042990469
180.353245147741
20.4798922025761
65.9719662432048
-610.034626813084
-264.595936633676
-465.138311896625
-219.635685656227

\begin{tabular}{lllllllll}
\hline
Estimated ARIMA Residuals \tabularnewline
Value \tabularnewline
 \tabularnewline
276.055017061658 \tabularnewline
362.264589712578 \tabularnewline
765.7728796696 \tabularnewline
-274.181700512606 \tabularnewline
-36.7958275273778 \tabularnewline
1.30419555660417 \tabularnewline
444.242026863494 \tabularnewline
-479.050700830664 \tabularnewline
150.47690936851 \tabularnewline
57.9590948238326 \tabularnewline
-159.475710180676 \tabularnewline
66.9230237285119 \tabularnewline
-91.3478174830189 \tabularnewline
778.526302494412 \tabularnewline
177.849885201362 \tabularnewline
534.810632837417 \tabularnewline
23.1267926660707 \tabularnewline
143.080005514857 \tabularnewline
172.237275902814 \tabularnewline
-637.258578053179 \tabularnewline
310.684704468161 \tabularnewline
-52.7536803277894 \tabularnewline
-293.217489468669 \tabularnewline
167.944511270067 \tabularnewline
-175.941676415604 \tabularnewline
845.861191645688 \tabularnewline
210.202497069834 \tabularnewline
201.392615376092 \tabularnewline
-216.949647057275 \tabularnewline
173.684651590572 \tabularnewline
85.9079591135363 \tabularnewline
-505.387342653175 \tabularnewline
161.798627264215 \tabularnewline
22.967431235523 \tabularnewline
-216.96788638049 \tabularnewline
240.651787358416 \tabularnewline
-195.181084151145 \tabularnewline
628.847611035066 \tabularnewline
78.0212522583367 \tabularnewline
210.035358824133 \tabularnewline
36.2905821328666 \tabularnewline
297.199636513816 \tabularnewline
-68.9012852799281 \tabularnewline
-444.632952110056 \tabularnewline
-135.428186134753 \tabularnewline
-159.22198577308 \tabularnewline
-141.101163977195 \tabularnewline
58.0231896099335 \tabularnewline
-431.686929328974 \tabularnewline
844.336211394132 \tabularnewline
218.97836856226 \tabularnewline
-233.240311282916 \tabularnewline
424.102666804333 \tabularnewline
-156.932820581206 \tabularnewline
310.840679380633 \tabularnewline
-477.508879995725 \tabularnewline
-140.879382126702 \tabularnewline
12.2286637915739 \tabularnewline
-133.911819734637 \tabularnewline
-328.960181229525 \tabularnewline
-113.861960519926 \tabularnewline
634.757947805193 \tabularnewline
209.958773670827 \tabularnewline
31.2242995364758 \tabularnewline
152.96621684364 \tabularnewline
-49.3599754164579 \tabularnewline
158.676207697107 \tabularnewline
-491.586114516155 \tabularnewline
-263.642011493013 \tabularnewline
-7.30300253366774 \tabularnewline
-133.237338912488 \tabularnewline
-257.411688907433 \tabularnewline
-309.123226061783 \tabularnewline
819.675385120476 \tabularnewline
-261.629688885013 \tabularnewline
205.367413138949 \tabularnewline
187.363611635774 \tabularnewline
-279.661021861301 \tabularnewline
202.315052571714 \tabularnewline
-658.180118357957 \tabularnewline
-55.8088422495974 \tabularnewline
30.2225054588621 \tabularnewline
-479.932094121728 \tabularnewline
104.015364406359 \tabularnewline
-180.329909433903 \tabularnewline
700.205601181541 \tabularnewline
-117.428386645641 \tabularnewline
359.766097523158 \tabularnewline
133.286671413942 \tabularnewline
119.16293213088 \tabularnewline
31.3746946495866 \tabularnewline
-689.934999459696 \tabularnewline
188.667023439718 \tabularnewline
124.389805648278 \tabularnewline
-224.280844308282 \tabularnewline
894.534665070065 \tabularnewline
245.896974021729 \tabularnewline
694.239007716287 \tabularnewline
497.683831369977 \tabularnewline
196.569892784391 \tabularnewline
55.1230531301658 \tabularnewline
711.004841585347 \tabularnewline
-197.234872313898 \tabularnewline
-553.70892055671 \tabularnewline
206.571581759027 \tabularnewline
-737.513904720147 \tabularnewline
-79.952607865901 \tabularnewline
432.166036443204 \tabularnewline
-285.144532626469 \tabularnewline
691.819709381261 \tabularnewline
114.711956595894 \tabularnewline
-335.219376027069 \tabularnewline
146.028015316772 \tabularnewline
-107.07885428993 \tabularnewline
-300.452401300887 \tabularnewline
-391.953999238915 \tabularnewline
-273.388370403481 \tabularnewline
-558.390887778946 \tabularnewline
-108.425395368793 \tabularnewline
152.330318120064 \tabularnewline
-290.906753570275 \tabularnewline
483.933464502403 \tabularnewline
-272.977804129094 \tabularnewline
-343.083042990469 \tabularnewline
180.353245147741 \tabularnewline
20.4798922025761 \tabularnewline
65.9719662432048 \tabularnewline
-610.034626813084 \tabularnewline
-264.595936633676 \tabularnewline
-465.138311896625 \tabularnewline
-219.635685656227 \tabularnewline
\hline
\end{tabular}
%Source: https://freestatistics.org/blog/index.php?pk=155618&T=2

[TABLE]
[ROW][C]Estimated ARIMA Residuals[/C][/ROW]
[ROW][C]Value[/C][/ROW]
[ROW][C][/C][/ROW]
[ROW][C]276.055017061658[/C][/ROW]
[ROW][C]362.264589712578[/C][/ROW]
[ROW][C]765.7728796696[/C][/ROW]
[ROW][C]-274.181700512606[/C][/ROW]
[ROW][C]-36.7958275273778[/C][/ROW]
[ROW][C]1.30419555660417[/C][/ROW]
[ROW][C]444.242026863494[/C][/ROW]
[ROW][C]-479.050700830664[/C][/ROW]
[ROW][C]150.47690936851[/C][/ROW]
[ROW][C]57.9590948238326[/C][/ROW]
[ROW][C]-159.475710180676[/C][/ROW]
[ROW][C]66.9230237285119[/C][/ROW]
[ROW][C]-91.3478174830189[/C][/ROW]
[ROW][C]778.526302494412[/C][/ROW]
[ROW][C]177.849885201362[/C][/ROW]
[ROW][C]534.810632837417[/C][/ROW]
[ROW][C]23.1267926660707[/C][/ROW]
[ROW][C]143.080005514857[/C][/ROW]
[ROW][C]172.237275902814[/C][/ROW]
[ROW][C]-637.258578053179[/C][/ROW]
[ROW][C]310.684704468161[/C][/ROW]
[ROW][C]-52.7536803277894[/C][/ROW]
[ROW][C]-293.217489468669[/C][/ROW]
[ROW][C]167.944511270067[/C][/ROW]
[ROW][C]-175.941676415604[/C][/ROW]
[ROW][C]845.861191645688[/C][/ROW]
[ROW][C]210.202497069834[/C][/ROW]
[ROW][C]201.392615376092[/C][/ROW]
[ROW][C]-216.949647057275[/C][/ROW]
[ROW][C]173.684651590572[/C][/ROW]
[ROW][C]85.9079591135363[/C][/ROW]
[ROW][C]-505.387342653175[/C][/ROW]
[ROW][C]161.798627264215[/C][/ROW]
[ROW][C]22.967431235523[/C][/ROW]
[ROW][C]-216.96788638049[/C][/ROW]
[ROW][C]240.651787358416[/C][/ROW]
[ROW][C]-195.181084151145[/C][/ROW]
[ROW][C]628.847611035066[/C][/ROW]
[ROW][C]78.0212522583367[/C][/ROW]
[ROW][C]210.035358824133[/C][/ROW]
[ROW][C]36.2905821328666[/C][/ROW]
[ROW][C]297.199636513816[/C][/ROW]
[ROW][C]-68.9012852799281[/C][/ROW]
[ROW][C]-444.632952110056[/C][/ROW]
[ROW][C]-135.428186134753[/C][/ROW]
[ROW][C]-159.22198577308[/C][/ROW]
[ROW][C]-141.101163977195[/C][/ROW]
[ROW][C]58.0231896099335[/C][/ROW]
[ROW][C]-431.686929328974[/C][/ROW]
[ROW][C]844.336211394132[/C][/ROW]
[ROW][C]218.97836856226[/C][/ROW]
[ROW][C]-233.240311282916[/C][/ROW]
[ROW][C]424.102666804333[/C][/ROW]
[ROW][C]-156.932820581206[/C][/ROW]
[ROW][C]310.840679380633[/C][/ROW]
[ROW][C]-477.508879995725[/C][/ROW]
[ROW][C]-140.879382126702[/C][/ROW]
[ROW][C]12.2286637915739[/C][/ROW]
[ROW][C]-133.911819734637[/C][/ROW]
[ROW][C]-328.960181229525[/C][/ROW]
[ROW][C]-113.861960519926[/C][/ROW]
[ROW][C]634.757947805193[/C][/ROW]
[ROW][C]209.958773670827[/C][/ROW]
[ROW][C]31.2242995364758[/C][/ROW]
[ROW][C]152.96621684364[/C][/ROW]
[ROW][C]-49.3599754164579[/C][/ROW]
[ROW][C]158.676207697107[/C][/ROW]
[ROW][C]-491.586114516155[/C][/ROW]
[ROW][C]-263.642011493013[/C][/ROW]
[ROW][C]-7.30300253366774[/C][/ROW]
[ROW][C]-133.237338912488[/C][/ROW]
[ROW][C]-257.411688907433[/C][/ROW]
[ROW][C]-309.123226061783[/C][/ROW]
[ROW][C]819.675385120476[/C][/ROW]
[ROW][C]-261.629688885013[/C][/ROW]
[ROW][C]205.367413138949[/C][/ROW]
[ROW][C]187.363611635774[/C][/ROW]
[ROW][C]-279.661021861301[/C][/ROW]
[ROW][C]202.315052571714[/C][/ROW]
[ROW][C]-658.180118357957[/C][/ROW]
[ROW][C]-55.8088422495974[/C][/ROW]
[ROW][C]30.2225054588621[/C][/ROW]
[ROW][C]-479.932094121728[/C][/ROW]
[ROW][C]104.015364406359[/C][/ROW]
[ROW][C]-180.329909433903[/C][/ROW]
[ROW][C]700.205601181541[/C][/ROW]
[ROW][C]-117.428386645641[/C][/ROW]
[ROW][C]359.766097523158[/C][/ROW]
[ROW][C]133.286671413942[/C][/ROW]
[ROW][C]119.16293213088[/C][/ROW]
[ROW][C]31.3746946495866[/C][/ROW]
[ROW][C]-689.934999459696[/C][/ROW]
[ROW][C]188.667023439718[/C][/ROW]
[ROW][C]124.389805648278[/C][/ROW]
[ROW][C]-224.280844308282[/C][/ROW]
[ROW][C]894.534665070065[/C][/ROW]
[ROW][C]245.896974021729[/C][/ROW]
[ROW][C]694.239007716287[/C][/ROW]
[ROW][C]497.683831369977[/C][/ROW]
[ROW][C]196.569892784391[/C][/ROW]
[ROW][C]55.1230531301658[/C][/ROW]
[ROW][C]711.004841585347[/C][/ROW]
[ROW][C]-197.234872313898[/C][/ROW]
[ROW][C]-553.70892055671[/C][/ROW]
[ROW][C]206.571581759027[/C][/ROW]
[ROW][C]-737.513904720147[/C][/ROW]
[ROW][C]-79.952607865901[/C][/ROW]
[ROW][C]432.166036443204[/C][/ROW]
[ROW][C]-285.144532626469[/C][/ROW]
[ROW][C]691.819709381261[/C][/ROW]
[ROW][C]114.711956595894[/C][/ROW]
[ROW][C]-335.219376027069[/C][/ROW]
[ROW][C]146.028015316772[/C][/ROW]
[ROW][C]-107.07885428993[/C][/ROW]
[ROW][C]-300.452401300887[/C][/ROW]
[ROW][C]-391.953999238915[/C][/ROW]
[ROW][C]-273.388370403481[/C][/ROW]
[ROW][C]-558.390887778946[/C][/ROW]
[ROW][C]-108.425395368793[/C][/ROW]
[ROW][C]152.330318120064[/C][/ROW]
[ROW][C]-290.906753570275[/C][/ROW]
[ROW][C]483.933464502403[/C][/ROW]
[ROW][C]-272.977804129094[/C][/ROW]
[ROW][C]-343.083042990469[/C][/ROW]
[ROW][C]180.353245147741[/C][/ROW]
[ROW][C]20.4798922025761[/C][/ROW]
[ROW][C]65.9719662432048[/C][/ROW]
[ROW][C]-610.034626813084[/C][/ROW]
[ROW][C]-264.595936633676[/C][/ROW]
[ROW][C]-465.138311896625[/C][/ROW]
[ROW][C]-219.635685656227[/C][/ROW]
[/TABLE]
Source: https://freestatistics.org/blog/index.php?pk=155618&T=2

Globally Unique Identifier (entire table): ba.freestatistics.org/blog/index.php?pk=155618&T=2

As an alternative you can also use a QR Code:  

The GUIDs for individual cells are displayed in the table below:

Estimated ARIMA Residuals
Value
276.055017061658
362.264589712578
765.7728796696
-274.181700512606
-36.7958275273778
1.30419555660417
444.242026863494
-479.050700830664
150.47690936851
57.9590948238326
-159.475710180676
66.9230237285119
-91.3478174830189
778.526302494412
177.849885201362
534.810632837417
23.1267926660707
143.080005514857
172.237275902814
-637.258578053179
310.684704468161
-52.7536803277894
-293.217489468669
167.944511270067
-175.941676415604
845.861191645688
210.202497069834
201.392615376092
-216.949647057275
173.684651590572
85.9079591135363
-505.387342653175
161.798627264215
22.967431235523
-216.96788638049
240.651787358416
-195.181084151145
628.847611035066
78.0212522583367
210.035358824133
36.2905821328666
297.199636513816
-68.9012852799281
-444.632952110056
-135.428186134753
-159.22198577308
-141.101163977195
58.0231896099335
-431.686929328974
844.336211394132
218.97836856226
-233.240311282916
424.102666804333
-156.932820581206
310.840679380633
-477.508879995725
-140.879382126702
12.2286637915739
-133.911819734637
-328.960181229525
-113.861960519926
634.757947805193
209.958773670827
31.2242995364758
152.96621684364
-49.3599754164579
158.676207697107
-491.586114516155
-263.642011493013
-7.30300253366774
-133.237338912488
-257.411688907433
-309.123226061783
819.675385120476
-261.629688885013
205.367413138949
187.363611635774
-279.661021861301
202.315052571714
-658.180118357957
-55.8088422495974
30.2225054588621
-479.932094121728
104.015364406359
-180.329909433903
700.205601181541
-117.428386645641
359.766097523158
133.286671413942
119.16293213088
31.3746946495866
-689.934999459696
188.667023439718
124.389805648278
-224.280844308282
894.534665070065
245.896974021729
694.239007716287
497.683831369977
196.569892784391
55.1230531301658
711.004841585347
-197.234872313898
-553.70892055671
206.571581759027
-737.513904720147
-79.952607865901
432.166036443204
-285.144532626469
691.819709381261
114.711956595894
-335.219376027069
146.028015316772
-107.07885428993
-300.452401300887
-391.953999238915
-273.388370403481
-558.390887778946
-108.425395368793
152.330318120064
-290.906753570275
483.933464502403
-272.977804129094
-343.083042990469
180.353245147741
20.4798922025761
65.9719662432048
-610.034626813084
-264.595936633676
-465.138311896625
-219.635685656227


Parameters (Session):
par1 = FALSE ; par2 = 1 ; par3 = 0 ; par4 = 0 ; par5 = 1 ; par6 = 1 ; par7 = 0 ; par8 = 0 ; par9 = 1 ;
Parameters (R input):
par1 = FALSE ; par2 = 1 ; par3 = 0 ; par4 = 0 ; par5 = 1 ; par6 = 1 ; par7 = 0 ; par8 = 0 ; par9 = 1 ;
R code (references can be found in the software module):
library(lattice)
if (par1 == 'TRUE') par1 <- TRUE
if (par1 == 'FALSE') par1 <- FALSE
par2 <- as.numeric(par2) #Box-Cox lambda transformation parameter
par3 <- as.numeric(par3) #degree of non-seasonal differencing
par4 <- as.numeric(par4) #degree of seasonal differencing
par5 <- as.numeric(par5) #seasonal period
par6 <- as.numeric(par6) #degree (p) of the non-seasonal AR(p) polynomial
par7 <- as.numeric(par7) #degree (q) of the non-seasonal MA(q) polynomial
par8 <- as.numeric(par8) #degree (P) of the seasonal AR(P) polynomial
par9 <- as.numeric(par9) #degree (Q) of the seasonal MA(Q) polynomial
armaGR <- function(arima.out, names, n){
try1 <- arima.out$coef
try2 <- sqrt(diag(arima.out$var.coef))
try.data.frame <- data.frame(matrix(NA,ncol=4,nrow=length(names)))
dimnames(try.data.frame) <- list(names,c('coef','std','tstat','pv'))
try.data.frame[,1] <- try1
for(i in 1:length(try2)) try.data.frame[which(rownames(try.data.frame)==names(try2)[i]),2] <- try2[i]
try.data.frame[,3] <- try.data.frame[,1] / try.data.frame[,2]
try.data.frame[,4] <- round((1-pt(abs(try.data.frame[,3]),df=n-(length(try2)+1)))*2,5)
vector <- rep(NA,length(names))
vector[is.na(try.data.frame[,4])] <- 0
maxi <- which.max(try.data.frame[,4])
continue <- max(try.data.frame[,4],na.rm=TRUE) > .05
vector[maxi] <- 0
list(summary=try.data.frame,next.vector=vector,continue=continue)
}
arimaSelect <- function(series, order=c(13,0,0), seasonal=list(order=c(2,0,0),period=12), include.mean=F){
nrc <- order[1]+order[3]+seasonal$order[1]+seasonal$order[3]
coeff <- matrix(NA, nrow=nrc*2, ncol=nrc)
pval <- matrix(NA, nrow=nrc*2, ncol=nrc)
mylist <- rep(list(NULL), nrc)
names <- NULL
if(order[1] > 0) names <- paste('ar',1:order[1],sep='')
if(order[3] > 0) names <- c( names , paste('ma',1:order[3],sep='') )
if(seasonal$order[1] > 0) names <- c(names, paste('sar',1:seasonal$order[1],sep=''))
if(seasonal$order[3] > 0) names <- c(names, paste('sma',1:seasonal$order[3],sep=''))
arima.out <- arima(series, order=order, seasonal=seasonal, include.mean=include.mean, method='ML')
mylist[[1]] <- arima.out
last.arma <- armaGR(arima.out, names, length(series))
mystop <- FALSE
i <- 1
coeff[i,] <- last.arma[[1]][,1]
pval [i,] <- last.arma[[1]][,4]
i <- 2
aic <- arima.out$aic
while(!mystop){
mylist[[i]] <- arima.out
arima.out <- arima(series, order=order, seasonal=seasonal, include.mean=include.mean, method='ML', fixed=last.arma$next.vector)
aic <- c(aic, arima.out$aic)
last.arma <- armaGR(arima.out, names, length(series))
mystop <- !last.arma$continue
coeff[i,] <- last.arma[[1]][,1]
pval [i,] <- last.arma[[1]][,4]
i <- i+1
}
list(coeff, pval, mylist, aic=aic)
}
arimaSelectplot <- function(arimaSelect.out,noms,choix){
noms <- names(arimaSelect.out[[3]][[1]]$coef)
coeff <- arimaSelect.out[[1]]
k <- min(which(is.na(coeff[,1])))-1
coeff <- coeff[1:k,]
pval <- arimaSelect.out[[2]][1:k,]
aic <- arimaSelect.out$aic[1:k]
coeff[coeff==0] <- NA
n <- ncol(coeff)
if(missing(choix)) choix <- k
layout(matrix(c(1,1,1,2,
3,3,3,2,
3,3,3,4,
5,6,7,7),nr=4),
widths=c(10,35,45,15),
heights=c(30,30,15,15))
couleurs <- rainbow(75)[1:50]#(50)
ticks <- pretty(coeff)
par(mar=c(1,1,3,1))
plot(aic,k:1-.5,type='o',pch=21,bg='blue',cex=2,axes=F,lty=2,xpd=NA)
points(aic[choix],k-choix+.5,pch=21,cex=4,bg=2,xpd=NA)
title('aic',line=2)
par(mar=c(3,0,0,0))
plot(0,axes=F,xlab='',ylab='',xlim=range(ticks),ylim=c(.1,1))
rect(xleft = min(ticks) + (0:49)/50*(max(ticks)-min(ticks)),
xright = min(ticks) + (1:50)/50*(max(ticks)-min(ticks)),
ytop = rep(1,50),
ybottom= rep(0,50),col=couleurs,border=NA)
axis(1,ticks)
rect(xleft=min(ticks),xright=max(ticks),ytop=1,ybottom=0)
text(mean(coeff,na.rm=T),.5,'coefficients',cex=2,font=2)
par(mar=c(1,1,3,1))
image(1:n,1:k,t(coeff[k:1,]),axes=F,col=couleurs,zlim=range(ticks))
for(i in 1:n) for(j in 1:k) if(!is.na(coeff[j,i])) {
if(pval[j,i]<.01) symb = 'green'
else if( (pval[j,i]<.05) & (pval[j,i]>=.01)) symb = 'orange'
else if( (pval[j,i]<.1) & (pval[j,i]>=.05)) symb = 'red'
else symb = 'black'
polygon(c(i+.5 ,i+.2 ,i+.5 ,i+.5),
c(k-j+0.5,k-j+0.5,k-j+0.8,k-j+0.5),
col=symb)
if(j==choix) {
rect(xleft=i-.5,
xright=i+.5,
ybottom=k-j+1.5,
ytop=k-j+.5,
lwd=4)
text(i,
k-j+1,
round(coeff[j,i],2),
cex=1.2,
font=2)
}
else{
rect(xleft=i-.5,xright=i+.5,ybottom=k-j+1.5,ytop=k-j+.5)
text(i,k-j+1,round(coeff[j,i],2),cex=1.2,font=1)
}
}
axis(3,1:n,noms)
par(mar=c(0.5,0,0,0.5))
plot(0,axes=F,xlab='',ylab='',type='n',xlim=c(0,8),ylim=c(-.2,.8))
cols <- c('green','orange','red','black')
niv <- c('0','0.01','0.05','0.1')
for(i in 0:3){
polygon(c(1+2*i ,1+2*i ,1+2*i-.5 ,1+2*i),
c(.4 ,.7 , .4 , .4),
col=cols[i+1])
text(2*i,0.5,niv[i+1],cex=1.5)
}
text(8,.5,1,cex=1.5)
text(4,0,'p-value',cex=2)
box()
residus <- arimaSelect.out[[3]][[choix]]$res
par(mar=c(1,2,4,1))
acf(residus,main='')
title('acf',line=.5)
par(mar=c(1,2,4,1))
pacf(residus,main='')
title('pacf',line=.5)
par(mar=c(2,2,4,1))
qqnorm(residus,main='')
title('qq-norm',line=.5)
qqline(residus)
residus
}
if (par2 == 0) x <- log(x)
if (par2 != 0) x <- x^par2
(selection <- arimaSelect(x, order=c(par6,par3,par7), seasonal=list(order=c(par8,par4,par9), period=par5)))
bitmap(file='test1.png')
resid <- arimaSelectplot(selection)
dev.off()
resid
bitmap(file='test2.png')
acf(resid,length(resid)/2, main='Residual Autocorrelation Function')
dev.off()
bitmap(file='test3.png')
pacf(resid,length(resid)/2, main='Residual Partial Autocorrelation Function')
dev.off()
bitmap(file='test4.png')
cpgram(resid, main='Residual Cumulative Periodogram')
dev.off()
bitmap(file='test5.png')
hist(resid, main='Residual Histogram', xlab='values of Residuals')
dev.off()
bitmap(file='test6.png')
densityplot(~resid,col='black',main='Residual Density Plot', xlab='values of Residuals')
dev.off()
bitmap(file='test7.png')
qqnorm(resid, main='Residual Normal Q-Q Plot')
qqline(resid)
dev.off()
ncols <- length(selection[[1]][1,])
nrows <- length(selection[[2]][,1])-1
load(file='createtable')
a<-table.start()
a<-table.row.start(a)
a<-table.element(a,'ARIMA Parameter Estimation and Backward Selection', ncols+1,TRUE)
a<-table.row.end(a)
a<-table.row.start(a)
a<-table.element(a,'Iteration', header=TRUE)
for (i in 1:ncols) {
a<-table.element(a,names(selection[[3]][[1]]$coef)[i],header=TRUE)
}
a<-table.row.end(a)
for (j in 1:nrows) {
a<-table.row.start(a)
mydum <- 'Estimates ('
mydum <- paste(mydum,j)
mydum <- paste(mydum,')')
a<-table.element(a,mydum, header=TRUE)
for (i in 1:ncols) {
a<-table.element(a,round(selection[[1]][j,i],4))
}
a<-table.row.end(a)
a<-table.row.start(a)
a<-table.element(a,'(p-val)', header=TRUE)
for (i in 1:ncols) {
mydum <- '('
mydum <- paste(mydum,round(selection[[2]][j,i],4),sep='')
mydum <- paste(mydum,')')
a<-table.element(a,mydum)
}
a<-table.row.end(a)
}
a<-table.end(a)
table.save(a,file='mytable.tab')
a<-table.start()
a<-table.row.start(a)
a<-table.element(a,'Estimated ARIMA Residuals', 1,TRUE)
a<-table.row.end(a)
a<-table.row.start(a)
a<-table.element(a,'Value', 1,TRUE)
a<-table.row.end(a)
for (i in (par4*par5+par3):length(resid)) {
a<-table.row.start(a)
a<-table.element(a,resid[i])
a<-table.row.end(a)
}
a<-table.end(a)
table.save(a,file='mytable1.tab')