Free Statistics

of Irreproducible Research!

Author's title

Author*The author of this computation has been verified*
R Software Modulerwasp_twosampletests_mean.wasp
Title produced by softwarePaired and Unpaired Two Samples Tests about the Mean
Date of computationThu, 15 Dec 2011 11:03:42 -0500
Cite this page as followsStatistical Computations at FreeStatistics.org, Office for Research Development and Education, URL https://freestatistics.org/blog/index.php?v=date/2011/Dec/15/t1323965098etzhb8mrv0ns1ih.htm/, Retrieved Thu, 09 May 2024 02:25:56 +0000
Statistical Computations at FreeStatistics.org, Office for Research Development and Education, URL https://freestatistics.org/blog/index.php?pk=155530, Retrieved Thu, 09 May 2024 02:25:56 +0000
QR Codes:

Original text written by user:
IsPrivate?No (this computation is public)
User-defined keywords
Estimated Impact80
Family? (F = Feedback message, R = changed R code, M = changed R Module, P = changed Parameters, D = changed Data)
-       [Paired and Unpaired Two Samples Tests about the Mean] [] [2011-12-15 16:03:42] [885a9dbaf162325773a0a0afdf9f947e] [Current]
Feedback Forum

Post a new message
Dataseries X:
10,17463007	14,36009776
11,70685947	11,30900293
0,336629956	12,45810893
12,81545815	13,50394283
18,48134929	7,219358341
19,15	7,381367182
11,98976509	15,26096233
15,96311694	3,165415029
12,36867636	11,78143911
17,85359417	9,277808364
13,33972078	14,22780485
17,43586247	13,3753608
7,971763963	9,487750499
16,49423975	15,21511671
9,589676646	10,42712012
13,0201353	17,84978648
18,30998406	15,89534882
5,311440585	12,55115438
16,14544025	11,43396085
9,61483208	15,53507626
6,97001928	14,52239325
17,8328823	13,89331579
10,43631816	9,712278591
12,49521893	14,12942504
13,13014142	12,89537363
12,5995365	12,1602659
16,89272827	13,01181689
15,95822221	13,29873685
17,44624506	7,775415068
13,36096345	13,28429728
11,70208318	15,11451039
12,6700532	13,74797244
9,942922584	16,42942616
12,47787034	8,584377305
16,1794073	16,47410685
11,34269609	10,83539947
10,61458743	14,48035784
13,63362964	9,817153316
19,3	5,345232896
14,17862044	14,39310875
12,13110302	12,87630593
14,29122225	10,76877965
15,90424527	10,49694082
15,30537883	8,443671407
12,71711954	8,407782836
10,1041787	13,94065255
15,10633448	6,16326461
14,97472539	14,43688293
13,14940394	17,77583855
8,803370342	12,2486023
11,37671367	11,45685566
16,48829016	1,153093302
15,28690517	17,35686844
15,87449367	5,224652076
8,991891655	5,238696901
14,52069002	12,60523152
10,73329293	17,98404039
12,11255989	15,30279334
13,12039076	16,2306506
11,17618446	11,17728596
9,852452086	17,64250157
10,83826353	14,43288916
10,01602482	9,841441509
9,98429329	13,10185804
13,90654664	12,78229154
17,43829448	9,841353028
14,13651406	12,52267132
12,95465875	12,85177133
6,405875596	13,17889823
13,00827743	9,459926349
8,843896805	13,14460233
14,95275123	5,679993974
9,985399433	13,621099
15,85289071	11,4493559
6,304871788	12,45612266
11,70744131	14,52255588
14,6847188	14,00916003
9,063740747	12,87917848
14,09669644	10,91453539
11,45807414	10,67710167
14,5766967	7,500506329
8,013459929	15,71511893
10,91719297	8,451414364
9,680449615	13,04281114
12,30631181	5,475735648
19,15	6,318561991
9,974038576	11,67102852
10,61396958	12,88262502
12,39969169	12,34103121
13,89235106	15,31887313
15,3368091	10,00450285
11,27570477	14,86835659
11,46890639	8,706868119
7,705473469	12,38401963
17,80919895	14,23699191
17,4519668	12,98177075
2,080910919	14,75112225
13,09820752	15,68212424
11,29135539	18,1400865
2,507172277	15,91867058
7,823664497	14,96179352
10,96662538	16,04078615
8,284173862	7,958769343
5,69261529	6,117022453
4,687276457	7,408636579
13,25987215	12,70501195
3,580093526	12,21180573
9,733116837	13,7541755
11,88651299	10,16398398
11,3271032	11,38027871
12,99614065	14,09406222
10,51715507	15,38882422
13,71616844	0,694512385
15,32447894	10,98992814
13,82274766	3,847727223
11,71158746	10,36537965
1,908370816	15,07282766
13,82088431	0,406821823
8,241327352	11,07449882
10,5053078	2,651799226
8,180917703	13,40079885
2,322655495	14,266541
12,28598307	11,1935173
12,54906448	9,43355457
13,11109062	2,298582242
11,7934321	11,55994194
10,81286184	16,70032444
3,068772109	14,84074833
9,674855276	17,38403831
11,39973018	15,73039586
7,166265475	19,36265885
13,46103292	11,32605381
9,81357389	7,851840967
NA	13,30225262
NA	17,89762797
NA	9,46320715
NA	17,41915883
NA	9,332238773
NA	13,4187927
NA	11,37725913
NA	8,702323456
NA	14,19611665
NA	14,3980936
NA	7,301383906
NA	15,72027262
NA	14,03405468
NA	14,75498272
NA	17,03707132
NA	0,498724543
NA	10,82410397
NA	13,99003257
NA	0,295218143
NA	1,833602184
NA	0,59944272
NA	6,512322257
NA	8,594439161


Summary of computational transaction
Raw Inputview raw input (R code)
Raw Outputview raw output of R engine
Computing time1 seconds
R Server'Herman Ole Andreas Wold' @ wold.wessa.net

\begin{tabular}{lllllllll}
\hline
Summary of computational transaction \tabularnewline
Raw Input & view raw input (R code)  \tabularnewline
Raw Output & view raw output of R engine  \tabularnewline
Computing time & 1 seconds \tabularnewline
R Server & 'Herman Ole Andreas Wold' @ wold.wessa.net \tabularnewline
\hline
\end{tabular}
%Source: https://freestatistics.org/blog/index.php?pk=155530&T=0

[TABLE]
[ROW][C]Summary of computational transaction[/C][/ROW]
[ROW][C]Raw Input[/C][C]view raw input (R code) [/C][/ROW]
[ROW][C]Raw Output[/C][C]view raw output of R engine [/C][/ROW]
[ROW][C]Computing time[/C][C]1 seconds[/C][/ROW]
[ROW][C]R Server[/C][C]'Herman Ole Andreas Wold' @ wold.wessa.net[/C][/ROW]
[/TABLE]
Source: https://freestatistics.org/blog/index.php?pk=155530&T=0

Globally Unique Identifier (entire table): ba.freestatistics.org/blog/index.php?pk=155530&T=0

As an alternative you can also use a QR Code:  

The GUIDs for individual cells are displayed in the table below:

Summary of computational transaction
Raw Inputview raw input (R code)
Raw Outputview raw output of R engine
Computing time1 seconds
R Server'Herman Ole Andreas Wold' @ wold.wessa.net


Two Sample t-test (unpaired)
Mean of Sample 111.8939309981654
Mean of Sample 211.6439213241538
t-stat0.527997137789755
df287
p-value0.59790931147836
H0 value0
Alternativetwo.sided
CI Level0.95
CI[-0.6819746758945,1.18199402391764]
F-test to compare two variances
F-stat0.8483702431557
df132
p-value0.330620193643695
H0 value1
Alternativetwo.sided
CI Level0.95
CI[0.61149913917169,1.18219559857318]

\begin{tabular}{lllllllll}
\hline
Two Sample t-test (unpaired) \tabularnewline
Mean of Sample 1 & 11.8939309981654 \tabularnewline
Mean of Sample 2 & 11.6439213241538 \tabularnewline
t-stat & 0.527997137789755 \tabularnewline
df & 287 \tabularnewline
p-value & 0.59790931147836 \tabularnewline
H0 value & 0 \tabularnewline
Alternative & two.sided \tabularnewline
CI Level & 0.95 \tabularnewline
CI & [-0.6819746758945,1.18199402391764] \tabularnewline
F-test to compare two variances \tabularnewline
F-stat & 0.8483702431557 \tabularnewline
df & 132 \tabularnewline
p-value & 0.330620193643695 \tabularnewline
H0 value & 1 \tabularnewline
Alternative & two.sided \tabularnewline
CI Level & 0.95 \tabularnewline
CI & [0.61149913917169,1.18219559857318] \tabularnewline
\hline
\end{tabular}
%Source: https://freestatistics.org/blog/index.php?pk=155530&T=1

[TABLE]
[ROW][C]Two Sample t-test (unpaired)[/C][/ROW]
[ROW][C]Mean of Sample 1[/C][C]11.8939309981654[/C][/ROW]
[ROW][C]Mean of Sample 2[/C][C]11.6439213241538[/C][/ROW]
[ROW][C]t-stat[/C][C]0.527997137789755[/C][/ROW]
[ROW][C]df[/C][C]287[/C][/ROW]
[ROW][C]p-value[/C][C]0.59790931147836[/C][/ROW]
[ROW][C]H0 value[/C][C]0[/C][/ROW]
[ROW][C]Alternative[/C][C]two.sided[/C][/ROW]
[ROW][C]CI Level[/C][C]0.95[/C][/ROW]
[ROW][C]CI[/C][C][-0.6819746758945,1.18199402391764][/C][/ROW]
[ROW][C]F-test to compare two variances[/C][/ROW]
[ROW][C]F-stat[/C][C]0.8483702431557[/C][/ROW]
[ROW][C]df[/C][C]132[/C][/ROW]
[ROW][C]p-value[/C][C]0.330620193643695[/C][/ROW]
[ROW][C]H0 value[/C][C]1[/C][/ROW]
[ROW][C]Alternative[/C][C]two.sided[/C][/ROW]
[ROW][C]CI Level[/C][C]0.95[/C][/ROW]
[ROW][C]CI[/C][C][0.61149913917169,1.18219559857318][/C][/ROW]
[/TABLE]
Source: https://freestatistics.org/blog/index.php?pk=155530&T=1

Globally Unique Identifier (entire table): ba.freestatistics.org/blog/index.php?pk=155530&T=1

As an alternative you can also use a QR Code:  

The GUIDs for individual cells are displayed in the table below:

Two Sample t-test (unpaired)
Mean of Sample 111.8939309981654
Mean of Sample 211.6439213241538
t-stat0.527997137789755
df287
p-value0.59790931147836
H0 value0
Alternativetwo.sided
CI Level0.95
CI[-0.6819746758945,1.18199402391764]
F-test to compare two variances
F-stat0.8483702431557
df132
p-value0.330620193643695
H0 value1
Alternativetwo.sided
CI Level0.95
CI[0.61149913917169,1.18219559857318]


Welch Two Sample t-test (unpaired)
Mean of Sample 111.8939309981654
Mean of Sample 211.6439213241538
t-stat0.531467600213204
df285.267794220848
p-value0.595508376588737
H0 value0
Alternativetwo.sided
CI Level0.95
CI[-0.675912662934718,1.17593201095785]

\begin{tabular}{lllllllll}
\hline
Welch Two Sample t-test (unpaired) \tabularnewline
Mean of Sample 1 & 11.8939309981654 \tabularnewline
Mean of Sample 2 & 11.6439213241538 \tabularnewline
t-stat & 0.531467600213204 \tabularnewline
df & 285.267794220848 \tabularnewline
p-value & 0.595508376588737 \tabularnewline
H0 value & 0 \tabularnewline
Alternative & two.sided \tabularnewline
CI Level & 0.95 \tabularnewline
CI & [-0.675912662934718,1.17593201095785] \tabularnewline
\hline
\end{tabular}
%Source: https://freestatistics.org/blog/index.php?pk=155530&T=2

[TABLE]
[ROW][C]Welch Two Sample t-test (unpaired)[/C][/ROW]
[ROW][C]Mean of Sample 1[/C][C]11.8939309981654[/C][/ROW]
[ROW][C]Mean of Sample 2[/C][C]11.6439213241538[/C][/ROW]
[ROW][C]t-stat[/C][C]0.531467600213204[/C][/ROW]
[ROW][C]df[/C][C]285.267794220848[/C][/ROW]
[ROW][C]p-value[/C][C]0.595508376588737[/C][/ROW]
[ROW][C]H0 value[/C][C]0[/C][/ROW]
[ROW][C]Alternative[/C][C]two.sided[/C][/ROW]
[ROW][C]CI Level[/C][C]0.95[/C][/ROW]
[ROW][C]CI[/C][C][-0.675912662934718,1.17593201095785][/C][/ROW]
[/TABLE]
Source: https://freestatistics.org/blog/index.php?pk=155530&T=2

Globally Unique Identifier (entire table): ba.freestatistics.org/blog/index.php?pk=155530&T=2

As an alternative you can also use a QR Code:  

The GUIDs for individual cells are displayed in the table below:

Welch Two Sample t-test (unpaired)
Mean of Sample 111.8939309981654
Mean of Sample 211.6439213241538
t-stat0.531467600213204
df285.267794220848
p-value0.595508376588737
H0 value0
Alternativetwo.sided
CI Level0.95
CI[-0.675912662934718,1.17593201095785]


Wicoxon rank sum test with continuity correction (unpaired)
W10359
p-value0.983662662843989
H0 value0
Alternativetwo.sided
Kolmogorov-Smirnov Test to compare Distributions of two Samples
KS Statistic0.0748505880084828
p-value0.816011337414002
Kolmogorov-Smirnov Test to compare Distributional Shape of two Samples
KS Statistic0.113456718719877
p-value0.313799247307719

\begin{tabular}{lllllllll}
\hline
Wicoxon rank sum test with continuity correction (unpaired) \tabularnewline
W & 10359 \tabularnewline
p-value & 0.983662662843989 \tabularnewline
H0 value & 0 \tabularnewline
Alternative & two.sided \tabularnewline
Kolmogorov-Smirnov Test to compare Distributions of two Samples \tabularnewline
KS Statistic & 0.0748505880084828 \tabularnewline
p-value & 0.816011337414002 \tabularnewline
Kolmogorov-Smirnov Test to compare Distributional Shape of two Samples \tabularnewline
KS Statistic & 0.113456718719877 \tabularnewline
p-value & 0.313799247307719 \tabularnewline
\hline
\end{tabular}
%Source: https://freestatistics.org/blog/index.php?pk=155530&T=3

[TABLE]
[ROW][C]Wicoxon rank sum test with continuity correction (unpaired)[/C][/ROW]
[ROW][C]W[/C][C]10359[/C][/ROW]
[ROW][C]p-value[/C][C]0.983662662843989[/C][/ROW]
[ROW][C]H0 value[/C][C]0[/C][/ROW]
[ROW][C]Alternative[/C][C]two.sided[/C][/ROW]
[ROW][C]Kolmogorov-Smirnov Test to compare Distributions of two Samples[/C][/ROW]
[ROW][C]KS Statistic[/C][C]0.0748505880084828[/C][/ROW]
[ROW][C]p-value[/C][C]0.816011337414002[/C][/ROW]
[ROW][C]Kolmogorov-Smirnov Test to compare Distributional Shape of two Samples[/C][/ROW]
[ROW][C]KS Statistic[/C][C]0.113456718719877[/C][/ROW]
[ROW][C]p-value[/C][C]0.313799247307719[/C][/ROW]
[/TABLE]
Source: https://freestatistics.org/blog/index.php?pk=155530&T=3

Globally Unique Identifier (entire table): ba.freestatistics.org/blog/index.php?pk=155530&T=3

As an alternative you can also use a QR Code:  

The GUIDs for individual cells are displayed in the table below:

Wicoxon rank sum test with continuity correction (unpaired)
W10359
p-value0.983662662843989
H0 value0
Alternativetwo.sided
Kolmogorov-Smirnov Test to compare Distributions of two Samples
KS Statistic0.0748505880084828
p-value0.816011337414002
Kolmogorov-Smirnov Test to compare Distributional Shape of two Samples
KS Statistic0.113456718719877
p-value0.313799247307719


Parameters (Session):
par1 = 1 ; par2 = 2 ; par3 = 0.95 ; par4 = two.sided ; par5 = unpaired ; par6 = 0.0 ;
Parameters (R input):
par1 = 1 ; par2 = 2 ; par3 = 0.95 ; par4 = two.sided ; par5 = unpaired ; par6 = 0.0 ;
R code (references can be found in the software module):
par1 <- as.numeric(par1) #column number of first sample
par2 <- as.numeric(par2) #column number of second sample
par3 <- as.numeric(par3) #confidence (= 1 - alpha)
if (par5 == 'unpaired') paired <- FALSE else paired <- TRUE
par6 <- as.numeric(par6) #H0
z <- t(y)
if (par1 == par2) stop('Please, select two different column numbers')
if (par1 < 1) stop('Please, select a column number greater than zero for the first sample')
if (par2 < 1) stop('Please, select a column number greater than zero for the second sample')
if (par1 > length(z[1,])) stop('The column number for the first sample should be smaller')
if (par2 > length(z[1,])) stop('The column number for the second sample should be smaller')
if (par3 <= 0) stop('The confidence level should be larger than zero')
if (par3 >= 1) stop('The confidence level should be smaller than zero')
(r.t <- t.test(z[,par1],z[,par2],var.equal=TRUE,alternative=par4,paired=paired,mu=par6,conf.level=par3))
(v.t <- var.test(z[,par1],z[,par2],conf.level=par3))
(r.w <- t.test(z[,par1],z[,par2],var.equal=FALSE,alternative=par4,paired=paired,mu=par6,conf.level=par3))
(w.t <- wilcox.test(z[,par1],z[,par2],alternative=par4,paired=paired,mu=par6,conf.level=par3))
(ks.t <- ks.test(z[,par1],z[,par2],alternative=par4))
m1 <- mean(z[,par1],na.rm=T)
m2 <- mean(z[,par2],na.rm=T)
mdiff <- m1 - m2
newsam1 <- z[!is.na(z[,par1]),par1]
newsam2 <- z[,par2]+mdiff
newsam2 <- newsam2[!is.na(newsam2)]
(ks1.t <- ks.test(newsam1,newsam2,alternative=par4))
mydf <- data.frame(cbind(z[,par1],z[,par2]))
colnames(mydf) <- c('Variable 1','Variable 2')
bitmap(file='test1.png')
boxplot(mydf, notch=TRUE, ylab='value',main=main)
dev.off()
bitmap(file='test2.png')
qqnorm(z[,par1],main='Normal QQplot - Variable 1')
qqline(z[,par1])
dev.off()
bitmap(file='test3.png')
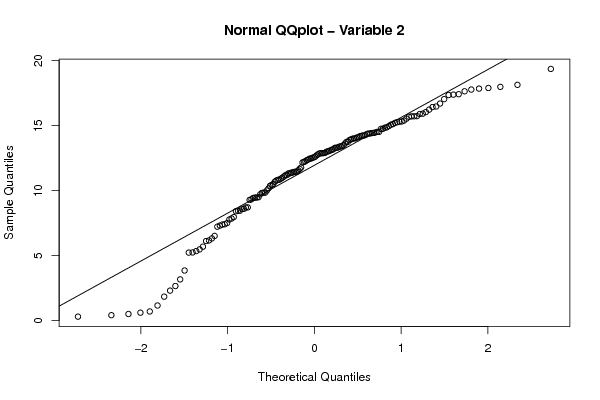
qqnorm(z[,par2],main='Normal QQplot - Variable 2')
qqline(z[,par2])
dev.off()
load(file='createtable')
a<-table.start()
a<-table.row.start(a)
a<-table.element(a,paste('Two Sample t-test (',par5,')',sep=''),2,TRUE)
a<-table.row.end(a)
if(!paired){
a<-table.row.start(a)
a<-table.element(a,'Mean of Sample 1',header=TRUE)
a<-table.element(a,r.t$estimate[[1]])
a<-table.row.end(a)
a<-table.row.start(a)
a<-table.element(a,'Mean of Sample 2',header=TRUE)
a<-table.element(a,r.t$estimate[[2]])
a<-table.row.end(a)
} else {
a<-table.row.start(a)
a<-table.element(a,'Difference: Mean1 - Mean2',header=TRUE)
a<-table.element(a,r.t$estimate)
a<-table.row.end(a)
}
a<-table.row.start(a)
a<-table.element(a,'t-stat',header=TRUE)
a<-table.element(a,r.t$statistic[[1]])
a<-table.row.end(a)
a<-table.row.start(a)
a<-table.element(a,'df',header=TRUE)
a<-table.element(a,r.t$parameter[[1]])
a<-table.row.end(a)
a<-table.row.start(a)
a<-table.element(a,'p-value',header=TRUE)
a<-table.element(a,r.t$p.value)
a<-table.row.end(a)
a<-table.row.start(a)
a<-table.element(a,'H0 value',header=TRUE)
a<-table.element(a,r.t$null.value[[1]])
a<-table.row.end(a)
a<-table.row.start(a)
a<-table.element(a,'Alternative',header=TRUE)
a<-table.element(a,r.t$alternative)
a<-table.row.end(a)
a<-table.row.start(a)
a<-table.element(a,'CI Level',header=TRUE)
a<-table.element(a,attr(r.t$conf.int,'conf.level'))
a<-table.row.end(a)
a<-table.row.start(a)
a<-table.element(a,'CI',header=TRUE)
a<-table.element(a,paste('[',r.t$conf.int[1],',',r.t$conf.int[2],']',sep=''))
a<-table.row.end(a)
a<-table.row.start(a)
a<-table.element(a,'F-test to compare two variances',2,TRUE)
a<-table.row.end(a)
a<-table.row.start(a)
a<-table.element(a,'F-stat',header=TRUE)
a<-table.element(a,v.t$statistic[[1]])
a<-table.row.end(a)
a<-table.row.start(a)
a<-table.element(a,'df',header=TRUE)
a<-table.element(a,v.t$parameter[[1]])
a<-table.row.end(a)
a<-table.row.start(a)
a<-table.element(a,'p-value',header=TRUE)
a<-table.element(a,v.t$p.value)
a<-table.row.end(a)
a<-table.row.start(a)
a<-table.element(a,'H0 value',header=TRUE)
a<-table.element(a,v.t$null.value[[1]])
a<-table.row.end(a)
a<-table.row.start(a)
a<-table.element(a,'Alternative',header=TRUE)
a<-table.element(a,v.t$alternative)
a<-table.row.end(a)
a<-table.row.start(a)
a<-table.element(a,'CI Level',header=TRUE)
a<-table.element(a,attr(v.t$conf.int,'conf.level'))
a<-table.row.end(a)
a<-table.row.start(a)
a<-table.element(a,'CI',header=TRUE)
a<-table.element(a,paste('[',v.t$conf.int[1],',',v.t$conf.int[2],']',sep=''))
a<-table.row.end(a)
a<-table.end(a)
table.save(a,file='mytable.tab')
a<-table.start()
a<-table.row.start(a)
a<-table.element(a,paste('Welch Two Sample t-test (',par5,')',sep=''),2,TRUE)
a<-table.row.end(a)
if(!paired){
a<-table.row.start(a)
a<-table.element(a,'Mean of Sample 1',header=TRUE)
a<-table.element(a,r.w$estimate[[1]])
a<-table.row.end(a)
a<-table.row.start(a)
a<-table.element(a,'Mean of Sample 2',header=TRUE)
a<-table.element(a,r.w$estimate[[2]])
a<-table.row.end(a)
} else {
a<-table.row.start(a)
a<-table.element(a,'Difference: Mean1 - Mean2',header=TRUE)
a<-table.element(a,r.w$estimate)
a<-table.row.end(a)
}
a<-table.row.start(a)
a<-table.element(a,'t-stat',header=TRUE)
a<-table.element(a,r.w$statistic[[1]])
a<-table.row.end(a)
a<-table.row.start(a)
a<-table.element(a,'df',header=TRUE)
a<-table.element(a,r.w$parameter[[1]])
a<-table.row.end(a)
a<-table.row.start(a)
a<-table.element(a,'p-value',header=TRUE)
a<-table.element(a,r.w$p.value)
a<-table.row.end(a)
a<-table.row.start(a)
a<-table.element(a,'H0 value',header=TRUE)
a<-table.element(a,r.w$null.value[[1]])
a<-table.row.end(a)
a<-table.row.start(a)
a<-table.element(a,'Alternative',header=TRUE)
a<-table.element(a,r.w$alternative)
a<-table.row.end(a)
a<-table.row.start(a)
a<-table.element(a,'CI Level',header=TRUE)
a<-table.element(a,attr(r.w$conf.int,'conf.level'))
a<-table.row.end(a)
a<-table.row.start(a)
a<-table.element(a,'CI',header=TRUE)
a<-table.element(a,paste('[',r.w$conf.int[1],',',r.w$conf.int[2],']',sep=''))
a<-table.row.end(a)
a<-table.end(a)
table.save(a,file='mytable1.tab')
a<-table.start()
a<-table.row.start(a)
a<-table.element(a,paste('Wicoxon rank sum test with continuity correction (',par5,')',sep=''),2,TRUE)
a<-table.row.end(a)
a<-table.row.start(a)
a<-table.element(a,'W',header=TRUE)
a<-table.element(a,w.t$statistic[[1]])
a<-table.row.end(a)
a<-table.row.start(a)
a<-table.element(a,'p-value',header=TRUE)
a<-table.element(a,w.t$p.value)
a<-table.row.end(a)
a<-table.row.start(a)
a<-table.element(a,'H0 value',header=TRUE)
a<-table.element(a,w.t$null.value[[1]])
a<-table.row.end(a)
a<-table.row.start(a)
a<-table.element(a,'Alternative',header=TRUE)
a<-table.element(a,w.t$alternative)
a<-table.row.end(a)
a<-table.row.start(a)
a<-table.element(a,'Kolmogorov-Smirnov Test to compare Distributions of two Samples',2,TRUE)
a<-table.row.end(a)
a<-table.row.start(a)
a<-table.element(a,'KS Statistic',header=TRUE)
a<-table.element(a,ks.t$statistic[[1]])
a<-table.row.end(a)
a<-table.row.start(a)
a<-table.element(a,'p-value',header=TRUE)
a<-table.element(a,ks.t$p.value)
a<-table.row.end(a)
a<-table.row.start(a)
a<-table.element(a,'Kolmogorov-Smirnov Test to compare Distributional Shape of two Samples',2,TRUE)
a<-table.row.end(a)
a<-table.row.start(a)
a<-table.element(a,'KS Statistic',header=TRUE)
a<-table.element(a,ks1.t$statistic[[1]])
a<-table.row.end(a)
a<-table.row.start(a)
a<-table.element(a,'p-value',header=TRUE)
a<-table.element(a,ks1.t$p.value)
a<-table.row.end(a)
a<-table.end(a)
table.save(a,file='mytable2.tab')