Free Statistics

of Irreproducible Research!

Author's title

Author*The author of this computation has been verified*
R Software Modulerwasp_autocorrelation.wasp
Title produced by software(Partial) Autocorrelation Function
Date of computationThu, 15 Dec 2011 10:18:56 -0500
Cite this page as followsStatistical Computations at FreeStatistics.org, Office for Research Development and Education, URL https://freestatistics.org/blog/index.php?v=date/2011/Dec/15/t1323962354pl61yp6nswzh8ua.htm/, Retrieved Wed, 08 May 2024 21:36:39 +0000
Statistical Computations at FreeStatistics.org, Office for Research Development and Education, URL https://freestatistics.org/blog/index.php?pk=155493, Retrieved Wed, 08 May 2024 21:36:39 +0000
QR Codes:

Original text written by user:
IsPrivate?No (this computation is public)
User-defined keywords
Estimated Impact99
Family? (F = Feedback message, R = changed R code, M = changed R Module, P = changed Parameters, D = changed Data)
-     [Kendall tau Correlation Matrix] [] [2010-12-05 17:44:33] [b98453cac15ba1066b407e146608df68]
- RMPD  [Kendall tau Correlation Matrix] [WS 10 - Pearson c...] [2010-12-10 16:13:49] [033eb2749a430605d9b2be7c4aac4a0c]
-         [Kendall tau Correlation Matrix] [] [2010-12-13 18:15:16] [d7b28a0391ab3b2ddc9f9fba95a43f33]
- RMPD      [(Partial) Autocorrelation Function] [] [2010-12-24 11:56:34] [b07cd1964830aab808142229b1166ece]
-   PD          [(Partial) Autocorrelation Function] [autocorrelatie pa...] [2011-12-15 15:18:56] [0e2c18186cab982e7ba7b89fbe242e59] [Current]
Feedback Forum

Post a new message
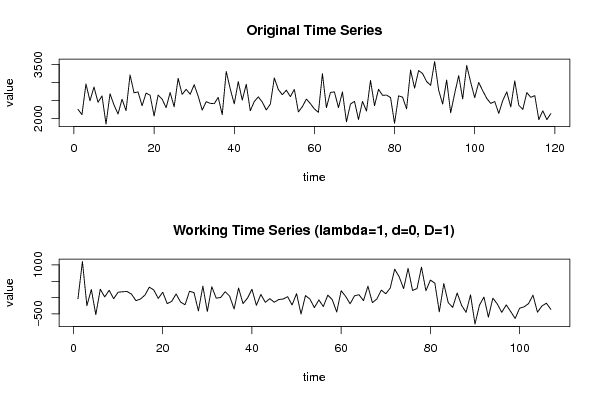
Dataseries X:
2250
2102
2957
2485
2871
2447
2622
1840
2682
2369
2119
2531
2214
3206
2709
2734
2348
2702
2642
2064
2647
2534
2297
2718
2321
3112
2664
2808
2668
2934
2616
2228
2463
2416
2407
2582
2101
3305
2818
2401
3019
2507
2948
2210
2467
2596
2451
2233
2393
3122
2801
2656
2782
2604
2803
2178
2324
2536
2408
2261
2166
3243
2296
2719
2734
2297
2732
1904
2397
2473
1967
2471
2203
3053
2350
2807
2639
2646
2577
1860
2624
2590
2261
3342
2840
3328
3245
3025
2915
3579
2787
2397
3065
2154
2689
3187
2540
3469
3005
2573
2998
2768
2556
2414
2467
2136
2493
2735
2316
3042
2364
2248
2714
2583
2631
1965
2209
1964
2132


Summary of computational transaction
Raw Inputview raw input (R code)
Raw Outputview raw output of R engine
Computing time2 seconds
R Server'George Udny Yule' @ yule.wessa.net

\begin{tabular}{lllllllll}
\hline
Summary of computational transaction \tabularnewline
Raw Input & view raw input (R code)  \tabularnewline
Raw Output & view raw output of R engine  \tabularnewline
Computing time & 2 seconds \tabularnewline
R Server & 'George Udny Yule' @ yule.wessa.net \tabularnewline
\hline
\end{tabular}
%Source: https://freestatistics.org/blog/index.php?pk=155493&T=0

[TABLE]
[ROW][C]Summary of computational transaction[/C][/ROW]
[ROW][C]Raw Input[/C][C]view raw input (R code) [/C][/ROW]
[ROW][C]Raw Output[/C][C]view raw output of R engine [/C][/ROW]
[ROW][C]Computing time[/C][C]2 seconds[/C][/ROW]
[ROW][C]R Server[/C][C]'George Udny Yule' @ yule.wessa.net[/C][/ROW]
[/TABLE]
Source: https://freestatistics.org/blog/index.php?pk=155493&T=0

Globally Unique Identifier (entire table): ba.freestatistics.org/blog/index.php?pk=155493&T=0

As an alternative you can also use a QR Code:  

The GUIDs for individual cells are displayed in the table below:

Summary of computational transaction
Raw Inputview raw input (R code)
Raw Outputview raw output of R engine
Computing time2 seconds
R Server'George Udny Yule' @ yule.wessa.net


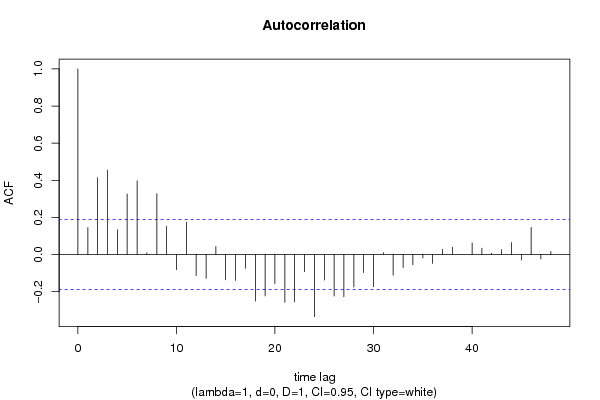
Autocorrelation Function
Time lag kACF(k)T-STATP-value
10.1451371.50130.068111
20.4143324.28592e-05
30.4549214.70574e-06
40.1334321.38020.085196
50.3265543.37790.00051
60.3973794.11053.9e-05
70.0101740.10520.45819
80.3274013.38670.000495
90.1530221.58290.058201
10-0.081125-0.83920.201625
110.1734511.79420.037803
12-0.112669-1.16550.123213
13-0.127674-1.32070.094714
140.0435290.45030.326715
15-0.135768-1.40440.081549
16-0.13923-1.44020.076365
17-0.074231-0.76780.222134
18-0.249965-2.58570.005532
19-0.222542-2.3020.011636
20-0.15622-1.6160.054524
21-0.257242-2.66090.004496
22-0.255122-2.6390.004778
23-0.092083-0.95250.17149
24-0.334525-3.46040.000388
25-0.13698-1.41690.079705
26-0.223104-2.30780.011467
27-0.227147-2.34960.010313
28-0.175243-1.81270.036339
29-0.096908-1.00240.1592
30-0.173593-1.79570.037686
310.0094710.0980.461072
32-0.111553-1.15390.125554
33-0.069157-0.71540.237972
34-0.055305-0.57210.284235
35-0.017943-0.18560.426552
36-0.047716-0.49360.311308
370.0283940.29370.384774
380.0394040.40760.34219
390.0002850.00290.498827
400.062750.64910.258835
410.0336980.34860.364045
420.0067860.07020.472084
430.0275870.28540.387958
440.0645110.66730.253007
45-0.029531-0.30550.380299
460.1456651.50680.067409
47-0.023264-0.24060.405145
480.0168460.17430.430997

\begin{tabular}{lllllllll}
\hline
Autocorrelation Function \tabularnewline
Time lag k & ACF(k) & T-STAT & P-value \tabularnewline
1 & 0.145137 & 1.5013 & 0.068111 \tabularnewline
2 & 0.414332 & 4.2859 & 2e-05 \tabularnewline
3 & 0.454921 & 4.7057 & 4e-06 \tabularnewline
4 & 0.133432 & 1.3802 & 0.085196 \tabularnewline
5 & 0.326554 & 3.3779 & 0.00051 \tabularnewline
6 & 0.397379 & 4.1105 & 3.9e-05 \tabularnewline
7 & 0.010174 & 0.1052 & 0.45819 \tabularnewline
8 & 0.327401 & 3.3867 & 0.000495 \tabularnewline
9 & 0.153022 & 1.5829 & 0.058201 \tabularnewline
10 & -0.081125 & -0.8392 & 0.201625 \tabularnewline
11 & 0.173451 & 1.7942 & 0.037803 \tabularnewline
12 & -0.112669 & -1.1655 & 0.123213 \tabularnewline
13 & -0.127674 & -1.3207 & 0.094714 \tabularnewline
14 & 0.043529 & 0.4503 & 0.326715 \tabularnewline
15 & -0.135768 & -1.4044 & 0.081549 \tabularnewline
16 & -0.13923 & -1.4402 & 0.076365 \tabularnewline
17 & -0.074231 & -0.7678 & 0.222134 \tabularnewline
18 & -0.249965 & -2.5857 & 0.005532 \tabularnewline
19 & -0.222542 & -2.302 & 0.011636 \tabularnewline
20 & -0.15622 & -1.616 & 0.054524 \tabularnewline
21 & -0.257242 & -2.6609 & 0.004496 \tabularnewline
22 & -0.255122 & -2.639 & 0.004778 \tabularnewline
23 & -0.092083 & -0.9525 & 0.17149 \tabularnewline
24 & -0.334525 & -3.4604 & 0.000388 \tabularnewline
25 & -0.13698 & -1.4169 & 0.079705 \tabularnewline
26 & -0.223104 & -2.3078 & 0.011467 \tabularnewline
27 & -0.227147 & -2.3496 & 0.010313 \tabularnewline
28 & -0.175243 & -1.8127 & 0.036339 \tabularnewline
29 & -0.096908 & -1.0024 & 0.1592 \tabularnewline
30 & -0.173593 & -1.7957 & 0.037686 \tabularnewline
31 & 0.009471 & 0.098 & 0.461072 \tabularnewline
32 & -0.111553 & -1.1539 & 0.125554 \tabularnewline
33 & -0.069157 & -0.7154 & 0.237972 \tabularnewline
34 & -0.055305 & -0.5721 & 0.284235 \tabularnewline
35 & -0.017943 & -0.1856 & 0.426552 \tabularnewline
36 & -0.047716 & -0.4936 & 0.311308 \tabularnewline
37 & 0.028394 & 0.2937 & 0.384774 \tabularnewline
38 & 0.039404 & 0.4076 & 0.34219 \tabularnewline
39 & 0.000285 & 0.0029 & 0.498827 \tabularnewline
40 & 0.06275 & 0.6491 & 0.258835 \tabularnewline
41 & 0.033698 & 0.3486 & 0.364045 \tabularnewline
42 & 0.006786 & 0.0702 & 0.472084 \tabularnewline
43 & 0.027587 & 0.2854 & 0.387958 \tabularnewline
44 & 0.064511 & 0.6673 & 0.253007 \tabularnewline
45 & -0.029531 & -0.3055 & 0.380299 \tabularnewline
46 & 0.145665 & 1.5068 & 0.067409 \tabularnewline
47 & -0.023264 & -0.2406 & 0.405145 \tabularnewline
48 & 0.016846 & 0.1743 & 0.430997 \tabularnewline
\hline
\end{tabular}
%Source: https://freestatistics.org/blog/index.php?pk=155493&T=1

[TABLE]
[ROW][C]Autocorrelation Function[/C][/ROW]
[ROW][C]Time lag k[/C][C]ACF(k)[/C][C]T-STAT[/C][C]P-value[/C][/ROW]
[ROW][C]1[/C][C]0.145137[/C][C]1.5013[/C][C]0.068111[/C][/ROW]
[ROW][C]2[/C][C]0.414332[/C][C]4.2859[/C][C]2e-05[/C][/ROW]
[ROW][C]3[/C][C]0.454921[/C][C]4.7057[/C][C]4e-06[/C][/ROW]
[ROW][C]4[/C][C]0.133432[/C][C]1.3802[/C][C]0.085196[/C][/ROW]
[ROW][C]5[/C][C]0.326554[/C][C]3.3779[/C][C]0.00051[/C][/ROW]
[ROW][C]6[/C][C]0.397379[/C][C]4.1105[/C][C]3.9e-05[/C][/ROW]
[ROW][C]7[/C][C]0.010174[/C][C]0.1052[/C][C]0.45819[/C][/ROW]
[ROW][C]8[/C][C]0.327401[/C][C]3.3867[/C][C]0.000495[/C][/ROW]
[ROW][C]9[/C][C]0.153022[/C][C]1.5829[/C][C]0.058201[/C][/ROW]
[ROW][C]10[/C][C]-0.081125[/C][C]-0.8392[/C][C]0.201625[/C][/ROW]
[ROW][C]11[/C][C]0.173451[/C][C]1.7942[/C][C]0.037803[/C][/ROW]
[ROW][C]12[/C][C]-0.112669[/C][C]-1.1655[/C][C]0.123213[/C][/ROW]
[ROW][C]13[/C][C]-0.127674[/C][C]-1.3207[/C][C]0.094714[/C][/ROW]
[ROW][C]14[/C][C]0.043529[/C][C]0.4503[/C][C]0.326715[/C][/ROW]
[ROW][C]15[/C][C]-0.135768[/C][C]-1.4044[/C][C]0.081549[/C][/ROW]
[ROW][C]16[/C][C]-0.13923[/C][C]-1.4402[/C][C]0.076365[/C][/ROW]
[ROW][C]17[/C][C]-0.074231[/C][C]-0.7678[/C][C]0.222134[/C][/ROW]
[ROW][C]18[/C][C]-0.249965[/C][C]-2.5857[/C][C]0.005532[/C][/ROW]
[ROW][C]19[/C][C]-0.222542[/C][C]-2.302[/C][C]0.011636[/C][/ROW]
[ROW][C]20[/C][C]-0.15622[/C][C]-1.616[/C][C]0.054524[/C][/ROW]
[ROW][C]21[/C][C]-0.257242[/C][C]-2.6609[/C][C]0.004496[/C][/ROW]
[ROW][C]22[/C][C]-0.255122[/C][C]-2.639[/C][C]0.004778[/C][/ROW]
[ROW][C]23[/C][C]-0.092083[/C][C]-0.9525[/C][C]0.17149[/C][/ROW]
[ROW][C]24[/C][C]-0.334525[/C][C]-3.4604[/C][C]0.000388[/C][/ROW]
[ROW][C]25[/C][C]-0.13698[/C][C]-1.4169[/C][C]0.079705[/C][/ROW]
[ROW][C]26[/C][C]-0.223104[/C][C]-2.3078[/C][C]0.011467[/C][/ROW]
[ROW][C]27[/C][C]-0.227147[/C][C]-2.3496[/C][C]0.010313[/C][/ROW]
[ROW][C]28[/C][C]-0.175243[/C][C]-1.8127[/C][C]0.036339[/C][/ROW]
[ROW][C]29[/C][C]-0.096908[/C][C]-1.0024[/C][C]0.1592[/C][/ROW]
[ROW][C]30[/C][C]-0.173593[/C][C]-1.7957[/C][C]0.037686[/C][/ROW]
[ROW][C]31[/C][C]0.009471[/C][C]0.098[/C][C]0.461072[/C][/ROW]
[ROW][C]32[/C][C]-0.111553[/C][C]-1.1539[/C][C]0.125554[/C][/ROW]
[ROW][C]33[/C][C]-0.069157[/C][C]-0.7154[/C][C]0.237972[/C][/ROW]
[ROW][C]34[/C][C]-0.055305[/C][C]-0.5721[/C][C]0.284235[/C][/ROW]
[ROW][C]35[/C][C]-0.017943[/C][C]-0.1856[/C][C]0.426552[/C][/ROW]
[ROW][C]36[/C][C]-0.047716[/C][C]-0.4936[/C][C]0.311308[/C][/ROW]
[ROW][C]37[/C][C]0.028394[/C][C]0.2937[/C][C]0.384774[/C][/ROW]
[ROW][C]38[/C][C]0.039404[/C][C]0.4076[/C][C]0.34219[/C][/ROW]
[ROW][C]39[/C][C]0.000285[/C][C]0.0029[/C][C]0.498827[/C][/ROW]
[ROW][C]40[/C][C]0.06275[/C][C]0.6491[/C][C]0.258835[/C][/ROW]
[ROW][C]41[/C][C]0.033698[/C][C]0.3486[/C][C]0.364045[/C][/ROW]
[ROW][C]42[/C][C]0.006786[/C][C]0.0702[/C][C]0.472084[/C][/ROW]
[ROW][C]43[/C][C]0.027587[/C][C]0.2854[/C][C]0.387958[/C][/ROW]
[ROW][C]44[/C][C]0.064511[/C][C]0.6673[/C][C]0.253007[/C][/ROW]
[ROW][C]45[/C][C]-0.029531[/C][C]-0.3055[/C][C]0.380299[/C][/ROW]
[ROW][C]46[/C][C]0.145665[/C][C]1.5068[/C][C]0.067409[/C][/ROW]
[ROW][C]47[/C][C]-0.023264[/C][C]-0.2406[/C][C]0.405145[/C][/ROW]
[ROW][C]48[/C][C]0.016846[/C][C]0.1743[/C][C]0.430997[/C][/ROW]
[/TABLE]
Source: https://freestatistics.org/blog/index.php?pk=155493&T=1

Globally Unique Identifier (entire table): ba.freestatistics.org/blog/index.php?pk=155493&T=1

As an alternative you can also use a QR Code:  

The GUIDs for individual cells are displayed in the table below:

Autocorrelation Function
Time lag kACF(k)T-STATP-value
10.1451371.50130.068111
20.4143324.28592e-05
30.4549214.70574e-06
40.1334321.38020.085196
50.3265543.37790.00051
60.3973794.11053.9e-05
70.0101740.10520.45819
80.3274013.38670.000495
90.1530221.58290.058201
10-0.081125-0.83920.201625
110.1734511.79420.037803
12-0.112669-1.16550.123213
13-0.127674-1.32070.094714
140.0435290.45030.326715
15-0.135768-1.40440.081549
16-0.13923-1.44020.076365
17-0.074231-0.76780.222134
18-0.249965-2.58570.005532
19-0.222542-2.3020.011636
20-0.15622-1.6160.054524
21-0.257242-2.66090.004496
22-0.255122-2.6390.004778
23-0.092083-0.95250.17149
24-0.334525-3.46040.000388
25-0.13698-1.41690.079705
26-0.223104-2.30780.011467
27-0.227147-2.34960.010313
28-0.175243-1.81270.036339
29-0.096908-1.00240.1592
30-0.173593-1.79570.037686
310.0094710.0980.461072
32-0.111553-1.15390.125554
33-0.069157-0.71540.237972
34-0.055305-0.57210.284235
35-0.017943-0.18560.426552
36-0.047716-0.49360.311308
370.0283940.29370.384774
380.0394040.40760.34219
390.0002850.00290.498827
400.062750.64910.258835
410.0336980.34860.364045
420.0067860.07020.472084
430.0275870.28540.387958
440.0645110.66730.253007
45-0.029531-0.30550.380299
460.1456651.50680.067409
47-0.023264-0.24060.405145
480.0168460.17430.430997


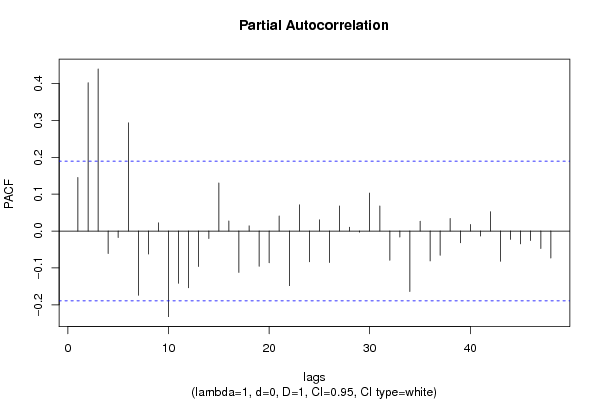
Partial Autocorrelation Function
Time lag kPACF(k)T-STATP-value
10.1451371.50130.068111
20.4017294.15553.3e-05
30.4392954.54417e-06
4-0.06066-0.62750.265844
5-0.01732-0.17920.429077
60.2932713.03360.001516
7-0.173862-1.79840.037463
8-0.062381-0.64530.260066
90.0222510.23020.409203
10-0.232001-2.39980.009065
11-0.1415-1.46370.073105
12-0.153899-1.59190.057174
13-0.096271-0.99580.160789
14-0.020252-0.20950.417232
150.1300911.34570.090627
160.0274720.28420.388413
17-0.112108-1.15970.124386
180.0140040.14490.442548
19-0.095421-0.9870.162925
20-0.085987-0.88950.187875
210.0409530.42360.336347
22-0.147876-1.52960.064528
230.070910.73350.232431
24-0.083371-0.86240.195199
250.0302560.3130.377458
26-0.085191-0.88120.190087
270.0678060.70140.242291
280.0105390.1090.456695
29-0.003046-0.03150.487463
300.1028351.06370.144922
310.0676890.70020.242666
32-0.079076-0.8180.207596
33-0.016033-0.16580.434296
34-0.163731-1.69360.046621
350.0266710.27590.391583
36-0.080795-0.83580.202578
37-0.065829-0.68090.248688
380.0340150.35190.36282
39-0.031686-0.32780.371867
400.0176740.18280.427641
41-0.013304-0.13760.445399
420.05220.540.295173
43-0.08187-0.84690.199479
44-0.022502-0.23280.408193
45-0.0347-0.35890.360175
46-0.025515-0.26390.396172
47-0.04733-0.48960.312717
48-0.07313-0.75650.225518

\begin{tabular}{lllllllll}
\hline
Partial Autocorrelation Function \tabularnewline
Time lag k & PACF(k) & T-STAT & P-value \tabularnewline
1 & 0.145137 & 1.5013 & 0.068111 \tabularnewline
2 & 0.401729 & 4.1555 & 3.3e-05 \tabularnewline
3 & 0.439295 & 4.5441 & 7e-06 \tabularnewline
4 & -0.06066 & -0.6275 & 0.265844 \tabularnewline
5 & -0.01732 & -0.1792 & 0.429077 \tabularnewline
6 & 0.293271 & 3.0336 & 0.001516 \tabularnewline
7 & -0.173862 & -1.7984 & 0.037463 \tabularnewline
8 & -0.062381 & -0.6453 & 0.260066 \tabularnewline
9 & 0.022251 & 0.2302 & 0.409203 \tabularnewline
10 & -0.232001 & -2.3998 & 0.009065 \tabularnewline
11 & -0.1415 & -1.4637 & 0.073105 \tabularnewline
12 & -0.153899 & -1.5919 & 0.057174 \tabularnewline
13 & -0.096271 & -0.9958 & 0.160789 \tabularnewline
14 & -0.020252 & -0.2095 & 0.417232 \tabularnewline
15 & 0.130091 & 1.3457 & 0.090627 \tabularnewline
16 & 0.027472 & 0.2842 & 0.388413 \tabularnewline
17 & -0.112108 & -1.1597 & 0.124386 \tabularnewline
18 & 0.014004 & 0.1449 & 0.442548 \tabularnewline
19 & -0.095421 & -0.987 & 0.162925 \tabularnewline
20 & -0.085987 & -0.8895 & 0.187875 \tabularnewline
21 & 0.040953 & 0.4236 & 0.336347 \tabularnewline
22 & -0.147876 & -1.5296 & 0.064528 \tabularnewline
23 & 0.07091 & 0.7335 & 0.232431 \tabularnewline
24 & -0.083371 & -0.8624 & 0.195199 \tabularnewline
25 & 0.030256 & 0.313 & 0.377458 \tabularnewline
26 & -0.085191 & -0.8812 & 0.190087 \tabularnewline
27 & 0.067806 & 0.7014 & 0.242291 \tabularnewline
28 & 0.010539 & 0.109 & 0.456695 \tabularnewline
29 & -0.003046 & -0.0315 & 0.487463 \tabularnewline
30 & 0.102835 & 1.0637 & 0.144922 \tabularnewline
31 & 0.067689 & 0.7002 & 0.242666 \tabularnewline
32 & -0.079076 & -0.818 & 0.207596 \tabularnewline
33 & -0.016033 & -0.1658 & 0.434296 \tabularnewline
34 & -0.163731 & -1.6936 & 0.046621 \tabularnewline
35 & 0.026671 & 0.2759 & 0.391583 \tabularnewline
36 & -0.080795 & -0.8358 & 0.202578 \tabularnewline
37 & -0.065829 & -0.6809 & 0.248688 \tabularnewline
38 & 0.034015 & 0.3519 & 0.36282 \tabularnewline
39 & -0.031686 & -0.3278 & 0.371867 \tabularnewline
40 & 0.017674 & 0.1828 & 0.427641 \tabularnewline
41 & -0.013304 & -0.1376 & 0.445399 \tabularnewline
42 & 0.0522 & 0.54 & 0.295173 \tabularnewline
43 & -0.08187 & -0.8469 & 0.199479 \tabularnewline
44 & -0.022502 & -0.2328 & 0.408193 \tabularnewline
45 & -0.0347 & -0.3589 & 0.360175 \tabularnewline
46 & -0.025515 & -0.2639 & 0.396172 \tabularnewline
47 & -0.04733 & -0.4896 & 0.312717 \tabularnewline
48 & -0.07313 & -0.7565 & 0.225518 \tabularnewline
\hline
\end{tabular}
%Source: https://freestatistics.org/blog/index.php?pk=155493&T=2

[TABLE]
[ROW][C]Partial Autocorrelation Function[/C][/ROW]
[ROW][C]Time lag k[/C][C]PACF(k)[/C][C]T-STAT[/C][C]P-value[/C][/ROW]
[ROW][C]1[/C][C]0.145137[/C][C]1.5013[/C][C]0.068111[/C][/ROW]
[ROW][C]2[/C][C]0.401729[/C][C]4.1555[/C][C]3.3e-05[/C][/ROW]
[ROW][C]3[/C][C]0.439295[/C][C]4.5441[/C][C]7e-06[/C][/ROW]
[ROW][C]4[/C][C]-0.06066[/C][C]-0.6275[/C][C]0.265844[/C][/ROW]
[ROW][C]5[/C][C]-0.01732[/C][C]-0.1792[/C][C]0.429077[/C][/ROW]
[ROW][C]6[/C][C]0.293271[/C][C]3.0336[/C][C]0.001516[/C][/ROW]
[ROW][C]7[/C][C]-0.173862[/C][C]-1.7984[/C][C]0.037463[/C][/ROW]
[ROW][C]8[/C][C]-0.062381[/C][C]-0.6453[/C][C]0.260066[/C][/ROW]
[ROW][C]9[/C][C]0.022251[/C][C]0.2302[/C][C]0.409203[/C][/ROW]
[ROW][C]10[/C][C]-0.232001[/C][C]-2.3998[/C][C]0.009065[/C][/ROW]
[ROW][C]11[/C][C]-0.1415[/C][C]-1.4637[/C][C]0.073105[/C][/ROW]
[ROW][C]12[/C][C]-0.153899[/C][C]-1.5919[/C][C]0.057174[/C][/ROW]
[ROW][C]13[/C][C]-0.096271[/C][C]-0.9958[/C][C]0.160789[/C][/ROW]
[ROW][C]14[/C][C]-0.020252[/C][C]-0.2095[/C][C]0.417232[/C][/ROW]
[ROW][C]15[/C][C]0.130091[/C][C]1.3457[/C][C]0.090627[/C][/ROW]
[ROW][C]16[/C][C]0.027472[/C][C]0.2842[/C][C]0.388413[/C][/ROW]
[ROW][C]17[/C][C]-0.112108[/C][C]-1.1597[/C][C]0.124386[/C][/ROW]
[ROW][C]18[/C][C]0.014004[/C][C]0.1449[/C][C]0.442548[/C][/ROW]
[ROW][C]19[/C][C]-0.095421[/C][C]-0.987[/C][C]0.162925[/C][/ROW]
[ROW][C]20[/C][C]-0.085987[/C][C]-0.8895[/C][C]0.187875[/C][/ROW]
[ROW][C]21[/C][C]0.040953[/C][C]0.4236[/C][C]0.336347[/C][/ROW]
[ROW][C]22[/C][C]-0.147876[/C][C]-1.5296[/C][C]0.064528[/C][/ROW]
[ROW][C]23[/C][C]0.07091[/C][C]0.7335[/C][C]0.232431[/C][/ROW]
[ROW][C]24[/C][C]-0.083371[/C][C]-0.8624[/C][C]0.195199[/C][/ROW]
[ROW][C]25[/C][C]0.030256[/C][C]0.313[/C][C]0.377458[/C][/ROW]
[ROW][C]26[/C][C]-0.085191[/C][C]-0.8812[/C][C]0.190087[/C][/ROW]
[ROW][C]27[/C][C]0.067806[/C][C]0.7014[/C][C]0.242291[/C][/ROW]
[ROW][C]28[/C][C]0.010539[/C][C]0.109[/C][C]0.456695[/C][/ROW]
[ROW][C]29[/C][C]-0.003046[/C][C]-0.0315[/C][C]0.487463[/C][/ROW]
[ROW][C]30[/C][C]0.102835[/C][C]1.0637[/C][C]0.144922[/C][/ROW]
[ROW][C]31[/C][C]0.067689[/C][C]0.7002[/C][C]0.242666[/C][/ROW]
[ROW][C]32[/C][C]-0.079076[/C][C]-0.818[/C][C]0.207596[/C][/ROW]
[ROW][C]33[/C][C]-0.016033[/C][C]-0.1658[/C][C]0.434296[/C][/ROW]
[ROW][C]34[/C][C]-0.163731[/C][C]-1.6936[/C][C]0.046621[/C][/ROW]
[ROW][C]35[/C][C]0.026671[/C][C]0.2759[/C][C]0.391583[/C][/ROW]
[ROW][C]36[/C][C]-0.080795[/C][C]-0.8358[/C][C]0.202578[/C][/ROW]
[ROW][C]37[/C][C]-0.065829[/C][C]-0.6809[/C][C]0.248688[/C][/ROW]
[ROW][C]38[/C][C]0.034015[/C][C]0.3519[/C][C]0.36282[/C][/ROW]
[ROW][C]39[/C][C]-0.031686[/C][C]-0.3278[/C][C]0.371867[/C][/ROW]
[ROW][C]40[/C][C]0.017674[/C][C]0.1828[/C][C]0.427641[/C][/ROW]
[ROW][C]41[/C][C]-0.013304[/C][C]-0.1376[/C][C]0.445399[/C][/ROW]
[ROW][C]42[/C][C]0.0522[/C][C]0.54[/C][C]0.295173[/C][/ROW]
[ROW][C]43[/C][C]-0.08187[/C][C]-0.8469[/C][C]0.199479[/C][/ROW]
[ROW][C]44[/C][C]-0.022502[/C][C]-0.2328[/C][C]0.408193[/C][/ROW]
[ROW][C]45[/C][C]-0.0347[/C][C]-0.3589[/C][C]0.360175[/C][/ROW]
[ROW][C]46[/C][C]-0.025515[/C][C]-0.2639[/C][C]0.396172[/C][/ROW]
[ROW][C]47[/C][C]-0.04733[/C][C]-0.4896[/C][C]0.312717[/C][/ROW]
[ROW][C]48[/C][C]-0.07313[/C][C]-0.7565[/C][C]0.225518[/C][/ROW]
[/TABLE]
Source: https://freestatistics.org/blog/index.php?pk=155493&T=2

Globally Unique Identifier (entire table): ba.freestatistics.org/blog/index.php?pk=155493&T=2

As an alternative you can also use a QR Code:  

The GUIDs for individual cells are displayed in the table below:

Partial Autocorrelation Function
Time lag kPACF(k)T-STATP-value
10.1451371.50130.068111
20.4017294.15553.3e-05
30.4392954.54417e-06
4-0.06066-0.62750.265844
5-0.01732-0.17920.429077
60.2932713.03360.001516
7-0.173862-1.79840.037463
8-0.062381-0.64530.260066
90.0222510.23020.409203
10-0.232001-2.39980.009065
11-0.1415-1.46370.073105
12-0.153899-1.59190.057174
13-0.096271-0.99580.160789
14-0.020252-0.20950.417232
150.1300911.34570.090627
160.0274720.28420.388413
17-0.112108-1.15970.124386
180.0140040.14490.442548
19-0.095421-0.9870.162925
20-0.085987-0.88950.187875
210.0409530.42360.336347
22-0.147876-1.52960.064528
230.070910.73350.232431
24-0.083371-0.86240.195199
250.0302560.3130.377458
26-0.085191-0.88120.190087
270.0678060.70140.242291
280.0105390.1090.456695
29-0.003046-0.03150.487463
300.1028351.06370.144922
310.0676890.70020.242666
32-0.079076-0.8180.207596
33-0.016033-0.16580.434296
34-0.163731-1.69360.046621
350.0266710.27590.391583
36-0.080795-0.83580.202578
37-0.065829-0.68090.248688
380.0340150.35190.36282
39-0.031686-0.32780.371867
400.0176740.18280.427641
41-0.013304-0.13760.445399
420.05220.540.295173
43-0.08187-0.84690.199479
44-0.022502-0.23280.408193
45-0.0347-0.35890.360175
46-0.025515-0.26390.396172
47-0.04733-0.48960.312717
48-0.07313-0.75650.225518


Parameters (Session):
par1 = 48 ; par2 = 1 ; par3 = 0 ; par4 = 1 ; par5 = 12 ; par6 = White Noise ; par7 = 0.95 ;
Parameters (R input):
par1 = 48 ; par2 = 1 ; par3 = 0 ; par4 = 1 ; par5 = 12 ; par6 = White Noise ; par7 = 0.95 ; par8 = ;
R code (references can be found in the software module):
if (par1 == 'Default') {
par1 = 10*log10(length(x))
} else {
par1 <- as.numeric(par1)
}
par2 <- as.numeric(par2)
par3 <- as.numeric(par3)
par4 <- as.numeric(par4)
par5 <- as.numeric(par5)
if (par6 == 'White Noise') par6 <- 'white' else par6 <- 'ma'
par7 <- as.numeric(par7)
if (par8 != '') par8 <- as.numeric(par8)
ox <- x
if (par8 == '') {
if (par2 == 0) {
x <- log(x)
} else {
x <- (x ^ par2 - 1) / par2
}
} else {
x <- log(x,base=par8)
}
if (par3 > 0) x <- diff(x,lag=1,difference=par3)
if (par4 > 0) x <- diff(x,lag=par5,difference=par4)
bitmap(file='picts.png')
op <- par(mfrow=c(2,1))
plot(ox,type='l',main='Original Time Series',xlab='time',ylab='value')
if (par8=='') {
mytitle <- paste('Working Time Series (lambda=',par2,', d=',par3,', D=',par4,')',sep='')
mysub <- paste('(lambda=',par2,', d=',par3,', D=',par4,', CI=', par7, ', CI type=',par6,')',sep='')
} else {
mytitle <- paste('Working Time Series (base=',par8,', d=',par3,', D=',par4,')',sep='')
mysub <- paste('(base=',par8,', d=',par3,', D=',par4,', CI=', par7, ', CI type=',par6,')',sep='')
}
plot(x,type='l', main=mytitle,xlab='time',ylab='value')
par(op)
dev.off()
bitmap(file='pic1.png')
racf <- acf(x, par1, main='Autocorrelation', xlab='time lag', ylab='ACF', ci.type=par6, ci=par7, sub=mysub)
dev.off()
bitmap(file='pic2.png')
rpacf <- pacf(x,par1,main='Partial Autocorrelation',xlab='lags',ylab='PACF',sub=mysub)
dev.off()
(myacf <- c(racf$acf))
(mypacf <- c(rpacf$acf))
lengthx <- length(x)
sqrtn <- sqrt(lengthx)
load(file='createtable')
a<-table.start()
a<-table.row.start(a)
a<-table.element(a,'Autocorrelation Function',4,TRUE)
a<-table.row.end(a)
a<-table.row.start(a)
a<-table.element(a,'Time lag k',header=TRUE)
a<-table.element(a,hyperlink('basics.htm','ACF(k)','click here for more information about the Autocorrelation Function'),header=TRUE)
a<-table.element(a,'T-STAT',header=TRUE)
a<-table.element(a,'P-value',header=TRUE)
a<-table.row.end(a)
for (i in 2:(par1+1)) {
a<-table.row.start(a)
a<-table.element(a,i-1,header=TRUE)
a<-table.element(a,round(myacf[i],6))
mytstat <- myacf[i]*sqrtn
a<-table.element(a,round(mytstat,4))
a<-table.element(a,round(1-pt(abs(mytstat),lengthx),6))
a<-table.row.end(a)
}
a<-table.end(a)
table.save(a,file='mytable.tab')
a<-table.start()
a<-table.row.start(a)
a<-table.element(a,'Partial Autocorrelation Function',4,TRUE)
a<-table.row.end(a)
a<-table.row.start(a)
a<-table.element(a,'Time lag k',header=TRUE)
a<-table.element(a,hyperlink('basics.htm','PACF(k)','click here for more information about the Partial Autocorrelation Function'),header=TRUE)
a<-table.element(a,'T-STAT',header=TRUE)
a<-table.element(a,'P-value',header=TRUE)
a<-table.row.end(a)
for (i in 1:par1) {
a<-table.row.start(a)
a<-table.element(a,i,header=TRUE)
a<-table.element(a,round(mypacf[i],6))
mytstat <- mypacf[i]*sqrtn
a<-table.element(a,round(mytstat,4))
a<-table.element(a,round(1-pt(abs(mytstat),lengthx),6))
a<-table.row.end(a)
}
a<-table.end(a)
table.save(a,file='mytable1.tab')