| Multiple Linear Regression - Estimated Regression Equation |
| testscores[t] = -0.499196751044552 -0.000698879751712638pageviews[t] + 0.00396592077682703logins[t] + 0.00224768012879452comp_views[t] + 0.00133820189015943comp_views_pr[t] + 0.282710837368043comp_reviewed[t] -0.0893074649308441Feedback_p1[t] + 0.0262587394294302feedback_p120[t] -6.29345910915496e-05revisions[t] -7.27600641965383e-06seconds[t] + 0.0781974664703193hyperlinks[t] -0.0657258098288152blogs[t] -0.00102669152057652t + e[t] |
| Multiple Linear Regression - Ordinary Least Squares | |||||
| Variable | Parameter | S.D. | T-STAT H0: parameter = 0 | 2-tail p-value | 1-tail p-value |
| (Intercept) | -0.499196751044552 | 1.472621 | -0.339 | 0.735608 | 0.367804 |
| pageviews | -0.000698879751712638 | 0.001359 | -0.5144 | 0.608569 | 0.304284 |
| logins | 0.00396592077682703 | 0.011498 | 0.3449 | 0.731153 | 0.365577 |
| comp_views | 0.00224768012879452 | 0.003119 | 0.7206 | 0.473468 | 0.236734 |
| comp_views_pr | 0.00133820189015943 | 0.004867 | 0.275 | 0.784134 | 0.392067 |
| comp_reviewed | 0.282710837368043 | 0.175952 | 1.6068 | 0.112486 | 0.056243 |
| Feedback_p1 | -0.0893074649308441 | 0.052311 | -1.7072 | 0.092088 | 0.046044 |
| feedback_p120 | 0.0262587394294302 | 0.024498 | 1.0719 | 0.287361 | 0.143681 |
| revisions | -6.29345910915496e-05 | 5.9e-05 | -1.0641 | 0.29082 | 0.14541 |
| seconds | -7.27600641965383e-06 | 1.4e-05 | -0.5203 | 0.604434 | 0.302217 |
| hyperlinks | 0.0781974664703193 | 0.066039 | 1.1841 | 0.240266 | 0.120133 |
| blogs | -0.0657258098288152 | 0.068554 | -0.9588 | 0.340892 | 0.170446 |
| t | -0.00102669152057652 | 0.013727 | -0.0748 | 0.940586 | 0.470293 |
| Multiple Linear Regression - Regression Statistics | |
| Multiple R | 0.340994467989689 |
| R-squared | 0.116277227199571 |
| Adjusted R-squared | -0.0310099016005005 |
| F-TEST (value) | 0.789459528112646 |
| F-TEST (DF numerator) | 12 |
| F-TEST (DF denominator) | 72 |
| p-value | 0.659527126988586 |
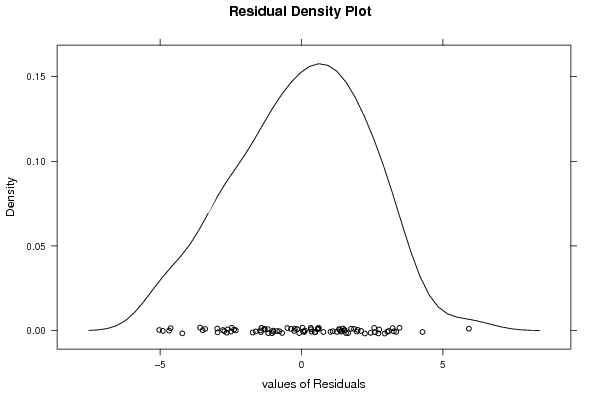
| Multiple Linear Regression - Residual Statistics | |
| Residual Standard Deviation | 2.49991900544623 |
| Sum Squared Residuals | 449.970842432971 |
| Multiple Linear Regression - Actuals, Interpolation, and Residuals | |||
| Time or Index | Actuals | Interpolation Forecast | Residuals Prediction Error |
| 1 | 2 | -0.447804712385948 | 2.44780471238595 |
| 2 | 4 | 0.644438068681308 | 3.35556193131869 |
| 3 | 0 | -0.364205165738076 | 0.364205165738076 |
| 4 | 0 | 1.16811221242508 | -1.16811221242508 |
| 5 | -4 | 1.02752876997282 | -5.02752876997282 |
| 6 | 4 | 1.75510789272618 | 2.24489210727382 |
| 7 | 4 | 2.24287338315858 | 1.75712661684142 |
| 8 | 0 | 1.43286235874269 | -1.43286235874269 |
| 9 | -1 | 0.306070498571489 | -1.30607049857149 |
| 10 | 0 | -0.0640849759867956 | 0.0640849759867956 |
| 11 | 1 | 1.77770223454573 | -0.77770223454573 |
| 12 | 0 | 1.19178258186378 | -1.19178258186378 |
| 13 | 3 | 0.398583034229933 | 2.60141696577007 |
| 14 | -1 | 0.450857658898126 | -1.45085765889813 |
| 15 | 4 | 1.2461667926362 | 2.7538332073638 |
| 16 | 3 | 0.27879332731138 | 2.72120667268862 |
| 17 | 1 | -0.257450843102618 | 1.25745084310262 |
| 18 | 0 | 0.681674484088281 | -0.681674484088281 |
| 19 | -2 | 0.726330606500459 | -2.72633060650046 |
| 20 | -3 | 0.403476505827842 | -3.40347650582784 |
| 21 | -4 | 0.678773006723897 | -4.6787730067239 |
| 22 | 2 | 0.574865358007546 | 1.42513464199245 |
| 23 | 2 | 2.49420036654378 | -0.494200366543775 |
| 24 | -4 | 0.900443148380033 | -4.90044314838003 |
| 25 | 3 | 1.13949088486201 | 1.86050911513799 |
| 26 | 2 | 0.419760776420166 | 1.58023922357983 |
| 27 | 2 | 0.47097836889111 | 1.52902163110889 |
| 28 | 0 | 0.983955999108338 | -0.983955999108338 |
| 29 | 5 | 0.716381856290607 | 4.28361814370939 |
| 30 | -2 | 0.638053274347396 | -2.6380532743474 |
| 31 | 0 | 0.25167521040634 | -0.25167521040634 |
| 32 | -2 | 0.608146618289501 | -2.6081466182895 |
| 33 | -3 | -0.679678757632503 | -2.3203212423675 |
| 34 | 2 | 0.969558910965017 | 1.03044108903498 |
| 35 | 2 | 0.597811729314239 | 1.40218827068576 |
| 36 | 2 | 0.645593094044849 | 1.35440690595515 |
| 37 | 0 | 0.150454573745772 | -0.150454573745772 |
| 38 | 4 | 0.771712984509735 | 3.22828701549027 |
| 39 | 4 | 0.530137952385159 | 3.46986204761484 |
| 40 | 2 | 0.668976979920215 | 1.33102302007978 |
| 41 | 2 | 3.72293528598277 | -1.72293528598277 |
| 42 | -4 | -0.416498843219281 | -3.58350115678072 |
| 43 | 3 | -0.0909271025873557 | 3.09092710258736 |
| 44 | 3 | 1.04188026925809 | 1.95811973074191 |
| 45 | 2 | 2.23443871306974 | -0.234438713069742 |
| 46 | -1 | -0.00247121485747059 | -0.99752878514253 |
| 47 | -3 | -0.227210085146397 | -2.7727899148536 |
| 48 | 0 | -0.488988830800702 | 0.488988830800702 |
| 49 | 1 | -0.517484087553521 | 1.51748408755352 |
| 50 | -3 | -0.620114742796504 | -2.3798852572035 |
| 51 | 3 | -0.0404150246724564 | 3.04041502467246 |
| 52 | 0 | -0.332988943933133 | 0.332988943933133 |
| 53 | 0 | 0.368357270551451 | -0.368357270551451 |
| 54 | 0 | -0.583680623585996 | 0.583680623585996 |
| 55 | 3 | 2.89930018152963 | 0.100699818470371 |
| 56 | -3 | 0.49147143746419 | -3.49147143746419 |
| 57 | 0 | 0.862331975823798 | -0.862331975823798 |
| 58 | -4 | 0.626045307612822 | -4.62604530761282 |
| 59 | 2 | 0.88920982081893 | 1.11079017918107 |
| 60 | -1 | 0.413146964330556 | -1.41314696433056 |
| 61 | 3 | 1.34752544963839 | 1.65247455036161 |
| 62 | 2 | 1.65883220080511 | 0.341167799194892 |
| 63 | 5 | 1.73134086243905 | 3.26865913756095 |
| 64 | 2 | 1.39708578263709 | 0.60291421736291 |
| 65 | -2 | 0.965145744954858 | -2.96514574495486 |
| 66 | 0 | -0.125410540140037 | 0.125410540140037 |
| 67 | 3 | 0.425267260498948 | 2.57473273950105 |
| 68 | -2 | -0.385185655024749 | -1.61481434497525 |
| 69 | 0 | 1.03974800563306 | -1.03974800563306 |
| 70 | 6 | 0.0771113928010818 | 5.92288860719892 |
| 71 | -3 | -0.541503466942158 | -2.45849653305784 |
| 72 | 3 | 0.054708428742674 | 2.94529157125733 |
| 73 | 0 | -0.0377731488866892 | 0.0377731488866892 |
| 74 | -2 | 0.493688993570535 | -2.49368899357053 |
| 75 | 1 | 0.222043334262474 | 0.777956665737526 |
| 76 | 0 | -0.616716527238973 | 0.616716527238973 |
| 77 | 2 | -0.110367474345888 | 2.11036747434589 |
| 78 | 2 | 0.00920372539844072 | 1.99079627460156 |
| 79 | -3 | -0.0242016468826178 | -2.97579835311738 |
| 80 | -2 | -0.705969654286968 | -1.29403034571303 |
| 81 | 1 | -0.470960075304753 | 1.47096007530475 |
| 82 | -4 | 0.211535329338231 | -4.21153532933823 |
| 83 | 0 | -0.476654675005473 | 0.476654675005473 |
| 84 | 1 | 0.425147149284314 | 0.574852850715686 |
| 85 | 0 | 0.0779144282752674 | -0.0779144282752674 |
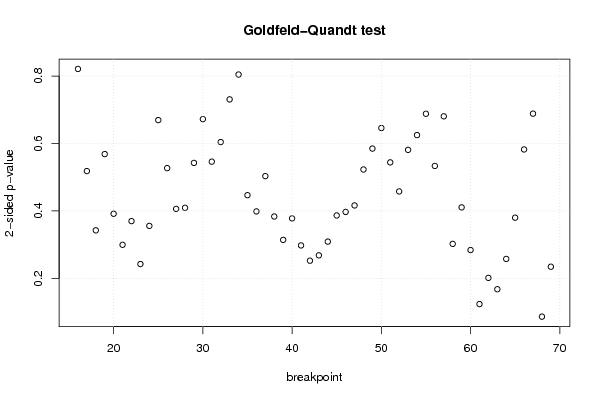
| Goldfeld-Quandt test for Heteroskedasticity | |||
| p-values | Alternative Hypothesis | ||
| breakpoint index | greater | 2-sided | less |
| 16 | 0.410470996199494 | 0.820941992398988 | 0.589529003800506 |
| 17 | 0.259118183243931 | 0.518236366487862 | 0.74088181675607 |
| 18 | 0.17125649233413 | 0.34251298466826 | 0.82874350766587 |
| 19 | 0.284277881891812 | 0.568555763783624 | 0.715722118108188 |
| 20 | 0.195827088282722 | 0.391654176565444 | 0.804172911717278 |
| 21 | 0.149820493539177 | 0.299640987078354 | 0.850179506460823 |
| 22 | 0.184893685168866 | 0.369787370337732 | 0.815106314831134 |
| 23 | 0.121284809025399 | 0.242569618050798 | 0.878715190974601 |
| 24 | 0.177836394217047 | 0.355672788434093 | 0.822163605782953 |
| 25 | 0.334657360190412 | 0.669314720380823 | 0.665342639809588 |
| 26 | 0.263499053773161 | 0.526998107546322 | 0.736500946226839 |
| 27 | 0.203007916610888 | 0.406015833221777 | 0.796992083389112 |
| 28 | 0.204624168732515 | 0.40924833746503 | 0.795375831267485 |
| 29 | 0.271182131169747 | 0.542364262339494 | 0.728817868830253 |
| 30 | 0.336110399242649 | 0.672220798485299 | 0.663889600757351 |
| 31 | 0.273026161161829 | 0.546052322323658 | 0.726973838838171 |
| 32 | 0.302082489499451 | 0.604164978998903 | 0.697917510500549 |
| 33 | 0.365347609761465 | 0.73069521952293 | 0.634652390238535 |
| 34 | 0.59779035575591 | 0.80441928848818 | 0.40220964424409 |
| 35 | 0.776648697867204 | 0.446702604265591 | 0.223351302132795 |
| 36 | 0.800669767061176 | 0.398660465877648 | 0.199330232938824 |
| 37 | 0.748411426406226 | 0.503177147187549 | 0.251588573593774 |
| 38 | 0.808221187126456 | 0.383557625747087 | 0.191778812873544 |
| 39 | 0.842908219973132 | 0.314183560053736 | 0.157091780026868 |
| 40 | 0.81105734300992 | 0.377885313980161 | 0.18894265699008 |
| 41 | 0.851116300718952 | 0.297767398562096 | 0.148883699281048 |
| 42 | 0.873759335736937 | 0.252481328526125 | 0.126240664263063 |
| 43 | 0.865779879935829 | 0.268440240128343 | 0.134220120064171 |
| 44 | 0.845450369019582 | 0.309099261960836 | 0.154549630980418 |
| 45 | 0.806716146989417 | 0.386567706021166 | 0.193283853010583 |
| 46 | 0.801429233474893 | 0.397141533050215 | 0.198570766525107 |
| 47 | 0.791836821342463 | 0.416326357315074 | 0.208163178657537 |
| 48 | 0.738551511111357 | 0.522896977777286 | 0.261448488888643 |
| 49 | 0.707567612109674 | 0.584864775780652 | 0.292432387890326 |
| 50 | 0.677078928744756 | 0.645842142510488 | 0.322921071255244 |
| 51 | 0.728001645556774 | 0.543996708886452 | 0.271998354443226 |
| 52 | 0.771099358181638 | 0.457801283636725 | 0.228900641818362 |
| 53 | 0.70947303028632 | 0.58105393942736 | 0.29052696971368 |
| 54 | 0.687515968465827 | 0.624968063068347 | 0.312484031534174 |
| 55 | 0.655965418086983 | 0.688069163826035 | 0.344034581913017 |
| 56 | 0.733306498621516 | 0.533387002756968 | 0.266693501378484 |
| 57 | 0.659697878578613 | 0.680604242842774 | 0.340302121421387 |
| 58 | 0.848811262884632 | 0.302377474230736 | 0.151188737115368 |
| 59 | 0.794711974590986 | 0.410576050818027 | 0.205288025409014 |
| 60 | 0.857945206678623 | 0.284109586642754 | 0.142054793321377 |
| 61 | 0.938050275463998 | 0.123899449072004 | 0.0619497245360019 |
| 62 | 0.899199558103932 | 0.201600883792136 | 0.100800441896068 |
| 63 | 0.916033715310705 | 0.167932569378591 | 0.0839662846892954 |
| 64 | 0.87113398229805 | 0.257732035403902 | 0.128866017701951 |
| 65 | 0.809976244869522 | 0.380047510260956 | 0.190023755130478 |
| 66 | 0.708879457112227 | 0.582241085775546 | 0.291120542887773 |
| 67 | 0.655806978307455 | 0.68838604338509 | 0.344193021692545 |
| 68 | 0.956691485298345 | 0.0866170294033095 | 0.0433085147016548 |
| 69 | 0.882690600902722 | 0.234618798194556 | 0.117309399097278 |
| Meta Analysis of Goldfeld-Quandt test for Heteroskedasticity | |||
| Description | # significant tests | % significant tests | OK/NOK |
| 1% type I error level | 0 | 0 | OK |
| 5% type I error level | 0 | 0 | OK |
| 10% type I error level | 1 | 0.0185185185185185 | OK |