Free Statistics

of Irreproducible Research!

Author's title

Author*The author of this computation has been verified*
R Software Modulerwasp_regression_trees1.wasp
Title produced by softwareRecursive Partitioning (Regression Trees)
Date of computationThu, 15 Dec 2011 06:00:09 -0500
Cite this page as followsStatistical Computations at FreeStatistics.org, Office for Research Development and Education, URL https://freestatistics.org/blog/index.php?v=date/2011/Dec/15/t1323946933f2a8vm19r5zca28.htm/, Retrieved Wed, 08 May 2024 12:26:02 +0000
Statistical Computations at FreeStatistics.org, Office for Research Development and Education, URL https://freestatistics.org/blog/index.php?pk=155340, Retrieved Wed, 08 May 2024 12:26:02 +0000
QR Codes:

Original text written by user:
IsPrivate?No (this computation is public)
User-defined keywords
Estimated Impact117
Family? (F = Feedback message, R = changed R code, M = changed R Module, P = changed Parameters, D = changed Data)
-     [Recursive Partitioning (Regression Trees)] [ws 10 deel 4] [2011-12-12 16:42:32] [4b648d52023f19d55c572f0eddd72b1f]
-    D    [Recursive Partitioning (Regression Trees)] [WS 10.3] [2011-12-15 11:00:09] [e524eb56e6915a531809c7eb50783bc6] [Current]
Feedback Forum

Post a new message
Dataseries X:
70.5	4.0	370
53.5	315.0	6166
65.0	4.0	684
76.5	1.7	449
70.0	8.0	643
71.0	5.6	1551
60.5	15.0	616
51.5	503.0	36660
78.0	2.6	403
76.0	2.6	346
57.5	44.0	2471
61.0	24.0	7427
64.5	23.0	2992
78.5	3.8	233
79.0	1.8	609
61.0	96.0	7615
70.0	90.0	370
70.0	4.9	1066
72.0	6.6	600
64.5	21.0	4873
54.5	592.0	3485
56.5	73.0	2364
64.5	14.0	1016
64.5	8.8	1062
73.0	3.9	480
72.0	6.0	559
69.0	3.2	259
64.0	11.0	1340
78.5	2.6	275
53.0	23.0	12550
75.0	3.2	965
68.5	11.0	4883
70.0	5.0	1189
70.5	3.0	226
76.0	3.0	611
75.5	1.3	404
74.5	5.6	576
65.0	29.0	3096


Summary of computational transaction
Raw Inputview raw input (R code)
Raw Outputview raw output of R engine
Computing time4 seconds
R Server'Gertrude Mary Cox' @ cox.wessa.net

\begin{tabular}{lllllllll}
\hline
Summary of computational transaction \tabularnewline
Raw Input & view raw input (R code)  \tabularnewline
Raw Output & view raw output of R engine  \tabularnewline
Computing time & 4 seconds \tabularnewline
R Server & 'Gertrude Mary Cox' @ cox.wessa.net \tabularnewline
\hline
\end{tabular}
%Source: https://freestatistics.org/blog/index.php?pk=155340&T=0

[TABLE]
[ROW][C]Summary of computational transaction[/C][/ROW]
[ROW][C]Raw Input[/C][C]view raw input (R code) [/C][/ROW]
[ROW][C]Raw Output[/C][C]view raw output of R engine [/C][/ROW]
[ROW][C]Computing time[/C][C]4 seconds[/C][/ROW]
[ROW][C]R Server[/C][C]'Gertrude Mary Cox' @ cox.wessa.net[/C][/ROW]
[/TABLE]
Source: https://freestatistics.org/blog/index.php?pk=155340&T=0

Globally Unique Identifier (entire table): ba.freestatistics.org/blog/index.php?pk=155340&T=0

As an alternative you can also use a QR Code:  

The GUIDs for individual cells are displayed in the table below:

Summary of computational transaction
Raw Inputview raw input (R code)
Raw Outputview raw output of R engine
Computing time4 seconds
R Server'Gertrude Mary Cox' @ cox.wessa.net


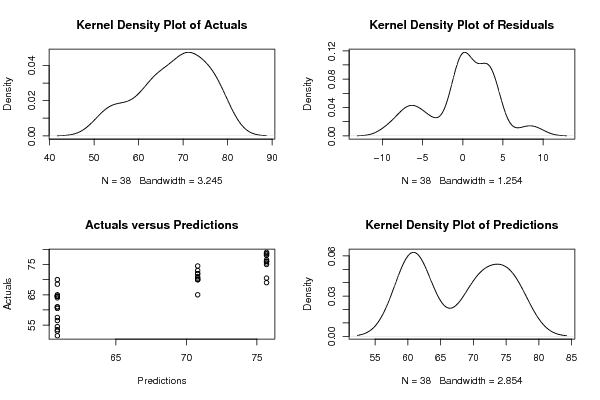
Goodness of Fit
Correlation0.8412
R-squared0.7076
RMSE4.1632

\begin{tabular}{lllllllll}
\hline
Goodness of Fit \tabularnewline
Correlation & 0.8412 \tabularnewline
R-squared & 0.7076 \tabularnewline
RMSE & 4.1632 \tabularnewline
\hline
\end{tabular}
%Source: https://freestatistics.org/blog/index.php?pk=155340&T=1

[TABLE]
[ROW][C]Goodness of Fit[/C][/ROW]
[ROW][C]Correlation[/C][C]0.8412[/C][/ROW]
[ROW][C]R-squared[/C][C]0.7076[/C][/ROW]
[ROW][C]RMSE[/C][C]4.1632[/C][/ROW]
[/TABLE]
Source: https://freestatistics.org/blog/index.php?pk=155340&T=1

Globally Unique Identifier (entire table): ba.freestatistics.org/blog/index.php?pk=155340&T=1

As an alternative you can also use a QR Code:  

The GUIDs for individual cells are displayed in the table below:

Goodness of Fit
Correlation0.8412
R-squared0.7076
RMSE4.1632


Actuals, Predictions, and Residuals
#ActualsForecastsResiduals
170.570.8-0.299999999999997
253.560.8529411764706-7.35294117647059
36570.8-5.8
476.575.68181818181820.818181818181813
57070.8-0.799999999999997
67170.80.200000000000003
760.560.8529411764706-0.352941176470587
851.560.8529411764706-9.35294117647059
97875.68181818181822.31818181818181
107675.68181818181820.318181818181813
1157.560.8529411764706-3.35294117647059
126160.85294117647060.147058823529413
1364.560.85294117647063.64705882352941
1478.575.68181818181822.81818181818181
157975.68181818181823.31818181818181
166160.85294117647060.147058823529413
177060.85294117647069.14705882352941
187070.8-0.799999999999997
197270.81.2
2064.560.85294117647063.64705882352941
2154.560.8529411764706-6.35294117647059
2256.560.8529411764706-4.35294117647059
2364.560.85294117647063.64705882352941
2464.560.85294117647063.64705882352941
257370.82.2
267270.81.2
276975.6818181818182-6.68181818181819
286460.85294117647063.14705882352941
2978.575.68181818181822.81818181818181
305360.8529411764706-7.85294117647059
317575.6818181818182-0.681818181818187
3268.560.85294117647067.64705882352941
337070.8-0.799999999999997
3470.575.6818181818182-5.18181818181819
357675.68181818181820.318181818181813
3675.575.6818181818182-0.181818181818187
3774.570.83.7
386560.85294117647064.14705882352941

\begin{tabular}{lllllllll}
\hline
Actuals, Predictions, and Residuals \tabularnewline
# & Actuals & Forecasts & Residuals \tabularnewline
1 & 70.5 & 70.8 & -0.299999999999997 \tabularnewline
2 & 53.5 & 60.8529411764706 & -7.35294117647059 \tabularnewline
3 & 65 & 70.8 & -5.8 \tabularnewline
4 & 76.5 & 75.6818181818182 & 0.818181818181813 \tabularnewline
5 & 70 & 70.8 & -0.799999999999997 \tabularnewline
6 & 71 & 70.8 & 0.200000000000003 \tabularnewline
7 & 60.5 & 60.8529411764706 & -0.352941176470587 \tabularnewline
8 & 51.5 & 60.8529411764706 & -9.35294117647059 \tabularnewline
9 & 78 & 75.6818181818182 & 2.31818181818181 \tabularnewline
10 & 76 & 75.6818181818182 & 0.318181818181813 \tabularnewline
11 & 57.5 & 60.8529411764706 & -3.35294117647059 \tabularnewline
12 & 61 & 60.8529411764706 & 0.147058823529413 \tabularnewline
13 & 64.5 & 60.8529411764706 & 3.64705882352941 \tabularnewline
14 & 78.5 & 75.6818181818182 & 2.81818181818181 \tabularnewline
15 & 79 & 75.6818181818182 & 3.31818181818181 \tabularnewline
16 & 61 & 60.8529411764706 & 0.147058823529413 \tabularnewline
17 & 70 & 60.8529411764706 & 9.14705882352941 \tabularnewline
18 & 70 & 70.8 & -0.799999999999997 \tabularnewline
19 & 72 & 70.8 & 1.2 \tabularnewline
20 & 64.5 & 60.8529411764706 & 3.64705882352941 \tabularnewline
21 & 54.5 & 60.8529411764706 & -6.35294117647059 \tabularnewline
22 & 56.5 & 60.8529411764706 & -4.35294117647059 \tabularnewline
23 & 64.5 & 60.8529411764706 & 3.64705882352941 \tabularnewline
24 & 64.5 & 60.8529411764706 & 3.64705882352941 \tabularnewline
25 & 73 & 70.8 & 2.2 \tabularnewline
26 & 72 & 70.8 & 1.2 \tabularnewline
27 & 69 & 75.6818181818182 & -6.68181818181819 \tabularnewline
28 & 64 & 60.8529411764706 & 3.14705882352941 \tabularnewline
29 & 78.5 & 75.6818181818182 & 2.81818181818181 \tabularnewline
30 & 53 & 60.8529411764706 & -7.85294117647059 \tabularnewline
31 & 75 & 75.6818181818182 & -0.681818181818187 \tabularnewline
32 & 68.5 & 60.8529411764706 & 7.64705882352941 \tabularnewline
33 & 70 & 70.8 & -0.799999999999997 \tabularnewline
34 & 70.5 & 75.6818181818182 & -5.18181818181819 \tabularnewline
35 & 76 & 75.6818181818182 & 0.318181818181813 \tabularnewline
36 & 75.5 & 75.6818181818182 & -0.181818181818187 \tabularnewline
37 & 74.5 & 70.8 & 3.7 \tabularnewline
38 & 65 & 60.8529411764706 & 4.14705882352941 \tabularnewline
\hline
\end{tabular}
%Source: https://freestatistics.org/blog/index.php?pk=155340&T=2

[TABLE]
[ROW][C]Actuals, Predictions, and Residuals[/C][/ROW]
[ROW][C]#[/C][C]Actuals[/C][C]Forecasts[/C][C]Residuals[/C][/ROW]
[ROW][C]1[/C][C]70.5[/C][C]70.8[/C][C]-0.299999999999997[/C][/ROW]
[ROW][C]2[/C][C]53.5[/C][C]60.8529411764706[/C][C]-7.35294117647059[/C][/ROW]
[ROW][C]3[/C][C]65[/C][C]70.8[/C][C]-5.8[/C][/ROW]
[ROW][C]4[/C][C]76.5[/C][C]75.6818181818182[/C][C]0.818181818181813[/C][/ROW]
[ROW][C]5[/C][C]70[/C][C]70.8[/C][C]-0.799999999999997[/C][/ROW]
[ROW][C]6[/C][C]71[/C][C]70.8[/C][C]0.200000000000003[/C][/ROW]
[ROW][C]7[/C][C]60.5[/C][C]60.8529411764706[/C][C]-0.352941176470587[/C][/ROW]
[ROW][C]8[/C][C]51.5[/C][C]60.8529411764706[/C][C]-9.35294117647059[/C][/ROW]
[ROW][C]9[/C][C]78[/C][C]75.6818181818182[/C][C]2.31818181818181[/C][/ROW]
[ROW][C]10[/C][C]76[/C][C]75.6818181818182[/C][C]0.318181818181813[/C][/ROW]
[ROW][C]11[/C][C]57.5[/C][C]60.8529411764706[/C][C]-3.35294117647059[/C][/ROW]
[ROW][C]12[/C][C]61[/C][C]60.8529411764706[/C][C]0.147058823529413[/C][/ROW]
[ROW][C]13[/C][C]64.5[/C][C]60.8529411764706[/C][C]3.64705882352941[/C][/ROW]
[ROW][C]14[/C][C]78.5[/C][C]75.6818181818182[/C][C]2.81818181818181[/C][/ROW]
[ROW][C]15[/C][C]79[/C][C]75.6818181818182[/C][C]3.31818181818181[/C][/ROW]
[ROW][C]16[/C][C]61[/C][C]60.8529411764706[/C][C]0.147058823529413[/C][/ROW]
[ROW][C]17[/C][C]70[/C][C]60.8529411764706[/C][C]9.14705882352941[/C][/ROW]
[ROW][C]18[/C][C]70[/C][C]70.8[/C][C]-0.799999999999997[/C][/ROW]
[ROW][C]19[/C][C]72[/C][C]70.8[/C][C]1.2[/C][/ROW]
[ROW][C]20[/C][C]64.5[/C][C]60.8529411764706[/C][C]3.64705882352941[/C][/ROW]
[ROW][C]21[/C][C]54.5[/C][C]60.8529411764706[/C][C]-6.35294117647059[/C][/ROW]
[ROW][C]22[/C][C]56.5[/C][C]60.8529411764706[/C][C]-4.35294117647059[/C][/ROW]
[ROW][C]23[/C][C]64.5[/C][C]60.8529411764706[/C][C]3.64705882352941[/C][/ROW]
[ROW][C]24[/C][C]64.5[/C][C]60.8529411764706[/C][C]3.64705882352941[/C][/ROW]
[ROW][C]25[/C][C]73[/C][C]70.8[/C][C]2.2[/C][/ROW]
[ROW][C]26[/C][C]72[/C][C]70.8[/C][C]1.2[/C][/ROW]
[ROW][C]27[/C][C]69[/C][C]75.6818181818182[/C][C]-6.68181818181819[/C][/ROW]
[ROW][C]28[/C][C]64[/C][C]60.8529411764706[/C][C]3.14705882352941[/C][/ROW]
[ROW][C]29[/C][C]78.5[/C][C]75.6818181818182[/C][C]2.81818181818181[/C][/ROW]
[ROW][C]30[/C][C]53[/C][C]60.8529411764706[/C][C]-7.85294117647059[/C][/ROW]
[ROW][C]31[/C][C]75[/C][C]75.6818181818182[/C][C]-0.681818181818187[/C][/ROW]
[ROW][C]32[/C][C]68.5[/C][C]60.8529411764706[/C][C]7.64705882352941[/C][/ROW]
[ROW][C]33[/C][C]70[/C][C]70.8[/C][C]-0.799999999999997[/C][/ROW]
[ROW][C]34[/C][C]70.5[/C][C]75.6818181818182[/C][C]-5.18181818181819[/C][/ROW]
[ROW][C]35[/C][C]76[/C][C]75.6818181818182[/C][C]0.318181818181813[/C][/ROW]
[ROW][C]36[/C][C]75.5[/C][C]75.6818181818182[/C][C]-0.181818181818187[/C][/ROW]
[ROW][C]37[/C][C]74.5[/C][C]70.8[/C][C]3.7[/C][/ROW]
[ROW][C]38[/C][C]65[/C][C]60.8529411764706[/C][C]4.14705882352941[/C][/ROW]
[/TABLE]
Source: https://freestatistics.org/blog/index.php?pk=155340&T=2

Globally Unique Identifier (entire table): ba.freestatistics.org/blog/index.php?pk=155340&T=2

As an alternative you can also use a QR Code:  

The GUIDs for individual cells are displayed in the table below:

Actuals, Predictions, and Residuals
#ActualsForecastsResiduals
170.570.8-0.299999999999997
253.560.8529411764706-7.35294117647059
36570.8-5.8
476.575.68181818181820.818181818181813
57070.8-0.799999999999997
67170.80.200000000000003
760.560.8529411764706-0.352941176470587
851.560.8529411764706-9.35294117647059
97875.68181818181822.31818181818181
107675.68181818181820.318181818181813
1157.560.8529411764706-3.35294117647059
126160.85294117647060.147058823529413
1364.560.85294117647063.64705882352941
1478.575.68181818181822.81818181818181
157975.68181818181823.31818181818181
166160.85294117647060.147058823529413
177060.85294117647069.14705882352941
187070.8-0.799999999999997
197270.81.2
2064.560.85294117647063.64705882352941
2154.560.8529411764706-6.35294117647059
2256.560.8529411764706-4.35294117647059
2364.560.85294117647063.64705882352941
2464.560.85294117647063.64705882352941
257370.82.2
267270.81.2
276975.6818181818182-6.68181818181819
286460.85294117647063.14705882352941
2978.575.68181818181822.81818181818181
305360.8529411764706-7.85294117647059
317575.6818181818182-0.681818181818187
3268.560.85294117647067.64705882352941
337070.8-0.799999999999997
3470.575.6818181818182-5.18181818181819
357675.68181818181820.318181818181813
3675.575.6818181818182-0.181818181818187
3774.570.83.7
386560.85294117647064.14705882352941


Parameters (Session):
par1 = 1 ; par2 = none ; par3 = 3 ; par4 = no ;
Parameters (R input):
par1 = 1 ; par2 = none ; par3 = 3 ; par4 = no ;
R code (references can be found in the software module):
library(party)
library(Hmisc)
par1 <- as.numeric(par1)
par3 <- as.numeric(par3)
x <- data.frame(t(y))
is.data.frame(x)
x <- x[!is.na(x[,par1]),]
k <- length(x[1,])
n <- length(x[,1])
colnames(x)[par1]
x[,par1]
if (par2 == 'kmeans') {
cl <- kmeans(x[,par1], par3)
print(cl)
clm <- matrix(cbind(cl$centers,1:par3),ncol=2)
clm <- clm[sort.list(clm[,1]),]
for (i in 1:par3) {
cl$cluster[cl$cluster==clm[i,2]] <- paste('C',i,sep='')
}
cl$cluster <- as.factor(cl$cluster)
print(cl$cluster)
x[,par1] <- cl$cluster
}
if (par2 == 'quantiles') {
x[,par1] <- cut2(x[,par1],g=par3)
}
if (par2 == 'hclust') {
hc <- hclust(dist(x[,par1])^2, 'cen')
print(hc)
memb <- cutree(hc, k = par3)
dum <- c(mean(x[memb==1,par1]))
for (i in 2:par3) {
dum <- c(dum, mean(x[memb==i,par1]))
}
hcm <- matrix(cbind(dum,1:par3),ncol=2)
hcm <- hcm[sort.list(hcm[,1]),]
for (i in 1:par3) {
memb[memb==hcm[i,2]] <- paste('C',i,sep='')
}
memb <- as.factor(memb)
print(memb)
x[,par1] <- memb
}
if (par2=='equal') {
ed <- cut(as.numeric(x[,par1]),par3,labels=paste('C',1:par3,sep=''))
x[,par1] <- as.factor(ed)
}
table(x[,par1])
colnames(x)
colnames(x)[par1]
x[,par1]
if (par2 == 'none') {
m <- ctree(as.formula(paste(colnames(x)[par1],' ~ .',sep='')),data = x)
}
load(file='createtable')
if (par2 != 'none') {
m <- ctree(as.formula(paste('as.factor(',colnames(x)[par1],') ~ .',sep='')),data = x)
if (par4=='yes') {
a<-table.start()
a<-table.row.start(a)
a<-table.element(a,'10-Fold Cross Validation',3+2*par3,TRUE)
a<-table.row.end(a)
a<-table.row.start(a)
a<-table.element(a,'',1,TRUE)
a<-table.element(a,'Prediction (training)',par3+1,TRUE)
a<-table.element(a,'Prediction (testing)',par3+1,TRUE)
a<-table.row.end(a)
a<-table.row.start(a)
a<-table.element(a,'Actual',1,TRUE)
for (jjj in 1:par3) a<-table.element(a,paste('C',jjj,sep=''),1,TRUE)
a<-table.element(a,'CV',1,TRUE)
for (jjj in 1:par3) a<-table.element(a,paste('C',jjj,sep=''),1,TRUE)
a<-table.element(a,'CV',1,TRUE)
a<-table.row.end(a)
for (i in 1:10) {
ind <- sample(2, nrow(x), replace=T, prob=c(0.9,0.1))
m.ct <- ctree(as.formula(paste('as.factor(',colnames(x)[par1],') ~ .',sep='')),data =x[ind==1,])
if (i==1) {
m.ct.i.pred <- predict(m.ct, newdata=x[ind==1,])
m.ct.i.actu <- x[ind==1,par1]
m.ct.x.pred <- predict(m.ct, newdata=x[ind==2,])
m.ct.x.actu <- x[ind==2,par1]
} else {
m.ct.i.pred <- c(m.ct.i.pred,predict(m.ct, newdata=x[ind==1,]))
m.ct.i.actu <- c(m.ct.i.actu,x[ind==1,par1])
m.ct.x.pred <- c(m.ct.x.pred,predict(m.ct, newdata=x[ind==2,]))
m.ct.x.actu <- c(m.ct.x.actu,x[ind==2,par1])
}
}
print(m.ct.i.tab <- table(m.ct.i.actu,m.ct.i.pred))
numer <- 0
for (i in 1:par3) {
print(m.ct.i.tab[i,i] / sum(m.ct.i.tab[i,]))
numer <- numer + m.ct.i.tab[i,i]
}
print(m.ct.i.cp <- numer / sum(m.ct.i.tab))
print(m.ct.x.tab <- table(m.ct.x.actu,m.ct.x.pred))
numer <- 0
for (i in 1:par3) {
print(m.ct.x.tab[i,i] / sum(m.ct.x.tab[i,]))
numer <- numer + m.ct.x.tab[i,i]
}
print(m.ct.x.cp <- numer / sum(m.ct.x.tab))
for (i in 1:par3) {
a<-table.row.start(a)
a<-table.element(a,paste('C',i,sep=''),1,TRUE)
for (jjj in 1:par3) a<-table.element(a,m.ct.i.tab[i,jjj])
a<-table.element(a,round(m.ct.i.tab[i,i]/sum(m.ct.i.tab[i,]),4))
for (jjj in 1:par3) a<-table.element(a,m.ct.x.tab[i,jjj])
a<-table.element(a,round(m.ct.x.tab[i,i]/sum(m.ct.x.tab[i,]),4))
a<-table.row.end(a)
}
a<-table.row.start(a)
a<-table.element(a,'Overall',1,TRUE)
for (jjj in 1:par3) a<-table.element(a,'-')
a<-table.element(a,round(m.ct.i.cp,4))
for (jjj in 1:par3) a<-table.element(a,'-')
a<-table.element(a,round(m.ct.x.cp,4))
a<-table.row.end(a)
a<-table.end(a)
table.save(a,file='mytable3.tab')
}
}
m
bitmap(file='test1.png')
plot(m)
dev.off()
bitmap(file='test1a.png')
plot(x[,par1] ~ as.factor(where(m)),main='Response by Terminal Node',xlab='Terminal Node',ylab='Response')
dev.off()
if (par2 == 'none') {
forec <- predict(m)
result <- as.data.frame(cbind(x[,par1],forec,x[,par1]-forec))
colnames(result) <- c('Actuals','Forecasts','Residuals')
print(result)
}
if (par2 != 'none') {
print(cbind(as.factor(x[,par1]),predict(m)))
myt <- table(as.factor(x[,par1]),predict(m))
print(myt)
}
bitmap(file='test2.png')
if(par2=='none') {
op <- par(mfrow=c(2,2))
plot(density(result$Actuals),main='Kernel Density Plot of Actuals')
plot(density(result$Residuals),main='Kernel Density Plot of Residuals')
plot(result$Forecasts,result$Actuals,main='Actuals versus Predictions',xlab='Predictions',ylab='Actuals')
plot(density(result$Forecasts),main='Kernel Density Plot of Predictions')
par(op)
}
if(par2!='none') {
plot(myt,main='Confusion Matrix',xlab='Actual',ylab='Predicted')
}
dev.off()
if (par2 == 'none') {
detcoef <- cor(result$Forecasts,result$Actuals)
a<-table.start()
a<-table.row.start(a)
a<-table.element(a,'Goodness of Fit',2,TRUE)
a<-table.row.end(a)
a<-table.row.start(a)
a<-table.element(a,'Correlation',1,TRUE)
a<-table.element(a,round(detcoef,4))
a<-table.row.end(a)
a<-table.row.start(a)
a<-table.element(a,'R-squared',1,TRUE)
a<-table.element(a,round(detcoef*detcoef,4))
a<-table.row.end(a)
a<-table.row.start(a)
a<-table.element(a,'RMSE',1,TRUE)
a<-table.element(a,round(sqrt(mean((result$Residuals)^2)),4))
a<-table.row.end(a)
a<-table.end(a)
table.save(a,file='mytable1.tab')
a<-table.start()
a<-table.row.start(a)
a<-table.element(a,'Actuals, Predictions, and Residuals',4,TRUE)
a<-table.row.end(a)
a<-table.row.start(a)
a<-table.element(a,'#',header=TRUE)
a<-table.element(a,'Actuals',header=TRUE)
a<-table.element(a,'Forecasts',header=TRUE)
a<-table.element(a,'Residuals',header=TRUE)
a<-table.row.end(a)
for (i in 1:length(result$Actuals)) {
a<-table.row.start(a)
a<-table.element(a,i,header=TRUE)
a<-table.element(a,result$Actuals[i])
a<-table.element(a,result$Forecasts[i])
a<-table.element(a,result$Residuals[i])
a<-table.row.end(a)
}
a<-table.end(a)
table.save(a,file='mytable.tab')
}
if (par2 != 'none') {
a<-table.start()
a<-table.row.start(a)
a<-table.element(a,'Confusion Matrix (predicted in columns / actuals in rows)',par3+1,TRUE)
a<-table.row.end(a)
a<-table.row.start(a)
a<-table.element(a,'',1,TRUE)
for (i in 1:par3) {
a<-table.element(a,paste('C',i,sep=''),1,TRUE)
}
a<-table.row.end(a)
for (i in 1:par3) {
a<-table.row.start(a)
a<-table.element(a,paste('C',i,sep=''),1,TRUE)
for (j in 1:par3) {
a<-table.element(a,myt[i,j])
}
a<-table.row.end(a)
}
a<-table.end(a)
table.save(a,file='mytable2.tab')
}