| Multiple Linear Regression - Estimated Regression Equation |
| Spaarvermogen[t] = + 0.0493435035166121 + 3.52319756708551consumentenvertrouwen[t] -0.910838516689858economie[t] + 0.89239975891074Werkloosheid[t] -0.621014432131371`Financiën`[t] + e[t] |
| Multiple Linear Regression - Ordinary Least Squares | |||||
| Variable | Parameter | S.D. | T-STAT H0: parameter = 0 | 2-tail p-value | 1-tail p-value |
| (Intercept) | 0.0493435035166121 | 0.387484 | 0.1273 | 0.899133 | 0.449567 |
| consumentenvertrouwen | 3.52319756708551 | 0.237791 | 14.8163 | 0 | 0 |
| economie | -0.910838516689858 | 0.062362 | -14.6057 | 0 | 0 |
| Werkloosheid | 0.89239975891074 | 0.060726 | 14.6956 | 0 | 0 |
| `Financiën` | -0.621014432131371 | 0.161446 | -3.8466 | 0.000314 | 0.000157 |
| Multiple Linear Regression - Regression Statistics | |
| Multiple R | 0.960440364793394 |
| R-squared | 0.922445694324467 |
| Adjusted R-squared | 0.916805381184428 |
| F-TEST (value) | 163.545120886343 |
| F-TEST (DF numerator) | 4 |
| F-TEST (DF denominator) | 55 |
| p-value | 0 |
| Multiple Linear Regression - Residual Statistics | |
| Residual Standard Deviation | 1.21964691016139 |
| Sum Squared Residuals | 81.8146222006423 |
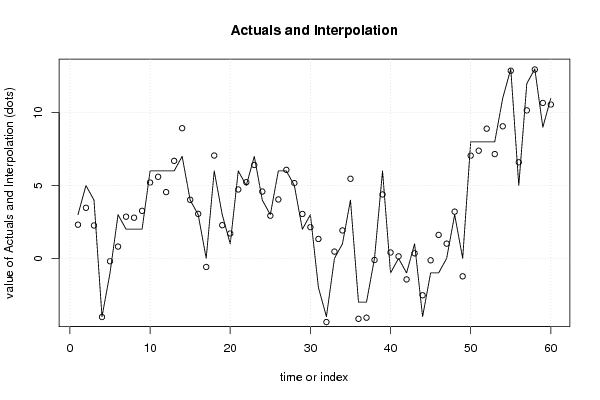
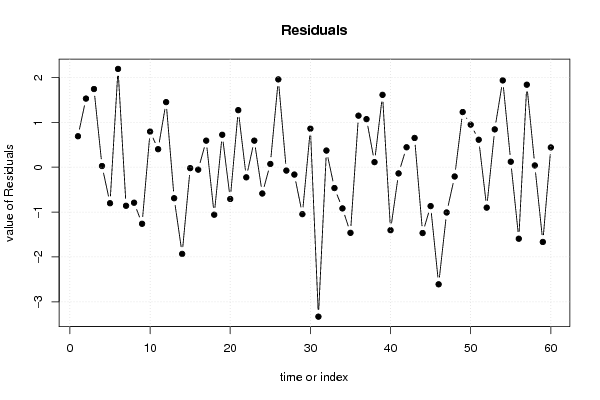
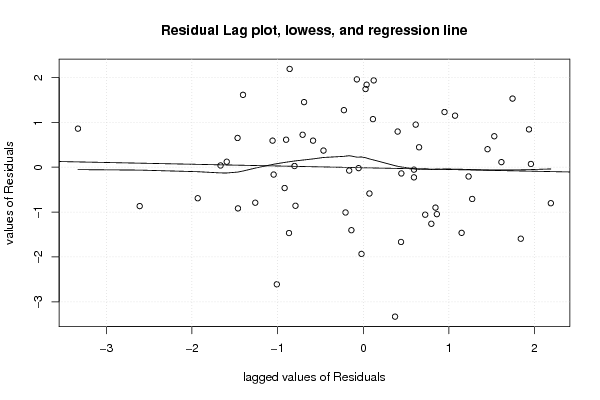
| Multiple Linear Regression - Actuals, Interpolation, and Residuals | |||
| Time or Index | Actuals | Interpolation Forecast | Residuals Prediction Error |
| 1 | 3 | 2.30976808316605 | 0.690231916833949 |
| 2 | 5 | 3.47024844916333 | 1.52975155083667 |
| 3 | 4 | 2.25695227826257 | 1.74304772173744 |
| 4 | -4 | -4.02672354967086 | 0.0267235496708553 |
| 5 | -1 | -0.197188729137605 | -0.802811270862395 |
| 6 | 3 | 0.809562341320345 | 2.19043765867966 |
| 7 | 2 | 2.85933284957516 | -0.85933284957516 |
| 8 | 2 | 2.79138300658541 | -0.791383006585406 |
| 9 | 2 | 3.26116861161133 | -1.26116861161133 |
| 10 | 6 | 5.2053417787345 | 0.794658221265502 |
| 11 | 6 | 5.59826273599077 | 0.401737264009231 |
| 12 | 6 | 4.54882896184787 | 1.45117103815213 |
| 13 | 6 | 6.6914024072176 | -0.691402407217597 |
| 14 | 7 | 8.93258397782894 | -1.93258397782894 |
| 15 | 4 | 4.02061746683141 | -0.0206174668314054 |
| 16 | 3 | 3.05446267680419 | -0.0544626768041934 |
| 17 | 0 | -0.592001006608421 | 0.592001006608421 |
| 18 | 6 | 7.05889539080471 | -1.05889539080471 |
| 19 | 3 | 2.27660933248032 | 0.72339066751968 |
| 20 | 1 | 1.70821560221278 | -0.708215602212779 |
| 21 | 6 | 4.72805476840697 | 1.27194523159303 |
| 22 | 5 | 5.22580308421123 | -0.225803084211227 |
| 23 | 7 | 6.40802692768045 | 0.591973072319546 |
| 24 | 4 | 4.58634989430074 | -0.586349894300739 |
| 25 | 3 | 2.92792610945956 | 0.072073890540445 |
| 26 | 6 | 4.04220010993903 | 1.95779989006097 |
| 27 | 6 | 6.0749109912177 | -0.0749109912177023 |
| 28 | 5 | 5.16407247452784 | -0.164072474527845 |
| 29 | 2 | 3.04635212328327 | -1.04635212328327 |
| 30 | 3 | 2.14054881213646 | 0.859451187863538 |
| 31 | -2 | 1.33142803734141 | -3.33142803734141 |
| 32 | -4 | -4.37122049067206 | 0.37122049067206 |
| 33 | 0 | 0.46465135513947 | -0.46465135513947 |
| 34 | 1 | 1.91826052538807 | -0.918260525388067 |
| 35 | 4 | 5.46300646690589 | -1.46300646690589 |
| 36 | -3 | -4.14857626651967 | 1.14857626651967 |
| 37 | -3 | -4.07171161875002 | 1.07171161875002 |
| 38 | 0 | -0.113105493762943 | 0.113105493762943 |
| 39 | 6 | 4.38689215397989 | 1.61310784602011 |
| 40 | -1 | 0.404202917451331 | -1.40420291745133 |
| 41 | 0 | 0.138622778798674 | -0.138622778798674 |
| 42 | -1 | -1.44466684412306 | 0.444666844123064 |
| 43 | 1 | 0.348277495894659 | 0.651722504105341 |
| 44 | -4 | -2.53235726462717 | -1.46764273537283 |
| 45 | -1 | -0.132957651020355 | -0.867042348979645 |
| 46 | -1 | 1.61047560378673 | -2.61047560378673 |
| 47 | 0 | 1.00927906023745 | -1.00927906023745 |
| 48 | 3 | 3.20716877894453 | -0.20716877894453 |
| 49 | 0 | -1.22997692148403 | 1.22997692148403 |
| 50 | 8 | 7.05126275802005 | 0.948737241979952 |
| 51 | 8 | 7.38748831113599 | 0.612511688864012 |
| 52 | 8 | 8.9009025021781 | -0.900902502178098 |
| 53 | 8 | 7.15669926478736 | 0.843300735212643 |
| 54 | 11 | 9.06476489893595 | 1.93523510106405 |
| 55 | 13 | 12.8777865505799 | 0.12221344942006 |
| 56 | 5 | 6.59411072264652 | -1.59411072264652 |
| 57 | 12 | 10.1606001416363 | 1.8393998583637 |
| 58 | 13 | 12.9610655346956 | 0.038934465304372 |
| 59 | 9 | 10.6664932796368 | -1.6664932796368 |
| 60 | 11 | 10.5591654526549 | 0.440834547345056 |
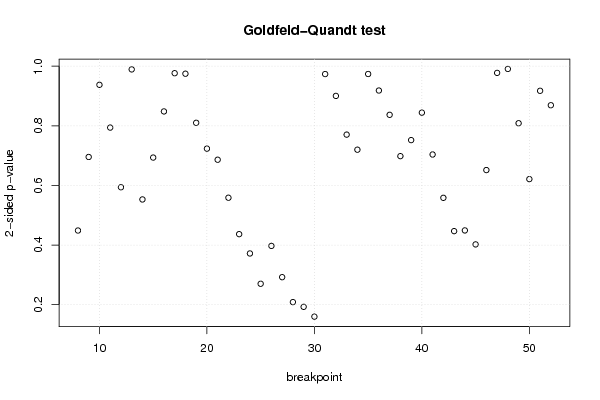
| Goldfeld-Quandt test for Heteroskedasticity | |||
| p-values | Alternative Hypothesis | ||
| breakpoint index | greater | 2-sided | less |
| 8 | 0.775680314328785 | 0.44863937134243 | 0.224319685671215 |
| 9 | 0.652306626638695 | 0.69538674672261 | 0.347693373361305 |
| 10 | 0.53122490089456 | 0.93755019821088 | 0.46877509910544 |
| 11 | 0.397015064568171 | 0.794030129136343 | 0.602984935431829 |
| 12 | 0.296910397473191 | 0.593820794946382 | 0.703089602526809 |
| 13 | 0.49462878581893 | 0.98925757163786 | 0.50537121418107 |
| 14 | 0.723563263392004 | 0.552873473215992 | 0.276436736607996 |
| 15 | 0.653290528635603 | 0.693418942728794 | 0.346709471364397 |
| 16 | 0.575883691455531 | 0.848232617088937 | 0.424116308544469 |
| 17 | 0.488250073221778 | 0.976500146443557 | 0.511749926778222 |
| 18 | 0.487394241422689 | 0.974788482845379 | 0.512605758577311 |
| 19 | 0.40502570459984 | 0.81005140919968 | 0.59497429540016 |
| 20 | 0.361677569341379 | 0.723355138682759 | 0.63832243065862 |
| 21 | 0.343072682980648 | 0.686145365961295 | 0.656927317019352 |
| 22 | 0.279325611867215 | 0.55865122373443 | 0.720674388132785 |
| 23 | 0.218216347138162 | 0.436432694276324 | 0.781783652861838 |
| 24 | 0.185818062578775 | 0.371636125157551 | 0.814181937421225 |
| 25 | 0.134998277478125 | 0.269996554956251 | 0.865001722521875 |
| 26 | 0.198512818232463 | 0.397025636464926 | 0.801487181767537 |
| 27 | 0.146031936297213 | 0.292063872594426 | 0.853968063702787 |
| 28 | 0.104231272799786 | 0.208462545599572 | 0.895768727200214 |
| 29 | 0.0962888606708994 | 0.192577721341799 | 0.9037111393291 |
| 30 | 0.0798081138772628 | 0.159616227754526 | 0.920191886122737 |
| 31 | 0.513176354258265 | 0.97364729148347 | 0.486823645741735 |
| 32 | 0.450142561989067 | 0.900285123978134 | 0.549857438010933 |
| 33 | 0.385210952538163 | 0.770421905076326 | 0.614789047461837 |
| 34 | 0.359912812958127 | 0.719825625916254 | 0.640087187041873 |
| 35 | 0.513077440974165 | 0.973845118051669 | 0.486922559025835 |
| 36 | 0.459198025032708 | 0.918396050065415 | 0.540801974967292 |
| 37 | 0.418438069744477 | 0.836876139488955 | 0.581561930255523 |
| 38 | 0.34907679699444 | 0.69815359398888 | 0.65092320300556 |
| 39 | 0.376034303859922 | 0.752068607719843 | 0.623965696140078 |
| 40 | 0.422075054048978 | 0.844150108097956 | 0.577924945951022 |
| 41 | 0.351865791726769 | 0.703731583453538 | 0.648134208273231 |
| 42 | 0.279159364655934 | 0.558318729311869 | 0.720840635344066 |
| 43 | 0.223292841538096 | 0.446585683076191 | 0.776707158461904 |
| 44 | 0.224472354904281 | 0.448944709808561 | 0.77552764509572 |
| 45 | 0.201053489984055 | 0.40210697996811 | 0.798946510015945 |
| 46 | 0.325729487706522 | 0.651458975413044 | 0.674270512293478 |
| 47 | 0.511228225109128 | 0.977543549781743 | 0.488771774890872 |
| 48 | 0.495393385225139 | 0.990786770450278 | 0.504606614774861 |
| 49 | 0.404306352383541 | 0.808612704767082 | 0.595693647616459 |
| 50 | 0.31055601205186 | 0.62111202410372 | 0.68944398794814 |
| 51 | 0.458744599568771 | 0.917489199137541 | 0.541255400431229 |
| 52 | 0.56549971488511 | 0.869000570229779 | 0.43450028511489 |
| Meta Analysis of Goldfeld-Quandt test for Heteroskedasticity | |||
| Description | # significant tests | % significant tests | OK/NOK |
| 1% type I error level | 0 | 0 | OK |
| 5% type I error level | 0 | 0 | OK |
| 10% type I error level | 0 | 0 | OK |