Free Statistics

of Irreproducible Research!

Author's title

Author*Unverified author*
R Software Modulerwasp_centraltendency.wasp
Title produced by softwareCentral Tendency
Date of computationWed, 14 Dec 2011 11:41:57 -0500
Cite this page as followsStatistical Computations at FreeStatistics.org, Office for Research Development and Education, URL https://freestatistics.org/blog/index.php?v=date/2011/Dec/14/t1323881676avmjhgqac5k74jy.htm/, Retrieved Wed, 01 May 2024 20:21:33 +0000
Statistical Computations at FreeStatistics.org, Office for Research Development and Education, URL https://freestatistics.org/blog/index.php?pk=155129, Retrieved Wed, 01 May 2024 20:21:33 +0000
QR Codes:

Original text written by user:
IsPrivate?No (this computation is public)
User-defined keywordsKDG2011W52a
Estimated Impact63
Family? (F = Feedback message, R = changed R code, M = changed R Module, P = changed Parameters, D = changed Data)
-       [Central Tendency] [centrummaten van ...] [2011-12-14 16:41:57] [23c029da43917b1445ec911a9179ae8a] [Current]
Feedback Forum

Post a new message
Dataseries X:
589,85
589,85
589,85
589,85
589,85
589,85
589,85
589,85
589,85
599,12
599,12
599,12
599
599
599
599
599
599
599
599
599
617,06
617,06
617,06
617,06
617,06
617,06
617,06
617,06
617,06
617,06
617,06
617,06
628,18
628,18
628,18
628,18
628,18
628,18
628,18
628,18
628,18
628,18
628,18
628,18
641,08
641,08
641,08
641,08
641,08
641,08
641,08
641,08
641,08
641,08
641,08
641,08
668,21
668,21
668,21
668,21
668,21
668,21
668,21
668,21
668,21
668,21
668,21
668,21
665,27
665,27
665,27


Summary of computational transaction
Raw Inputview raw input (R code)
Raw Outputview raw output of R engine
Computing time1 seconds
R Server'Gertrude Mary Cox' @ cox.wessa.net

\begin{tabular}{lllllllll}
\hline
Summary of computational transaction \tabularnewline
Raw Input & view raw input (R code)  \tabularnewline
Raw Output & view raw output of R engine  \tabularnewline
Computing time & 1 seconds \tabularnewline
R Server & 'Gertrude Mary Cox' @ cox.wessa.net \tabularnewline
\hline
\end{tabular}
%Source: https://freestatistics.org/blog/index.php?pk=155129&T=0

[TABLE]
[ROW][C]Summary of computational transaction[/C][/ROW]
[ROW][C]Raw Input[/C][C]view raw input (R code) [/C][/ROW]
[ROW][C]Raw Output[/C][C]view raw output of R engine [/C][/ROW]
[ROW][C]Computing time[/C][C]1 seconds[/C][/ROW]
[ROW][C]R Server[/C][C]'Gertrude Mary Cox' @ cox.wessa.net[/C][/ROW]
[/TABLE]
Source: https://freestatistics.org/blog/index.php?pk=155129&T=0

Globally Unique Identifier (entire table): ba.freestatistics.org/blog/index.php?pk=155129&T=0

As an alternative you can also use a QR Code:  

The GUIDs for individual cells are displayed in the table below:

Summary of computational transaction
Raw Inputview raw input (R code)
Raw Outputview raw output of R engine
Computing time1 seconds
R Server'Gertrude Mary Cox' @ cox.wessa.net


Central Tendency - Ungrouped Data
MeasureValueS.E.Value/S.E.
Arithmetic Mean627.0441666666673.1325410405134200.171093868222
Geometric Mean626.491462677127
Harmonic Mean625.941907573097
Quadratic Mean627.599471558095
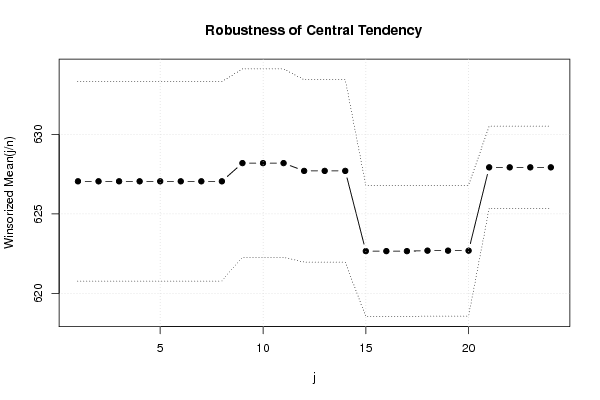
Winsorized Mean ( 1 / 24 )627.0441666666673.1325410405134200.171093868222
Winsorized Mean ( 2 / 24 )627.0441666666673.1325410405134200.171093868222
Winsorized Mean ( 3 / 24 )627.0441666666673.1325410405134200.171093868222
Winsorized Mean ( 4 / 24 )627.0441666666673.1325410405134200.171093868222
Winsorized Mean ( 5 / 24 )627.0441666666673.1325410405134200.171093868222
Winsorized Mean ( 6 / 24 )627.0441666666673.1325410405134200.171093868222
Winsorized Mean ( 7 / 24 )627.0441666666673.1325410405134200.171093868222
Winsorized Mean ( 8 / 24 )627.0441666666673.1325410405134200.171093868222
Winsorized Mean ( 9 / 24 )628.1879166666672.95693322642497212.44575665517
Winsorized Mean ( 10 / 24 )628.1879166666672.95693322642497212.44575665517
Winsorized Mean ( 11 / 24 )628.1879166666672.95693322642497212.44575665517
Winsorized Mean ( 12 / 24 )627.6979166666672.86495114582733219.095504501318
Winsorized Mean ( 13 / 24 )627.6979166666672.86495114582733219.095504501318
Winsorized Mean ( 14 / 24 )627.6979166666672.86495114582733219.095504501318
Winsorized Mean ( 15 / 24 )622.6583333333332.05754855693924302.621452715354
Winsorized Mean ( 16 / 24 )622.6583333333332.05754855693924302.621452715354
Winsorized Mean ( 17 / 24 )622.6583333333332.05754855693924302.621452715354
Winsorized Mean ( 18 / 24 )622.6883333333332.05269362901172303.351812726739
Winsorized Mean ( 19 / 24 )622.6883333333332.05269362901172303.351812726739
Winsorized Mean ( 20 / 24 )622.6883333333332.05269362901172303.351812726739
Winsorized Mean ( 21 / 24 )627.9208333333331.29468858603915484.99758173843
Winsorized Mean ( 22 / 24 )627.9208333333331.29468858603915484.99758173843
Winsorized Mean ( 23 / 24 )627.9208333333331.29468858603915484.99758173843
Winsorized Mean ( 24 / 24 )627.9208333333331.29468858603915484.99758173843
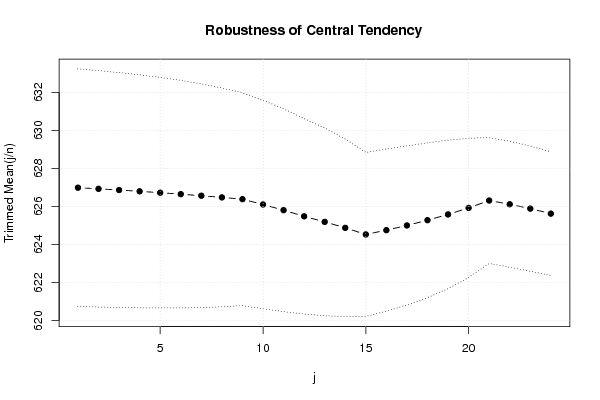
Trimmed Mean ( 1 / 24 )626.9874285714293.12224519528013200.813001336102
Trimmed Mean ( 2 / 24 )626.9273529411763.10788280678696201.721683833155
Trimmed Mean ( 3 / 24 )626.8636363636363.08869867692638202.953962795568
Trimmed Mean ( 4 / 24 )626.79593753.0637663782627204.583463656724
Trimmed Mean ( 5 / 24 )626.7238709677423.03193744184048206.707388588895
Trimmed Mean ( 6 / 24 )626.6472.99177055167978209.456904924798
Trimmed Mean ( 7 / 24 )626.5648275862072.94143030425815213.01365756624
Trimmed Mean ( 8 / 24 )626.4767857142862.87853788087506217.637151790353
Trimmed Mean ( 9 / 24 )626.3822222222222.79994221846473223.712553098928
Trimmed Mean ( 10 / 24 )626.1044230769232.74162593660754228.36974757091
Trimmed Mean ( 11 / 24 )625.80442.66663143248832234.679750780573
Trimmed Mean ( 12 / 24 )625.4793752.56994186480888243.382694202118
Trimmed Mean ( 13 / 24 )625.192.46831879650085253.285759070621
Trimmed Mean ( 14 / 24 )624.8743181818182.33492758528234267.620427340259
Trimmed Mean ( 15 / 24 )624.5285714285712.15656867545788289.593639440196
Trimmed Mean ( 16 / 24 )624.7532.13051475060937293.240401091477
Trimmed Mean ( 17 / 24 )625.0010526315792.09124353993279298.865742175426
Trimmed Mean ( 18 / 24 )625.2766666666672.03375038658156307.450054240759
Trimmed Mean ( 19 / 24 )625.5811764705881.95184175397697320.508143242625
Trimmed Mean ( 20 / 24 )625.923751.83225610917164341.613678822978
Trimmed Mean ( 21 / 24 )626.3121.65315097251614378.859529717807
Trimmed Mean ( 22 / 24 )626.1151.65585784765487378.121226340016
Trimmed Mean ( 23 / 24 )625.8876923076921.64810495443355379.762035557261
Trimmed Mean ( 24 / 24 )625.62251.62361437579998385.327026740414
Median628.18
Midrange629.03
Midmean - Weighted Average at Xnp621.3375
Midmean - Weighted Average at X(n+1)p626.492307692308
Midmean - Empirical Distribution Function621.3375
Midmean - Empirical Distribution Function - Averaging626.492307692308
Midmean - Empirical Distribution Function - Interpolation626.492307692308
Midmean - Closest Observation621.3375
Midmean - True Basic - Statistics Graphics Toolkit626.492307692308
Midmean - MS Excel (old versions)621.3375
Number of observations72

\begin{tabular}{lllllllll}
\hline
Central Tendency - Ungrouped Data \tabularnewline
Measure & Value & S.E. & Value/S.E. \tabularnewline
Arithmetic Mean & 627.044166666667 & 3.1325410405134 & 200.171093868222 \tabularnewline
Geometric Mean & 626.491462677127 &  &  \tabularnewline
Harmonic Mean & 625.941907573097 &  &  \tabularnewline
Quadratic Mean & 627.599471558095 &  &  \tabularnewline
Winsorized Mean ( 1 / 24 ) & 627.044166666667 & 3.1325410405134 & 200.171093868222 \tabularnewline
Winsorized Mean ( 2 / 24 ) & 627.044166666667 & 3.1325410405134 & 200.171093868222 \tabularnewline
Winsorized Mean ( 3 / 24 ) & 627.044166666667 & 3.1325410405134 & 200.171093868222 \tabularnewline
Winsorized Mean ( 4 / 24 ) & 627.044166666667 & 3.1325410405134 & 200.171093868222 \tabularnewline
Winsorized Mean ( 5 / 24 ) & 627.044166666667 & 3.1325410405134 & 200.171093868222 \tabularnewline
Winsorized Mean ( 6 / 24 ) & 627.044166666667 & 3.1325410405134 & 200.171093868222 \tabularnewline
Winsorized Mean ( 7 / 24 ) & 627.044166666667 & 3.1325410405134 & 200.171093868222 \tabularnewline
Winsorized Mean ( 8 / 24 ) & 627.044166666667 & 3.1325410405134 & 200.171093868222 \tabularnewline
Winsorized Mean ( 9 / 24 ) & 628.187916666667 & 2.95693322642497 & 212.44575665517 \tabularnewline
Winsorized Mean ( 10 / 24 ) & 628.187916666667 & 2.95693322642497 & 212.44575665517 \tabularnewline
Winsorized Mean ( 11 / 24 ) & 628.187916666667 & 2.95693322642497 & 212.44575665517 \tabularnewline
Winsorized Mean ( 12 / 24 ) & 627.697916666667 & 2.86495114582733 & 219.095504501318 \tabularnewline
Winsorized Mean ( 13 / 24 ) & 627.697916666667 & 2.86495114582733 & 219.095504501318 \tabularnewline
Winsorized Mean ( 14 / 24 ) & 627.697916666667 & 2.86495114582733 & 219.095504501318 \tabularnewline
Winsorized Mean ( 15 / 24 ) & 622.658333333333 & 2.05754855693924 & 302.621452715354 \tabularnewline
Winsorized Mean ( 16 / 24 ) & 622.658333333333 & 2.05754855693924 & 302.621452715354 \tabularnewline
Winsorized Mean ( 17 / 24 ) & 622.658333333333 & 2.05754855693924 & 302.621452715354 \tabularnewline
Winsorized Mean ( 18 / 24 ) & 622.688333333333 & 2.05269362901172 & 303.351812726739 \tabularnewline
Winsorized Mean ( 19 / 24 ) & 622.688333333333 & 2.05269362901172 & 303.351812726739 \tabularnewline
Winsorized Mean ( 20 / 24 ) & 622.688333333333 & 2.05269362901172 & 303.351812726739 \tabularnewline
Winsorized Mean ( 21 / 24 ) & 627.920833333333 & 1.29468858603915 & 484.99758173843 \tabularnewline
Winsorized Mean ( 22 / 24 ) & 627.920833333333 & 1.29468858603915 & 484.99758173843 \tabularnewline
Winsorized Mean ( 23 / 24 ) & 627.920833333333 & 1.29468858603915 & 484.99758173843 \tabularnewline
Winsorized Mean ( 24 / 24 ) & 627.920833333333 & 1.29468858603915 & 484.99758173843 \tabularnewline
Trimmed Mean ( 1 / 24 ) & 626.987428571429 & 3.12224519528013 & 200.813001336102 \tabularnewline
Trimmed Mean ( 2 / 24 ) & 626.927352941176 & 3.10788280678696 & 201.721683833155 \tabularnewline
Trimmed Mean ( 3 / 24 ) & 626.863636363636 & 3.08869867692638 & 202.953962795568 \tabularnewline
Trimmed Mean ( 4 / 24 ) & 626.7959375 & 3.0637663782627 & 204.583463656724 \tabularnewline
Trimmed Mean ( 5 / 24 ) & 626.723870967742 & 3.03193744184048 & 206.707388588895 \tabularnewline
Trimmed Mean ( 6 / 24 ) & 626.647 & 2.99177055167978 & 209.456904924798 \tabularnewline
Trimmed Mean ( 7 / 24 ) & 626.564827586207 & 2.94143030425815 & 213.01365756624 \tabularnewline
Trimmed Mean ( 8 / 24 ) & 626.476785714286 & 2.87853788087506 & 217.637151790353 \tabularnewline
Trimmed Mean ( 9 / 24 ) & 626.382222222222 & 2.79994221846473 & 223.712553098928 \tabularnewline
Trimmed Mean ( 10 / 24 ) & 626.104423076923 & 2.74162593660754 & 228.36974757091 \tabularnewline
Trimmed Mean ( 11 / 24 ) & 625.8044 & 2.66663143248832 & 234.679750780573 \tabularnewline
Trimmed Mean ( 12 / 24 ) & 625.479375 & 2.56994186480888 & 243.382694202118 \tabularnewline
Trimmed Mean ( 13 / 24 ) & 625.19 & 2.46831879650085 & 253.285759070621 \tabularnewline
Trimmed Mean ( 14 / 24 ) & 624.874318181818 & 2.33492758528234 & 267.620427340259 \tabularnewline
Trimmed Mean ( 15 / 24 ) & 624.528571428571 & 2.15656867545788 & 289.593639440196 \tabularnewline
Trimmed Mean ( 16 / 24 ) & 624.753 & 2.13051475060937 & 293.240401091477 \tabularnewline
Trimmed Mean ( 17 / 24 ) & 625.001052631579 & 2.09124353993279 & 298.865742175426 \tabularnewline
Trimmed Mean ( 18 / 24 ) & 625.276666666667 & 2.03375038658156 & 307.450054240759 \tabularnewline
Trimmed Mean ( 19 / 24 ) & 625.581176470588 & 1.95184175397697 & 320.508143242625 \tabularnewline
Trimmed Mean ( 20 / 24 ) & 625.92375 & 1.83225610917164 & 341.613678822978 \tabularnewline
Trimmed Mean ( 21 / 24 ) & 626.312 & 1.65315097251614 & 378.859529717807 \tabularnewline
Trimmed Mean ( 22 / 24 ) & 626.115 & 1.65585784765487 & 378.121226340016 \tabularnewline
Trimmed Mean ( 23 / 24 ) & 625.887692307692 & 1.64810495443355 & 379.762035557261 \tabularnewline
Trimmed Mean ( 24 / 24 ) & 625.6225 & 1.62361437579998 & 385.327026740414 \tabularnewline
Median & 628.18 &  &  \tabularnewline
Midrange & 629.03 &  &  \tabularnewline
Midmean - Weighted Average at Xnp & 621.3375 &  &  \tabularnewline
Midmean - Weighted Average at X(n+1)p & 626.492307692308 &  &  \tabularnewline
Midmean - Empirical Distribution Function & 621.3375 &  &  \tabularnewline
Midmean - Empirical Distribution Function - Averaging & 626.492307692308 &  &  \tabularnewline
Midmean - Empirical Distribution Function - Interpolation & 626.492307692308 &  &  \tabularnewline
Midmean - Closest Observation & 621.3375 &  &  \tabularnewline
Midmean - True Basic - Statistics Graphics Toolkit & 626.492307692308 &  &  \tabularnewline
Midmean - MS Excel (old versions) & 621.3375 &  &  \tabularnewline
Number of observations & 72 &  &  \tabularnewline
\hline
\end{tabular}
%Source: https://freestatistics.org/blog/index.php?pk=155129&T=1

[TABLE]
[ROW][C]Central Tendency - Ungrouped Data[/C][/ROW]
[ROW][C]Measure[/C][C]Value[/C][C]S.E.[/C][C]Value/S.E.[/C][/ROW]
[ROW][C]Arithmetic Mean[/C][C]627.044166666667[/C][C]3.1325410405134[/C][C]200.171093868222[/C][/ROW]
[ROW][C]Geometric Mean[/C][C]626.491462677127[/C][C][/C][C][/C][/ROW]
[ROW][C]Harmonic Mean[/C][C]625.941907573097[/C][C][/C][C][/C][/ROW]
[ROW][C]Quadratic Mean[/C][C]627.599471558095[/C][C][/C][C][/C][/ROW]
[ROW][C]Winsorized Mean ( 1 / 24 )[/C][C]627.044166666667[/C][C]3.1325410405134[/C][C]200.171093868222[/C][/ROW]
[ROW][C]Winsorized Mean ( 2 / 24 )[/C][C]627.044166666667[/C][C]3.1325410405134[/C][C]200.171093868222[/C][/ROW]
[ROW][C]Winsorized Mean ( 3 / 24 )[/C][C]627.044166666667[/C][C]3.1325410405134[/C][C]200.171093868222[/C][/ROW]
[ROW][C]Winsorized Mean ( 4 / 24 )[/C][C]627.044166666667[/C][C]3.1325410405134[/C][C]200.171093868222[/C][/ROW]
[ROW][C]Winsorized Mean ( 5 / 24 )[/C][C]627.044166666667[/C][C]3.1325410405134[/C][C]200.171093868222[/C][/ROW]
[ROW][C]Winsorized Mean ( 6 / 24 )[/C][C]627.044166666667[/C][C]3.1325410405134[/C][C]200.171093868222[/C][/ROW]
[ROW][C]Winsorized Mean ( 7 / 24 )[/C][C]627.044166666667[/C][C]3.1325410405134[/C][C]200.171093868222[/C][/ROW]
[ROW][C]Winsorized Mean ( 8 / 24 )[/C][C]627.044166666667[/C][C]3.1325410405134[/C][C]200.171093868222[/C][/ROW]
[ROW][C]Winsorized Mean ( 9 / 24 )[/C][C]628.187916666667[/C][C]2.95693322642497[/C][C]212.44575665517[/C][/ROW]
[ROW][C]Winsorized Mean ( 10 / 24 )[/C][C]628.187916666667[/C][C]2.95693322642497[/C][C]212.44575665517[/C][/ROW]
[ROW][C]Winsorized Mean ( 11 / 24 )[/C][C]628.187916666667[/C][C]2.95693322642497[/C][C]212.44575665517[/C][/ROW]
[ROW][C]Winsorized Mean ( 12 / 24 )[/C][C]627.697916666667[/C][C]2.86495114582733[/C][C]219.095504501318[/C][/ROW]
[ROW][C]Winsorized Mean ( 13 / 24 )[/C][C]627.697916666667[/C][C]2.86495114582733[/C][C]219.095504501318[/C][/ROW]
[ROW][C]Winsorized Mean ( 14 / 24 )[/C][C]627.697916666667[/C][C]2.86495114582733[/C][C]219.095504501318[/C][/ROW]
[ROW][C]Winsorized Mean ( 15 / 24 )[/C][C]622.658333333333[/C][C]2.05754855693924[/C][C]302.621452715354[/C][/ROW]
[ROW][C]Winsorized Mean ( 16 / 24 )[/C][C]622.658333333333[/C][C]2.05754855693924[/C][C]302.621452715354[/C][/ROW]
[ROW][C]Winsorized Mean ( 17 / 24 )[/C][C]622.658333333333[/C][C]2.05754855693924[/C][C]302.621452715354[/C][/ROW]
[ROW][C]Winsorized Mean ( 18 / 24 )[/C][C]622.688333333333[/C][C]2.05269362901172[/C][C]303.351812726739[/C][/ROW]
[ROW][C]Winsorized Mean ( 19 / 24 )[/C][C]622.688333333333[/C][C]2.05269362901172[/C][C]303.351812726739[/C][/ROW]
[ROW][C]Winsorized Mean ( 20 / 24 )[/C][C]622.688333333333[/C][C]2.05269362901172[/C][C]303.351812726739[/C][/ROW]
[ROW][C]Winsorized Mean ( 21 / 24 )[/C][C]627.920833333333[/C][C]1.29468858603915[/C][C]484.99758173843[/C][/ROW]
[ROW][C]Winsorized Mean ( 22 / 24 )[/C][C]627.920833333333[/C][C]1.29468858603915[/C][C]484.99758173843[/C][/ROW]
[ROW][C]Winsorized Mean ( 23 / 24 )[/C][C]627.920833333333[/C][C]1.29468858603915[/C][C]484.99758173843[/C][/ROW]
[ROW][C]Winsorized Mean ( 24 / 24 )[/C][C]627.920833333333[/C][C]1.29468858603915[/C][C]484.99758173843[/C][/ROW]
[ROW][C]Trimmed Mean ( 1 / 24 )[/C][C]626.987428571429[/C][C]3.12224519528013[/C][C]200.813001336102[/C][/ROW]
[ROW][C]Trimmed Mean ( 2 / 24 )[/C][C]626.927352941176[/C][C]3.10788280678696[/C][C]201.721683833155[/C][/ROW]
[ROW][C]Trimmed Mean ( 3 / 24 )[/C][C]626.863636363636[/C][C]3.08869867692638[/C][C]202.953962795568[/C][/ROW]
[ROW][C]Trimmed Mean ( 4 / 24 )[/C][C]626.7959375[/C][C]3.0637663782627[/C][C]204.583463656724[/C][/ROW]
[ROW][C]Trimmed Mean ( 5 / 24 )[/C][C]626.723870967742[/C][C]3.03193744184048[/C][C]206.707388588895[/C][/ROW]
[ROW][C]Trimmed Mean ( 6 / 24 )[/C][C]626.647[/C][C]2.99177055167978[/C][C]209.456904924798[/C][/ROW]
[ROW][C]Trimmed Mean ( 7 / 24 )[/C][C]626.564827586207[/C][C]2.94143030425815[/C][C]213.01365756624[/C][/ROW]
[ROW][C]Trimmed Mean ( 8 / 24 )[/C][C]626.476785714286[/C][C]2.87853788087506[/C][C]217.637151790353[/C][/ROW]
[ROW][C]Trimmed Mean ( 9 / 24 )[/C][C]626.382222222222[/C][C]2.79994221846473[/C][C]223.712553098928[/C][/ROW]
[ROW][C]Trimmed Mean ( 10 / 24 )[/C][C]626.104423076923[/C][C]2.74162593660754[/C][C]228.36974757091[/C][/ROW]
[ROW][C]Trimmed Mean ( 11 / 24 )[/C][C]625.8044[/C][C]2.66663143248832[/C][C]234.679750780573[/C][/ROW]
[ROW][C]Trimmed Mean ( 12 / 24 )[/C][C]625.479375[/C][C]2.56994186480888[/C][C]243.382694202118[/C][/ROW]
[ROW][C]Trimmed Mean ( 13 / 24 )[/C][C]625.19[/C][C]2.46831879650085[/C][C]253.285759070621[/C][/ROW]
[ROW][C]Trimmed Mean ( 14 / 24 )[/C][C]624.874318181818[/C][C]2.33492758528234[/C][C]267.620427340259[/C][/ROW]
[ROW][C]Trimmed Mean ( 15 / 24 )[/C][C]624.528571428571[/C][C]2.15656867545788[/C][C]289.593639440196[/C][/ROW]
[ROW][C]Trimmed Mean ( 16 / 24 )[/C][C]624.753[/C][C]2.13051475060937[/C][C]293.240401091477[/C][/ROW]
[ROW][C]Trimmed Mean ( 17 / 24 )[/C][C]625.001052631579[/C][C]2.09124353993279[/C][C]298.865742175426[/C][/ROW]
[ROW][C]Trimmed Mean ( 18 / 24 )[/C][C]625.276666666667[/C][C]2.03375038658156[/C][C]307.450054240759[/C][/ROW]
[ROW][C]Trimmed Mean ( 19 / 24 )[/C][C]625.581176470588[/C][C]1.95184175397697[/C][C]320.508143242625[/C][/ROW]
[ROW][C]Trimmed Mean ( 20 / 24 )[/C][C]625.92375[/C][C]1.83225610917164[/C][C]341.613678822978[/C][/ROW]
[ROW][C]Trimmed Mean ( 21 / 24 )[/C][C]626.312[/C][C]1.65315097251614[/C][C]378.859529717807[/C][/ROW]
[ROW][C]Trimmed Mean ( 22 / 24 )[/C][C]626.115[/C][C]1.65585784765487[/C][C]378.121226340016[/C][/ROW]
[ROW][C]Trimmed Mean ( 23 / 24 )[/C][C]625.887692307692[/C][C]1.64810495443355[/C][C]379.762035557261[/C][/ROW]
[ROW][C]Trimmed Mean ( 24 / 24 )[/C][C]625.6225[/C][C]1.62361437579998[/C][C]385.327026740414[/C][/ROW]
[ROW][C]Median[/C][C]628.18[/C][C][/C][C][/C][/ROW]
[ROW][C]Midrange[/C][C]629.03[/C][C][/C][C][/C][/ROW]
[ROW][C]Midmean - Weighted Average at Xnp[/C][C]621.3375[/C][C][/C][C][/C][/ROW]
[ROW][C]Midmean - Weighted Average at X(n+1)p[/C][C]626.492307692308[/C][C][/C][C][/C][/ROW]
[ROW][C]Midmean - Empirical Distribution Function[/C][C]621.3375[/C][C][/C][C][/C][/ROW]
[ROW][C]Midmean - Empirical Distribution Function - Averaging[/C][C]626.492307692308[/C][C][/C][C][/C][/ROW]
[ROW][C]Midmean - Empirical Distribution Function - Interpolation[/C][C]626.492307692308[/C][C][/C][C][/C][/ROW]
[ROW][C]Midmean - Closest Observation[/C][C]621.3375[/C][C][/C][C][/C][/ROW]
[ROW][C]Midmean - True Basic - Statistics Graphics Toolkit[/C][C]626.492307692308[/C][C][/C][C][/C][/ROW]
[ROW][C]Midmean - MS Excel (old versions)[/C][C]621.3375[/C][C][/C][C][/C][/ROW]
[ROW][C]Number of observations[/C][C]72[/C][C][/C][C][/C][/ROW]
[/TABLE]
Source: https://freestatistics.org/blog/index.php?pk=155129&T=1

Globally Unique Identifier (entire table): ba.freestatistics.org/blog/index.php?pk=155129&T=1

As an alternative you can also use a QR Code:  

The GUIDs for individual cells are displayed in the table below:

Central Tendency - Ungrouped Data
MeasureValueS.E.Value/S.E.
Arithmetic Mean627.0441666666673.1325410405134200.171093868222
Geometric Mean626.491462677127
Harmonic Mean625.941907573097
Quadratic Mean627.599471558095
Winsorized Mean ( 1 / 24 )627.0441666666673.1325410405134200.171093868222
Winsorized Mean ( 2 / 24 )627.0441666666673.1325410405134200.171093868222
Winsorized Mean ( 3 / 24 )627.0441666666673.1325410405134200.171093868222
Winsorized Mean ( 4 / 24 )627.0441666666673.1325410405134200.171093868222
Winsorized Mean ( 5 / 24 )627.0441666666673.1325410405134200.171093868222
Winsorized Mean ( 6 / 24 )627.0441666666673.1325410405134200.171093868222
Winsorized Mean ( 7 / 24 )627.0441666666673.1325410405134200.171093868222
Winsorized Mean ( 8 / 24 )627.0441666666673.1325410405134200.171093868222
Winsorized Mean ( 9 / 24 )628.1879166666672.95693322642497212.44575665517
Winsorized Mean ( 10 / 24 )628.1879166666672.95693322642497212.44575665517
Winsorized Mean ( 11 / 24 )628.1879166666672.95693322642497212.44575665517
Winsorized Mean ( 12 / 24 )627.6979166666672.86495114582733219.095504501318
Winsorized Mean ( 13 / 24 )627.6979166666672.86495114582733219.095504501318
Winsorized Mean ( 14 / 24 )627.6979166666672.86495114582733219.095504501318
Winsorized Mean ( 15 / 24 )622.6583333333332.05754855693924302.621452715354
Winsorized Mean ( 16 / 24 )622.6583333333332.05754855693924302.621452715354
Winsorized Mean ( 17 / 24 )622.6583333333332.05754855693924302.621452715354
Winsorized Mean ( 18 / 24 )622.6883333333332.05269362901172303.351812726739
Winsorized Mean ( 19 / 24 )622.6883333333332.05269362901172303.351812726739
Winsorized Mean ( 20 / 24 )622.6883333333332.05269362901172303.351812726739
Winsorized Mean ( 21 / 24 )627.9208333333331.29468858603915484.99758173843
Winsorized Mean ( 22 / 24 )627.9208333333331.29468858603915484.99758173843
Winsorized Mean ( 23 / 24 )627.9208333333331.29468858603915484.99758173843
Winsorized Mean ( 24 / 24 )627.9208333333331.29468858603915484.99758173843
Trimmed Mean ( 1 / 24 )626.9874285714293.12224519528013200.813001336102
Trimmed Mean ( 2 / 24 )626.9273529411763.10788280678696201.721683833155
Trimmed Mean ( 3 / 24 )626.8636363636363.08869867692638202.953962795568
Trimmed Mean ( 4 / 24 )626.79593753.0637663782627204.583463656724
Trimmed Mean ( 5 / 24 )626.7238709677423.03193744184048206.707388588895
Trimmed Mean ( 6 / 24 )626.6472.99177055167978209.456904924798
Trimmed Mean ( 7 / 24 )626.5648275862072.94143030425815213.01365756624
Trimmed Mean ( 8 / 24 )626.4767857142862.87853788087506217.637151790353
Trimmed Mean ( 9 / 24 )626.3822222222222.79994221846473223.712553098928
Trimmed Mean ( 10 / 24 )626.1044230769232.74162593660754228.36974757091
Trimmed Mean ( 11 / 24 )625.80442.66663143248832234.679750780573
Trimmed Mean ( 12 / 24 )625.4793752.56994186480888243.382694202118
Trimmed Mean ( 13 / 24 )625.192.46831879650085253.285759070621
Trimmed Mean ( 14 / 24 )624.8743181818182.33492758528234267.620427340259
Trimmed Mean ( 15 / 24 )624.5285714285712.15656867545788289.593639440196
Trimmed Mean ( 16 / 24 )624.7532.13051475060937293.240401091477
Trimmed Mean ( 17 / 24 )625.0010526315792.09124353993279298.865742175426
Trimmed Mean ( 18 / 24 )625.2766666666672.03375038658156307.450054240759
Trimmed Mean ( 19 / 24 )625.5811764705881.95184175397697320.508143242625
Trimmed Mean ( 20 / 24 )625.923751.83225610917164341.613678822978
Trimmed Mean ( 21 / 24 )626.3121.65315097251614378.859529717807
Trimmed Mean ( 22 / 24 )626.1151.65585784765487378.121226340016
Trimmed Mean ( 23 / 24 )625.8876923076921.64810495443355379.762035557261
Trimmed Mean ( 24 / 24 )625.62251.62361437579998385.327026740414
Median628.18
Midrange629.03
Midmean - Weighted Average at Xnp621.3375
Midmean - Weighted Average at X(n+1)p626.492307692308
Midmean - Empirical Distribution Function621.3375
Midmean - Empirical Distribution Function - Averaging626.492307692308
Midmean - Empirical Distribution Function - Interpolation626.492307692308
Midmean - Closest Observation621.3375
Midmean - True Basic - Statistics Graphics Toolkit626.492307692308
Midmean - MS Excel (old versions)621.3375
Number of observations72


Parameters (Session):
Parameters (R input):
R code (references can be found in the software module):
geomean <- function(x) {
return(exp(mean(log(x))))
}
harmean <- function(x) {
return(1/mean(1/x))
}
quamean <- function(x) {
return(sqrt(mean(x*x)))
}
winmean <- function(x) {
x <-sort(x[!is.na(x)])
n<-length(x)
denom <- 3
nodenom <- n/denom
if (nodenom>40) denom <- n/40
sqrtn = sqrt(n)
roundnodenom = floor(nodenom)
win <- array(NA,dim=c(roundnodenom,2))
for (j in 1:roundnodenom) {
win[j,1] <- (j*x[j+1]+sum(x[(j+1):(n-j)])+j*x[n-j])/n
win[j,2] <- sd(c(rep(x[j+1],j),x[(j+1):(n-j)],rep(x[n-j],j)))/sqrtn
}
return(win)
}
trimean <- function(x) {
x <-sort(x[!is.na(x)])
n<-length(x)
denom <- 3
nodenom <- n/denom
if (nodenom>40) denom <- n/40
sqrtn = sqrt(n)
roundnodenom = floor(nodenom)
tri <- array(NA,dim=c(roundnodenom,2))
for (j in 1:roundnodenom) {
tri[j,1] <- mean(x,trim=j/n)
tri[j,2] <- sd(x[(j+1):(n-j)]) / sqrt(n-j*2)
}
return(tri)
}
midrange <- function(x) {
return((max(x)+min(x))/2)
}
q1 <- function(data,n,p,i,f) {
np <- n*p;
i <<- floor(np)
f <<- np - i
qvalue <- (1-f)*data[i] + f*data[i+1]
}
q2 <- function(data,n,p,i,f) {
np <- (n+1)*p
i <<- floor(np)
f <<- np - i
qvalue <- (1-f)*data[i] + f*data[i+1]
}
q3 <- function(data,n,p,i,f) {
np <- n*p
i <<- floor(np)
f <<- np - i
if (f==0) {
qvalue <- data[i]
} else {
qvalue <- data[i+1]
}
}
q4 <- function(data,n,p,i,f) {
np <- n*p
i <<- floor(np)
f <<- np - i
if (f==0) {
qvalue <- (data[i]+data[i+1])/2
} else {
qvalue <- data[i+1]
}
}
q5 <- function(data,n,p,i,f) {
np <- (n-1)*p
i <<- floor(np)
f <<- np - i
if (f==0) {
qvalue <- data[i+1]
} else {
qvalue <- data[i+1] + f*(data[i+2]-data[i+1])
}
}
q6 <- function(data,n,p,i,f) {
np <- n*p+0.5
i <<- floor(np)
f <<- np - i
qvalue <- data[i]
}
q7 <- function(data,n,p,i,f) {
np <- (n+1)*p
i <<- floor(np)
f <<- np - i
if (f==0) {
qvalue <- data[i]
} else {
qvalue <- f*data[i] + (1-f)*data[i+1]
}
}
q8 <- function(data,n,p,i,f) {
np <- (n+1)*p
i <<- floor(np)
f <<- np - i
if (f==0) {
qvalue <- data[i]
} else {
if (f == 0.5) {
qvalue <- (data[i]+data[i+1])/2
} else {
if (f < 0.5) {
qvalue <- data[i]
} else {
qvalue <- data[i+1]
}
}
}
}
midmean <- function(x,def) {
x <-sort(x[!is.na(x)])
n<-length(x)
if (def==1) {
qvalue1 <- q1(x,n,0.25,i,f)
qvalue3 <- q1(x,n,0.75,i,f)
}
if (def==2) {
qvalue1 <- q2(x,n,0.25,i,f)
qvalue3 <- q2(x,n,0.75,i,f)
}
if (def==3) {
qvalue1 <- q3(x,n,0.25,i,f)
qvalue3 <- q3(x,n,0.75,i,f)
}
if (def==4) {
qvalue1 <- q4(x,n,0.25,i,f)
qvalue3 <- q4(x,n,0.75,i,f)
}
if (def==5) {
qvalue1 <- q5(x,n,0.25,i,f)
qvalue3 <- q5(x,n,0.75,i,f)
}
if (def==6) {
qvalue1 <- q6(x,n,0.25,i,f)
qvalue3 <- q6(x,n,0.75,i,f)
}
if (def==7) {
qvalue1 <- q7(x,n,0.25,i,f)
qvalue3 <- q7(x,n,0.75,i,f)
}
if (def==8) {
qvalue1 <- q8(x,n,0.25,i,f)
qvalue3 <- q8(x,n,0.75,i,f)
}
midm <- 0
myn <- 0
roundno4 <- round(n/4)
round3no4 <- round(3*n/4)
for (i in 1:n) {
if ((x[i]>=qvalue1) & (x[i]<=qvalue3)){
midm = midm + x[i]
myn = myn + 1
}
}
midm = midm / myn
return(midm)
}
(arm <- mean(x))
sqrtn <- sqrt(length(x))
(armse <- sd(x) / sqrtn)
(armose <- arm / armse)
(geo <- geomean(x))
(har <- harmean(x))
(qua <- quamean(x))
(win <- winmean(x))
(tri <- trimean(x))
(midr <- midrange(x))
midm <- array(NA,dim=8)
for (j in 1:8) midm[j] <- midmean(x,j)
midm
bitmap(file='test1.png')
lb <- win[,1] - 2*win[,2]
ub <- win[,1] + 2*win[,2]
if ((ylimmin == '') | (ylimmax == '')) plot(win[,1],type='b',main=main, xlab='j', pch=19, ylab='Winsorized Mean(j/n)', ylim=c(min(lb),max(ub))) else plot(win[,1],type='l',main=main, xlab='j', pch=19, ylab='Winsorized Mean(j/n)', ylim=c(ylimmin,ylimmax))
lines(ub,lty=3)
lines(lb,lty=3)
grid()
dev.off()
bitmap(file='test2.png')
lb <- tri[,1] - 2*tri[,2]
ub <- tri[,1] + 2*tri[,2]
if ((ylimmin == '') | (ylimmax == '')) plot(tri[,1],type='b',main=main, xlab='j', pch=19, ylab='Trimmed Mean(j/n)', ylim=c(min(lb),max(ub))) else plot(tri[,1],type='l',main=main, xlab='j', pch=19, ylab='Trimmed Mean(j/n)', ylim=c(ylimmin,ylimmax))
lines(ub,lty=3)
lines(lb,lty=3)
grid()
dev.off()
load(file='createtable')
a<-table.start()
a<-table.row.start(a)
a<-table.element(a,'Central Tendency - Ungrouped Data',4,TRUE)
a<-table.row.end(a)
a<-table.row.start(a)
a<-table.element(a,'Measure',header=TRUE)
a<-table.element(a,'Value',header=TRUE)
a<-table.element(a,'S.E.',header=TRUE)
a<-table.element(a,'Value/S.E.',header=TRUE)
a<-table.row.end(a)
a<-table.row.start(a)
a<-table.element(a,hyperlink('arithmetic_mean.htm', 'Arithmetic Mean', 'click to view the definition of the Arithmetic Mean'),header=TRUE)
a<-table.element(a,arm)
a<-table.element(a,hyperlink('arithmetic_mean_standard_error.htm', armse, 'click to view the definition of the Standard Error of the Arithmetic Mean'))
a<-table.element(a,armose)
a<-table.row.end(a)
a<-table.row.start(a)
a<-table.element(a,hyperlink('geometric_mean.htm', 'Geometric Mean', 'click to view the definition of the Geometric Mean'),header=TRUE)
a<-table.element(a,geo)
a<-table.element(a,'')
a<-table.row.end(a)
a<-table.row.start(a)
a<-table.element(a,hyperlink('harmonic_mean.htm', 'Harmonic Mean', 'click to view the definition of the Harmonic Mean'),header=TRUE)
a<-table.element(a,har)
a<-table.element(a,'')
a<-table.row.end(a)
a<-table.row.start(a)
a<-table.element(a,hyperlink('quadratic_mean.htm', 'Quadratic Mean', 'click to view the definition of the Quadratic Mean'),header=TRUE)
a<-table.element(a,qua)
a<-table.element(a,'')
a<-table.row.end(a)
for (j in 1:length(win[,1])) {
a<-table.row.start(a)
mylabel <- paste('Winsorized Mean (',j)
mylabel <- paste(mylabel,'/')
mylabel <- paste(mylabel,length(win[,1]))
mylabel <- paste(mylabel,')')
a<-table.element(a,hyperlink('winsorized_mean.htm', mylabel, 'click to view the definition of the Winsorized Mean'),header=TRUE)
a<-table.element(a,win[j,1])
a<-table.element(a,win[j,2])
a<-table.element(a,win[j,1]/win[j,2])
a<-table.row.end(a)
}
for (j in 1:length(tri[,1])) {
a<-table.row.start(a)
mylabel <- paste('Trimmed Mean (',j)
mylabel <- paste(mylabel,'/')
mylabel <- paste(mylabel,length(tri[,1]))
mylabel <- paste(mylabel,')')
a<-table.element(a,hyperlink('arithmetic_mean.htm', mylabel, 'click to view the definition of the Trimmed Mean'),header=TRUE)
a<-table.element(a,tri[j,1])
a<-table.element(a,tri[j,2])
a<-table.element(a,tri[j,1]/tri[j,2])
a<-table.row.end(a)
}
a<-table.row.start(a)
a<-table.element(a,hyperlink('median_1.htm', 'Median', 'click to view the definition of the Median'),header=TRUE)
a<-table.element(a,median(x))
a<-table.element(a,'')
a<-table.row.end(a)
a<-table.row.start(a)
a<-table.element(a,hyperlink('midrange.htm', 'Midrange', 'click to view the definition of the Midrange'),header=TRUE)
a<-table.element(a,midr)
a<-table.element(a,'')
a<-table.row.end(a)
a<-table.row.start(a)
mymid <- hyperlink('midmean.htm', 'Midmean', 'click to view the definition of the Midmean')
mylabel <- paste(mymid,hyperlink('method_1.htm','Weighted Average at Xnp',''),sep=' - ')
a<-table.element(a,mylabel,header=TRUE)
a<-table.element(a,midm[1])
a<-table.element(a,'')
a<-table.row.end(a)
a<-table.row.start(a)
mymid <- hyperlink('midmean.htm', 'Midmean', 'click to view the definition of the Midmean')
mylabel <- paste(mymid,hyperlink('method_2.htm','Weighted Average at X(n+1)p',''),sep=' - ')
a<-table.element(a,mylabel,header=TRUE)
a<-table.element(a,midm[2])
a<-table.element(a,'')
a<-table.row.end(a)
a<-table.row.start(a)
mymid <- hyperlink('midmean.htm', 'Midmean', 'click to view the definition of the Midmean')
mylabel <- paste(mymid,hyperlink('method_3.htm','Empirical Distribution Function',''),sep=' - ')
a<-table.element(a,mylabel,header=TRUE)
a<-table.element(a,midm[3])
a<-table.element(a,'')
a<-table.row.end(a)
a<-table.row.start(a)
mymid <- hyperlink('midmean.htm', 'Midmean', 'click to view the definition of the Midmean')
mylabel <- paste(mymid,hyperlink('method_4.htm','Empirical Distribution Function - Averaging',''),sep=' - ')
a<-table.element(a,mylabel,header=TRUE)
a<-table.element(a,midm[4])
a<-table.element(a,'')
a<-table.row.end(a)
a<-table.row.start(a)
mymid <- hyperlink('midmean.htm', 'Midmean', 'click to view the definition of the Midmean')
mylabel <- paste(mymid,hyperlink('method_5.htm','Empirical Distribution Function - Interpolation',''),sep=' - ')
a<-table.element(a,mylabel,header=TRUE)
a<-table.element(a,midm[5])
a<-table.element(a,'')
a<-table.row.end(a)
a<-table.row.start(a)
mymid <- hyperlink('midmean.htm', 'Midmean', 'click to view the definition of the Midmean')
mylabel <- paste(mymid,hyperlink('method_6.htm','Closest Observation',''),sep=' - ')
a<-table.element(a,mylabel,header=TRUE)
a<-table.element(a,midm[6])
a<-table.element(a,'')
a<-table.row.end(a)
a<-table.row.start(a)
mymid <- hyperlink('midmean.htm', 'Midmean', 'click to view the definition of the Midmean')
mylabel <- paste(mymid,hyperlink('method_7.htm','True Basic - Statistics Graphics Toolkit',''),sep=' - ')
a<-table.element(a,mylabel,header=TRUE)
a<-table.element(a,midm[7])
a<-table.element(a,'')
a<-table.row.end(a)
a<-table.row.start(a)
mymid <- hyperlink('midmean.htm', 'Midmean', 'click to view the definition of the Midmean')
mylabel <- paste(mymid,hyperlink('method_8.htm','MS Excel (old versions)',''),sep=' - ')
a<-table.element(a,mylabel,header=TRUE)
a<-table.element(a,midm[8])
a<-table.element(a,'')
a<-table.row.end(a)
a<-table.row.start(a)
a<-table.element(a,'Number of observations',header=TRUE)
a<-table.element(a,length(x))
a<-table.element(a,'')
a<-table.row.end(a)
a<-table.end(a)
table.save(a,file='mytable.tab')