Free Statistics

of Irreproducible Research!

Author's title

Author*The author of this computation has been verified*
R Software Modulerwasp_autocorrelation.wasp
Title produced by software(Partial) Autocorrelation Function
Date of computationWed, 14 Dec 2011 10:52:43 -0500
Cite this page as followsStatistical Computations at FreeStatistics.org, Office for Research Development and Education, URL https://freestatistics.org/blog/index.php?v=date/2011/Dec/14/t1323877977upyvb2jn2hrpna7.htm/, Retrieved Wed, 01 May 2024 19:26:16 +0000
Statistical Computations at FreeStatistics.org, Office for Research Development and Education, URL https://freestatistics.org/blog/index.php?pk=155082, Retrieved Wed, 01 May 2024 19:26:16 +0000
QR Codes:

Original text written by user:
IsPrivate?No (this computation is public)
User-defined keywords
Estimated Impact144
Family? (F = Feedback message, R = changed R code, M = changed R Module, P = changed Parameters, D = changed Data)
-     [Univariate Data Series] [] [2008-12-08 19:22:39] [d2d412c7f4d35ffbf5ee5ee89db327d4]
- RMP   [Spectral Analysis] [] [2011-12-06 19:48:28] [b98453cac15ba1066b407e146608df68]
- R PD    [Spectral Analysis] [] [2011-12-14 15:31:08] [c53df38315e3cbde2dbe0de809195ef2]
- RMP       [(Partial) Autocorrelation Function] [] [2011-12-14 15:45:27] [c53df38315e3cbde2dbe0de809195ef2]
- R P           [(Partial) Autocorrelation Function] [] [2011-12-14 15:52:43] [ff205c8f94ca61ac7cf7eb30cad83105] [Current]
Feedback Forum

Post a new message
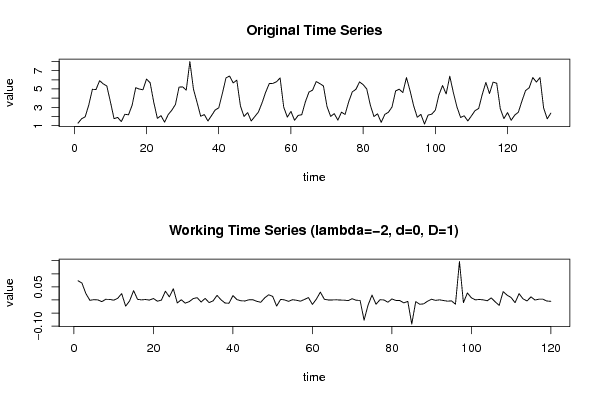
Dataseries X:
1.262
1.743
1.964
3.258
4.966
4.944
5.907
5.561
5.321
3.582
1.757
1.894
1.442
2.238
2.179
3.218
5.139
4.990
4.914
6.084
5.672
3.548
1.793
2.086
1.376
2.202
2.683
3.303
5.202
5.231
4.880
7.998
4.977
3.531
2.025
2.205
1.504
2.090
2.702
2.939
4.500
6.208
6.415
5.657
5.964
3.163
1.997
2.422
1.507
1.992
2.487
3.490
4.647
5.594
5.611
5.788
6.204
3.013
1.931
2.549
1.580
2.111
2.192
3.601
4.665
4.876
5.813
5.589
5.331
3.075
2.002
2.306
1.594
2.467
2.222
3.607
4.685
4.962
5.770
5.480
5.000
3.228
1.993
2.288
1.351
2.218
2.461
3.028
4.784
4.975
4.607
6.249
4.809
3.157
1.910
2.228
1.169
2.154
2.249
2.687
4.359
5.382
4.459
6.398
4.596
3.024
1.887
2.070
1.511
2.059
2.635
2.867
4.403
5.720
4.502
5.749
5.627
2.846
1.762
2.429
1.579
2.146
2.462
3.695
4.831
5.134
6.250
5.760
6.249
2.917
1.741
2.359


Summary of computational transaction
Raw Inputview raw input (R code)
Raw Outputview raw output of R engine
Computing time1 seconds
R Server'Gertrude Mary Cox' @ cox.wessa.net

\begin{tabular}{lllllllll}
\hline
Summary of computational transaction \tabularnewline
Raw Input & view raw input (R code)  \tabularnewline
Raw Output & view raw output of R engine  \tabularnewline
Computing time & 1 seconds \tabularnewline
R Server & 'Gertrude Mary Cox' @ cox.wessa.net \tabularnewline
\hline
\end{tabular}
%Source: https://freestatistics.org/blog/index.php?pk=155082&T=0

[TABLE]
[ROW][C]Summary of computational transaction[/C][/ROW]
[ROW][C]Raw Input[/C][C]view raw input (R code) [/C][/ROW]
[ROW][C]Raw Output[/C][C]view raw output of R engine [/C][/ROW]
[ROW][C]Computing time[/C][C]1 seconds[/C][/ROW]
[ROW][C]R Server[/C][C]'Gertrude Mary Cox' @ cox.wessa.net[/C][/ROW]
[/TABLE]
Source: https://freestatistics.org/blog/index.php?pk=155082&T=0

Globally Unique Identifier (entire table): ba.freestatistics.org/blog/index.php?pk=155082&T=0

As an alternative you can also use a QR Code:  

The GUIDs for individual cells are displayed in the table below:

Summary of computational transaction
Raw Inputview raw input (R code)
Raw Outputview raw output of R engine
Computing time1 seconds
R Server'Gertrude Mary Cox' @ cox.wessa.net


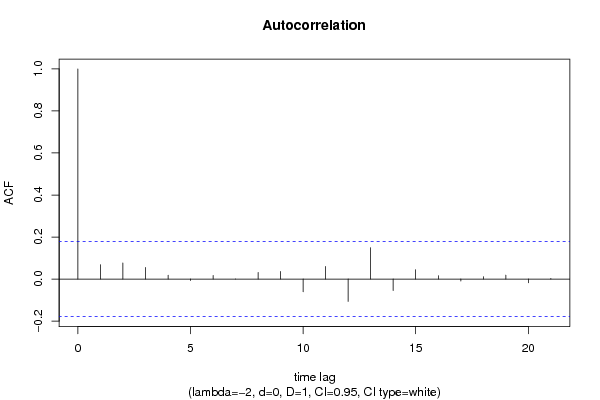
Autocorrelation Function
Time lag kACF(k)T-STATP-value
10.0683080.74830.227877
20.0766290.83940.201449
30.0550940.60350.273651
40.0185360.20310.419718
5-0.007135-0.07820.468917
60.017210.18850.425393
7-0.000402-0.00440.498246
80.0314280.34430.365618
90.0362770.39740.345893
10-0.060729-0.66530.253583
110.0596950.65390.257206
12-0.106315-1.16460.12324
130.1488721.63080.052776
14-0.054343-0.59530.276384
150.0440520.48260.315143
160.0161950.17740.429744
17-0.009196-0.10070.459963
180.01080.11830.453011
190.0186020.20380.419436
20-0.017711-0.1940.423244
210.0024840.02720.489169

\begin{tabular}{lllllllll}
\hline
Autocorrelation Function \tabularnewline
Time lag k & ACF(k) & T-STAT & P-value \tabularnewline
1 & 0.068308 & 0.7483 & 0.227877 \tabularnewline
2 & 0.076629 & 0.8394 & 0.201449 \tabularnewline
3 & 0.055094 & 0.6035 & 0.273651 \tabularnewline
4 & 0.018536 & 0.2031 & 0.419718 \tabularnewline
5 & -0.007135 & -0.0782 & 0.468917 \tabularnewline
6 & 0.01721 & 0.1885 & 0.425393 \tabularnewline
7 & -0.000402 & -0.0044 & 0.498246 \tabularnewline
8 & 0.031428 & 0.3443 & 0.365618 \tabularnewline
9 & 0.036277 & 0.3974 & 0.345893 \tabularnewline
10 & -0.060729 & -0.6653 & 0.253583 \tabularnewline
11 & 0.059695 & 0.6539 & 0.257206 \tabularnewline
12 & -0.106315 & -1.1646 & 0.12324 \tabularnewline
13 & 0.148872 & 1.6308 & 0.052776 \tabularnewline
14 & -0.054343 & -0.5953 & 0.276384 \tabularnewline
15 & 0.044052 & 0.4826 & 0.315143 \tabularnewline
16 & 0.016195 & 0.1774 & 0.429744 \tabularnewline
17 & -0.009196 & -0.1007 & 0.459963 \tabularnewline
18 & 0.0108 & 0.1183 & 0.453011 \tabularnewline
19 & 0.018602 & 0.2038 & 0.419436 \tabularnewline
20 & -0.017711 & -0.194 & 0.423244 \tabularnewline
21 & 0.002484 & 0.0272 & 0.489169 \tabularnewline
\hline
\end{tabular}
%Source: https://freestatistics.org/blog/index.php?pk=155082&T=1

[TABLE]
[ROW][C]Autocorrelation Function[/C][/ROW]
[ROW][C]Time lag k[/C][C]ACF(k)[/C][C]T-STAT[/C][C]P-value[/C][/ROW]
[ROW][C]1[/C][C]0.068308[/C][C]0.7483[/C][C]0.227877[/C][/ROW]
[ROW][C]2[/C][C]0.076629[/C][C]0.8394[/C][C]0.201449[/C][/ROW]
[ROW][C]3[/C][C]0.055094[/C][C]0.6035[/C][C]0.273651[/C][/ROW]
[ROW][C]4[/C][C]0.018536[/C][C]0.2031[/C][C]0.419718[/C][/ROW]
[ROW][C]5[/C][C]-0.007135[/C][C]-0.0782[/C][C]0.468917[/C][/ROW]
[ROW][C]6[/C][C]0.01721[/C][C]0.1885[/C][C]0.425393[/C][/ROW]
[ROW][C]7[/C][C]-0.000402[/C][C]-0.0044[/C][C]0.498246[/C][/ROW]
[ROW][C]8[/C][C]0.031428[/C][C]0.3443[/C][C]0.365618[/C][/ROW]
[ROW][C]9[/C][C]0.036277[/C][C]0.3974[/C][C]0.345893[/C][/ROW]
[ROW][C]10[/C][C]-0.060729[/C][C]-0.6653[/C][C]0.253583[/C][/ROW]
[ROW][C]11[/C][C]0.059695[/C][C]0.6539[/C][C]0.257206[/C][/ROW]
[ROW][C]12[/C][C]-0.106315[/C][C]-1.1646[/C][C]0.12324[/C][/ROW]
[ROW][C]13[/C][C]0.148872[/C][C]1.6308[/C][C]0.052776[/C][/ROW]
[ROW][C]14[/C][C]-0.054343[/C][C]-0.5953[/C][C]0.276384[/C][/ROW]
[ROW][C]15[/C][C]0.044052[/C][C]0.4826[/C][C]0.315143[/C][/ROW]
[ROW][C]16[/C][C]0.016195[/C][C]0.1774[/C][C]0.429744[/C][/ROW]
[ROW][C]17[/C][C]-0.009196[/C][C]-0.1007[/C][C]0.459963[/C][/ROW]
[ROW][C]18[/C][C]0.0108[/C][C]0.1183[/C][C]0.453011[/C][/ROW]
[ROW][C]19[/C][C]0.018602[/C][C]0.2038[/C][C]0.419436[/C][/ROW]
[ROW][C]20[/C][C]-0.017711[/C][C]-0.194[/C][C]0.423244[/C][/ROW]
[ROW][C]21[/C][C]0.002484[/C][C]0.0272[/C][C]0.489169[/C][/ROW]
[/TABLE]
Source: https://freestatistics.org/blog/index.php?pk=155082&T=1

Globally Unique Identifier (entire table): ba.freestatistics.org/blog/index.php?pk=155082&T=1

As an alternative you can also use a QR Code:  

The GUIDs for individual cells are displayed in the table below:

Autocorrelation Function
Time lag kACF(k)T-STATP-value
10.0683080.74830.227877
20.0766290.83940.201449
30.0550940.60350.273651
40.0185360.20310.419718
5-0.007135-0.07820.468917
60.017210.18850.425393
7-0.000402-0.00440.498246
80.0314280.34430.365618
90.0362770.39740.345893
10-0.060729-0.66530.253583
110.0596950.65390.257206
12-0.106315-1.16460.12324
130.1488721.63080.052776
14-0.054343-0.59530.276384
150.0440520.48260.315143
160.0161950.17740.429744
17-0.009196-0.10070.459963
180.01080.11830.453011
190.0186020.20380.419436
20-0.017711-0.1940.423244
210.0024840.02720.489169


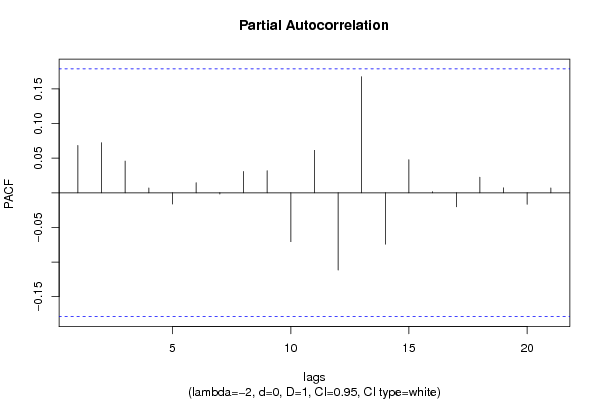
Partial Autocorrelation Function
Time lag kPACF(k)T-STATP-value
10.0683080.74830.227877
20.07230.7920.214959
30.045750.50120.308585
40.0068660.07520.470085
5-0.016177-0.17720.429823
60.0144680.15850.437168
7-0.001871-0.02050.491843
80.0307810.33720.368283
90.0319280.34980.363568
10-0.070575-0.77310.220488
110.0612680.67120.251707
12-0.111509-1.22150.112142
130.1676231.83620.034401
14-0.074146-0.81220.209134
150.0478540.52420.300548
160.0014980.01640.493467
17-0.020287-0.22220.412256
180.0225390.24690.402703
190.0071070.07790.469038
20-0.016596-0.18180.428021
210.0070420.07710.46932

\begin{tabular}{lllllllll}
\hline
Partial Autocorrelation Function \tabularnewline
Time lag k & PACF(k) & T-STAT & P-value \tabularnewline
1 & 0.068308 & 0.7483 & 0.227877 \tabularnewline
2 & 0.0723 & 0.792 & 0.214959 \tabularnewline
3 & 0.04575 & 0.5012 & 0.308585 \tabularnewline
4 & 0.006866 & 0.0752 & 0.470085 \tabularnewline
5 & -0.016177 & -0.1772 & 0.429823 \tabularnewline
6 & 0.014468 & 0.1585 & 0.437168 \tabularnewline
7 & -0.001871 & -0.0205 & 0.491843 \tabularnewline
8 & 0.030781 & 0.3372 & 0.368283 \tabularnewline
9 & 0.031928 & 0.3498 & 0.363568 \tabularnewline
10 & -0.070575 & -0.7731 & 0.220488 \tabularnewline
11 & 0.061268 & 0.6712 & 0.251707 \tabularnewline
12 & -0.111509 & -1.2215 & 0.112142 \tabularnewline
13 & 0.167623 & 1.8362 & 0.034401 \tabularnewline
14 & -0.074146 & -0.8122 & 0.209134 \tabularnewline
15 & 0.047854 & 0.5242 & 0.300548 \tabularnewline
16 & 0.001498 & 0.0164 & 0.493467 \tabularnewline
17 & -0.020287 & -0.2222 & 0.412256 \tabularnewline
18 & 0.022539 & 0.2469 & 0.402703 \tabularnewline
19 & 0.007107 & 0.0779 & 0.469038 \tabularnewline
20 & -0.016596 & -0.1818 & 0.428021 \tabularnewline
21 & 0.007042 & 0.0771 & 0.46932 \tabularnewline
\hline
\end{tabular}
%Source: https://freestatistics.org/blog/index.php?pk=155082&T=2

[TABLE]
[ROW][C]Partial Autocorrelation Function[/C][/ROW]
[ROW][C]Time lag k[/C][C]PACF(k)[/C][C]T-STAT[/C][C]P-value[/C][/ROW]
[ROW][C]1[/C][C]0.068308[/C][C]0.7483[/C][C]0.227877[/C][/ROW]
[ROW][C]2[/C][C]0.0723[/C][C]0.792[/C][C]0.214959[/C][/ROW]
[ROW][C]3[/C][C]0.04575[/C][C]0.5012[/C][C]0.308585[/C][/ROW]
[ROW][C]4[/C][C]0.006866[/C][C]0.0752[/C][C]0.470085[/C][/ROW]
[ROW][C]5[/C][C]-0.016177[/C][C]-0.1772[/C][C]0.429823[/C][/ROW]
[ROW][C]6[/C][C]0.014468[/C][C]0.1585[/C][C]0.437168[/C][/ROW]
[ROW][C]7[/C][C]-0.001871[/C][C]-0.0205[/C][C]0.491843[/C][/ROW]
[ROW][C]8[/C][C]0.030781[/C][C]0.3372[/C][C]0.368283[/C][/ROW]
[ROW][C]9[/C][C]0.031928[/C][C]0.3498[/C][C]0.363568[/C][/ROW]
[ROW][C]10[/C][C]-0.070575[/C][C]-0.7731[/C][C]0.220488[/C][/ROW]
[ROW][C]11[/C][C]0.061268[/C][C]0.6712[/C][C]0.251707[/C][/ROW]
[ROW][C]12[/C][C]-0.111509[/C][C]-1.2215[/C][C]0.112142[/C][/ROW]
[ROW][C]13[/C][C]0.167623[/C][C]1.8362[/C][C]0.034401[/C][/ROW]
[ROW][C]14[/C][C]-0.074146[/C][C]-0.8122[/C][C]0.209134[/C][/ROW]
[ROW][C]15[/C][C]0.047854[/C][C]0.5242[/C][C]0.300548[/C][/ROW]
[ROW][C]16[/C][C]0.001498[/C][C]0.0164[/C][C]0.493467[/C][/ROW]
[ROW][C]17[/C][C]-0.020287[/C][C]-0.2222[/C][C]0.412256[/C][/ROW]
[ROW][C]18[/C][C]0.022539[/C][C]0.2469[/C][C]0.402703[/C][/ROW]
[ROW][C]19[/C][C]0.007107[/C][C]0.0779[/C][C]0.469038[/C][/ROW]
[ROW][C]20[/C][C]-0.016596[/C][C]-0.1818[/C][C]0.428021[/C][/ROW]
[ROW][C]21[/C][C]0.007042[/C][C]0.0771[/C][C]0.46932[/C][/ROW]
[/TABLE]
Source: https://freestatistics.org/blog/index.php?pk=155082&T=2

Globally Unique Identifier (entire table): ba.freestatistics.org/blog/index.php?pk=155082&T=2

As an alternative you can also use a QR Code:  

The GUIDs for individual cells are displayed in the table below:

Partial Autocorrelation Function
Time lag kPACF(k)T-STATP-value
10.0683080.74830.227877
20.07230.7920.214959
30.045750.50120.308585
40.0068660.07520.470085
5-0.016177-0.17720.429823
60.0144680.15850.437168
7-0.001871-0.02050.491843
80.0307810.33720.368283
90.0319280.34980.363568
10-0.070575-0.77310.220488
110.0612680.67120.251707
12-0.111509-1.22150.112142
130.1676231.83620.034401
14-0.074146-0.81220.209134
150.0478540.52420.300548
160.0014980.01640.493467
17-0.020287-0.22220.412256
180.0225390.24690.402703
190.0071070.07790.469038
20-0.016596-0.18180.428021
210.0070420.07710.46932


Parameters (Session):
par1 = Default ; par2 = -2.0 ; par3 = 0 ; par4 = 1 ; par5 = 12 ; par6 = White Noise ; par7 = 0.95 ;
Parameters (R input):
par1 = Default ; par2 = -2.0 ; par3 = 0 ; par4 = 1 ; par5 = 12 ; par6 = White Noise ; par7 = 0.95 ; par8 = ;
R code (references can be found in the software module):
if (par1 == 'Default') {
par1 = 10*log10(length(x))
} else {
par1 <- as.numeric(par1)
}
par2 <- as.numeric(par2)
par3 <- as.numeric(par3)
par4 <- as.numeric(par4)
par5 <- as.numeric(par5)
if (par6 == 'White Noise') par6 <- 'white' else par6 <- 'ma'
par7 <- as.numeric(par7)
if (par8 != '') par8 <- as.numeric(par8)
ox <- x
if (par8 == '') {
if (par2 == 0) {
x <- log(x)
} else {
x <- (x ^ par2 - 1) / par2
}
} else {
x <- log(x,base=par8)
}
if (par3 > 0) x <- diff(x,lag=1,difference=par3)
if (par4 > 0) x <- diff(x,lag=par5,difference=par4)
bitmap(file='picts.png')
op <- par(mfrow=c(2,1))
plot(ox,type='l',main='Original Time Series',xlab='time',ylab='value')
if (par8=='') {
mytitle <- paste('Working Time Series (lambda=',par2,', d=',par3,', D=',par4,')',sep='')
mysub <- paste('(lambda=',par2,', d=',par3,', D=',par4,', CI=', par7, ', CI type=',par6,')',sep='')
} else {
mytitle <- paste('Working Time Series (base=',par8,', d=',par3,', D=',par4,')',sep='')
mysub <- paste('(base=',par8,', d=',par3,', D=',par4,', CI=', par7, ', CI type=',par6,')',sep='')
}
plot(x,type='l', main=mytitle,xlab='time',ylab='value')
par(op)
dev.off()
bitmap(file='pic1.png')
racf <- acf(x, par1, main='Autocorrelation', xlab='time lag', ylab='ACF', ci.type=par6, ci=par7, sub=mysub)
dev.off()
bitmap(file='pic2.png')
rpacf <- pacf(x,par1,main='Partial Autocorrelation',xlab='lags',ylab='PACF',sub=mysub)
dev.off()
(myacf <- c(racf$acf))
(mypacf <- c(rpacf$acf))
lengthx <- length(x)
sqrtn <- sqrt(lengthx)
load(file='createtable')
a<-table.start()
a<-table.row.start(a)
a<-table.element(a,'Autocorrelation Function',4,TRUE)
a<-table.row.end(a)
a<-table.row.start(a)
a<-table.element(a,'Time lag k',header=TRUE)
a<-table.element(a,hyperlink('basics.htm','ACF(k)','click here for more information about the Autocorrelation Function'),header=TRUE)
a<-table.element(a,'T-STAT',header=TRUE)
a<-table.element(a,'P-value',header=TRUE)
a<-table.row.end(a)
for (i in 2:(par1+1)) {
a<-table.row.start(a)
a<-table.element(a,i-1,header=TRUE)
a<-table.element(a,round(myacf[i],6))
mytstat <- myacf[i]*sqrtn
a<-table.element(a,round(mytstat,4))
a<-table.element(a,round(1-pt(abs(mytstat),lengthx),6))
a<-table.row.end(a)
}
a<-table.end(a)
table.save(a,file='mytable.tab')
a<-table.start()
a<-table.row.start(a)
a<-table.element(a,'Partial Autocorrelation Function',4,TRUE)
a<-table.row.end(a)
a<-table.row.start(a)
a<-table.element(a,'Time lag k',header=TRUE)
a<-table.element(a,hyperlink('basics.htm','PACF(k)','click here for more information about the Partial Autocorrelation Function'),header=TRUE)
a<-table.element(a,'T-STAT',header=TRUE)
a<-table.element(a,'P-value',header=TRUE)
a<-table.row.end(a)
for (i in 1:par1) {
a<-table.row.start(a)
a<-table.element(a,i,header=TRUE)
a<-table.element(a,round(mypacf[i],6))
mytstat <- mypacf[i]*sqrtn
a<-table.element(a,round(mytstat,4))
a<-table.element(a,round(1-pt(abs(mytstat),lengthx),6))
a<-table.row.end(a)
}
a<-table.end(a)
table.save(a,file='mytable1.tab')