Free Statistics

of Irreproducible Research!

Author's title

Author*The author of this computation has been verified*
R Software Modulerwasp_autocorrelation.wasp
Title produced by software(Partial) Autocorrelation Function
Date of computationWed, 14 Dec 2011 10:17:30 -0500
Cite this page as followsStatistical Computations at FreeStatistics.org, Office for Research Development and Education, URL https://freestatistics.org/blog/index.php?v=date/2011/Dec/14/t1323876010xhoq8jyzrtfeqny.htm/, Retrieved Wed, 01 May 2024 18:59:33 +0000
Statistical Computations at FreeStatistics.org, Office for Research Development and Education, URL https://freestatistics.org/blog/index.php?pk=155046, Retrieved Wed, 01 May 2024 18:59:33 +0000
QR Codes:

Original text written by user:
IsPrivate?No (this computation is public)
User-defined keywords
Estimated Impact81
Family? (F = Feedback message, R = changed R code, M = changed R Module, P = changed Parameters, D = changed Data)
-       [(Partial) Autocorrelation Function] [] [2011-12-14 15:17:30] [d34c5d8ebaf8c35edbecb57bc39ed04e] [Current]
Feedback Forum

Post a new message
Dataseries X:
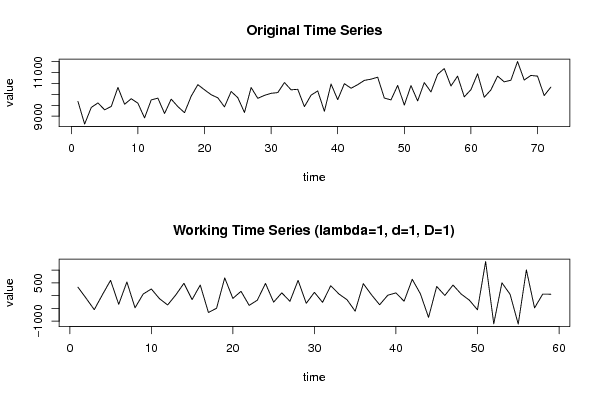
9676
8642
9402
9610
9294
9448
10319
9548
9801
9596
8923
9746
9829
9125
9782
9441
9162
9915
10444
10209
9985
9842
9429
10132
9849
9172
10313
9819
9955
10048
10082
10541
10208
10233
9439
9963
10158
9225
10474
9757
10490
10281
10444
10640
10695
10786
9832
9747
10411
9511
10402
9701
10540
10112
10915
11183
10384
10834
9886
10216
10943
9867
10203
10837
10573
10647
11502
10656
10866
10835
9945
10331


Summary of computational transaction
Raw Inputview raw input (R code)
Raw Outputview raw output of R engine
Computing time1 seconds
R Server'Gwilym Jenkins' @ jenkins.wessa.net

\begin{tabular}{lllllllll}
\hline
Summary of computational transaction \tabularnewline
Raw Input & view raw input (R code)  \tabularnewline
Raw Output & view raw output of R engine  \tabularnewline
Computing time & 1 seconds \tabularnewline
R Server & 'Gwilym Jenkins' @ jenkins.wessa.net \tabularnewline
\hline
\end{tabular}
%Source: https://freestatistics.org/blog/index.php?pk=155046&T=0

[TABLE]
[ROW][C]Summary of computational transaction[/C][/ROW]
[ROW][C]Raw Input[/C][C]view raw input (R code) [/C][/ROW]
[ROW][C]Raw Output[/C][C]view raw output of R engine [/C][/ROW]
[ROW][C]Computing time[/C][C]1 seconds[/C][/ROW]
[ROW][C]R Server[/C][C]'Gwilym Jenkins' @ jenkins.wessa.net[/C][/ROW]
[/TABLE]
Source: https://freestatistics.org/blog/index.php?pk=155046&T=0

Globally Unique Identifier (entire table): ba.freestatistics.org/blog/index.php?pk=155046&T=0

As an alternative you can also use a QR Code:  

The GUIDs for individual cells are displayed in the table below:

Summary of computational transaction
Raw Inputview raw input (R code)
Raw Outputview raw output of R engine
Computing time1 seconds
R Server'Gwilym Jenkins' @ jenkins.wessa.net


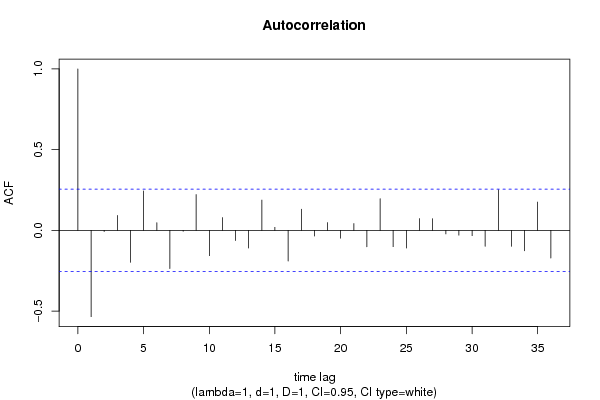
Autocorrelation Function
Time lag kACF(k)T-STATP-value
1-0.534494-4.10556.3e-05
2-0.007377-0.05670.477503
30.0922680.70870.240643
4-0.197589-1.51770.067214
50.2434711.87010.033214
60.0470440.36140.359564
7-0.236563-1.81710.037143
8-0.005211-0.040.484103
90.2215361.70170.047043
10-0.156572-1.20270.116957
110.0790650.60730.272987
12-0.062518-0.48020.316428
13-0.109823-0.84360.201159
140.1874941.44020.077553
150.0188160.14450.442788
16-0.189396-1.45480.075515
170.1305461.00270.160041
18-0.035352-0.27150.393461
190.0480750.36930.356624
20-0.048115-0.36960.356509
210.0420830.32320.373825
22-0.101565-0.78010.219215
230.1955941.50240.069166
24-0.100652-0.77310.221269
25-0.109819-0.84350.201168
260.0726730.55820.289405
270.0721480.55420.290776
28-0.021891-0.16810.433521
29-0.02951-0.22670.410731
30-0.032505-0.24970.401852
31-0.098815-0.7590.225433
320.2511651.92920.029258
33-0.098071-0.75330.227134
34-0.126204-0.96940.168154
350.1751.34420.092015
36-0.171389-1.31650.096554

\begin{tabular}{lllllllll}
\hline
Autocorrelation Function \tabularnewline
Time lag k & ACF(k) & T-STAT & P-value \tabularnewline
1 & -0.534494 & -4.1055 & 6.3e-05 \tabularnewline
2 & -0.007377 & -0.0567 & 0.477503 \tabularnewline
3 & 0.092268 & 0.7087 & 0.240643 \tabularnewline
4 & -0.197589 & -1.5177 & 0.067214 \tabularnewline
5 & 0.243471 & 1.8701 & 0.033214 \tabularnewline
6 & 0.047044 & 0.3614 & 0.359564 \tabularnewline
7 & -0.236563 & -1.8171 & 0.037143 \tabularnewline
8 & -0.005211 & -0.04 & 0.484103 \tabularnewline
9 & 0.221536 & 1.7017 & 0.047043 \tabularnewline
10 & -0.156572 & -1.2027 & 0.116957 \tabularnewline
11 & 0.079065 & 0.6073 & 0.272987 \tabularnewline
12 & -0.062518 & -0.4802 & 0.316428 \tabularnewline
13 & -0.109823 & -0.8436 & 0.201159 \tabularnewline
14 & 0.187494 & 1.4402 & 0.077553 \tabularnewline
15 & 0.018816 & 0.1445 & 0.442788 \tabularnewline
16 & -0.189396 & -1.4548 & 0.075515 \tabularnewline
17 & 0.130546 & 1.0027 & 0.160041 \tabularnewline
18 & -0.035352 & -0.2715 & 0.393461 \tabularnewline
19 & 0.048075 & 0.3693 & 0.356624 \tabularnewline
20 & -0.048115 & -0.3696 & 0.356509 \tabularnewline
21 & 0.042083 & 0.3232 & 0.373825 \tabularnewline
22 & -0.101565 & -0.7801 & 0.219215 \tabularnewline
23 & 0.195594 & 1.5024 & 0.069166 \tabularnewline
24 & -0.100652 & -0.7731 & 0.221269 \tabularnewline
25 & -0.109819 & -0.8435 & 0.201168 \tabularnewline
26 & 0.072673 & 0.5582 & 0.289405 \tabularnewline
27 & 0.072148 & 0.5542 & 0.290776 \tabularnewline
28 & -0.021891 & -0.1681 & 0.433521 \tabularnewline
29 & -0.02951 & -0.2267 & 0.410731 \tabularnewline
30 & -0.032505 & -0.2497 & 0.401852 \tabularnewline
31 & -0.098815 & -0.759 & 0.225433 \tabularnewline
32 & 0.251165 & 1.9292 & 0.029258 \tabularnewline
33 & -0.098071 & -0.7533 & 0.227134 \tabularnewline
34 & -0.126204 & -0.9694 & 0.168154 \tabularnewline
35 & 0.175 & 1.3442 & 0.092015 \tabularnewline
36 & -0.171389 & -1.3165 & 0.096554 \tabularnewline
\hline
\end{tabular}
%Source: https://freestatistics.org/blog/index.php?pk=155046&T=1

[TABLE]
[ROW][C]Autocorrelation Function[/C][/ROW]
[ROW][C]Time lag k[/C][C]ACF(k)[/C][C]T-STAT[/C][C]P-value[/C][/ROW]
[ROW][C]1[/C][C]-0.534494[/C][C]-4.1055[/C][C]6.3e-05[/C][/ROW]
[ROW][C]2[/C][C]-0.007377[/C][C]-0.0567[/C][C]0.477503[/C][/ROW]
[ROW][C]3[/C][C]0.092268[/C][C]0.7087[/C][C]0.240643[/C][/ROW]
[ROW][C]4[/C][C]-0.197589[/C][C]-1.5177[/C][C]0.067214[/C][/ROW]
[ROW][C]5[/C][C]0.243471[/C][C]1.8701[/C][C]0.033214[/C][/ROW]
[ROW][C]6[/C][C]0.047044[/C][C]0.3614[/C][C]0.359564[/C][/ROW]
[ROW][C]7[/C][C]-0.236563[/C][C]-1.8171[/C][C]0.037143[/C][/ROW]
[ROW][C]8[/C][C]-0.005211[/C][C]-0.04[/C][C]0.484103[/C][/ROW]
[ROW][C]9[/C][C]0.221536[/C][C]1.7017[/C][C]0.047043[/C][/ROW]
[ROW][C]10[/C][C]-0.156572[/C][C]-1.2027[/C][C]0.116957[/C][/ROW]
[ROW][C]11[/C][C]0.079065[/C][C]0.6073[/C][C]0.272987[/C][/ROW]
[ROW][C]12[/C][C]-0.062518[/C][C]-0.4802[/C][C]0.316428[/C][/ROW]
[ROW][C]13[/C][C]-0.109823[/C][C]-0.8436[/C][C]0.201159[/C][/ROW]
[ROW][C]14[/C][C]0.187494[/C][C]1.4402[/C][C]0.077553[/C][/ROW]
[ROW][C]15[/C][C]0.018816[/C][C]0.1445[/C][C]0.442788[/C][/ROW]
[ROW][C]16[/C][C]-0.189396[/C][C]-1.4548[/C][C]0.075515[/C][/ROW]
[ROW][C]17[/C][C]0.130546[/C][C]1.0027[/C][C]0.160041[/C][/ROW]
[ROW][C]18[/C][C]-0.035352[/C][C]-0.2715[/C][C]0.393461[/C][/ROW]
[ROW][C]19[/C][C]0.048075[/C][C]0.3693[/C][C]0.356624[/C][/ROW]
[ROW][C]20[/C][C]-0.048115[/C][C]-0.3696[/C][C]0.356509[/C][/ROW]
[ROW][C]21[/C][C]0.042083[/C][C]0.3232[/C][C]0.373825[/C][/ROW]
[ROW][C]22[/C][C]-0.101565[/C][C]-0.7801[/C][C]0.219215[/C][/ROW]
[ROW][C]23[/C][C]0.195594[/C][C]1.5024[/C][C]0.069166[/C][/ROW]
[ROW][C]24[/C][C]-0.100652[/C][C]-0.7731[/C][C]0.221269[/C][/ROW]
[ROW][C]25[/C][C]-0.109819[/C][C]-0.8435[/C][C]0.201168[/C][/ROW]
[ROW][C]26[/C][C]0.072673[/C][C]0.5582[/C][C]0.289405[/C][/ROW]
[ROW][C]27[/C][C]0.072148[/C][C]0.5542[/C][C]0.290776[/C][/ROW]
[ROW][C]28[/C][C]-0.021891[/C][C]-0.1681[/C][C]0.433521[/C][/ROW]
[ROW][C]29[/C][C]-0.02951[/C][C]-0.2267[/C][C]0.410731[/C][/ROW]
[ROW][C]30[/C][C]-0.032505[/C][C]-0.2497[/C][C]0.401852[/C][/ROW]
[ROW][C]31[/C][C]-0.098815[/C][C]-0.759[/C][C]0.225433[/C][/ROW]
[ROW][C]32[/C][C]0.251165[/C][C]1.9292[/C][C]0.029258[/C][/ROW]
[ROW][C]33[/C][C]-0.098071[/C][C]-0.7533[/C][C]0.227134[/C][/ROW]
[ROW][C]34[/C][C]-0.126204[/C][C]-0.9694[/C][C]0.168154[/C][/ROW]
[ROW][C]35[/C][C]0.175[/C][C]1.3442[/C][C]0.092015[/C][/ROW]
[ROW][C]36[/C][C]-0.171389[/C][C]-1.3165[/C][C]0.096554[/C][/ROW]
[/TABLE]
Source: https://freestatistics.org/blog/index.php?pk=155046&T=1

Globally Unique Identifier (entire table): ba.freestatistics.org/blog/index.php?pk=155046&T=1

As an alternative you can also use a QR Code:  

The GUIDs for individual cells are displayed in the table below:

Autocorrelation Function
Time lag kACF(k)T-STATP-value
1-0.534494-4.10556.3e-05
2-0.007377-0.05670.477503
30.0922680.70870.240643
4-0.197589-1.51770.067214
50.2434711.87010.033214
60.0470440.36140.359564
7-0.236563-1.81710.037143
8-0.005211-0.040.484103
90.2215361.70170.047043
10-0.156572-1.20270.116957
110.0790650.60730.272987
12-0.062518-0.48020.316428
13-0.109823-0.84360.201159
140.1874941.44020.077553
150.0188160.14450.442788
16-0.189396-1.45480.075515
170.1305461.00270.160041
18-0.035352-0.27150.393461
190.0480750.36930.356624
20-0.048115-0.36960.356509
210.0420830.32320.373825
22-0.101565-0.78010.219215
230.1955941.50240.069166
24-0.100652-0.77310.221269
25-0.109819-0.84350.201168
260.0726730.55820.289405
270.0721480.55420.290776
28-0.021891-0.16810.433521
29-0.02951-0.22670.410731
30-0.032505-0.24970.401852
31-0.098815-0.7590.225433
320.2511651.92920.029258
33-0.098071-0.75330.227134
34-0.126204-0.96940.168154
350.1751.34420.092015
36-0.171389-1.31650.096554


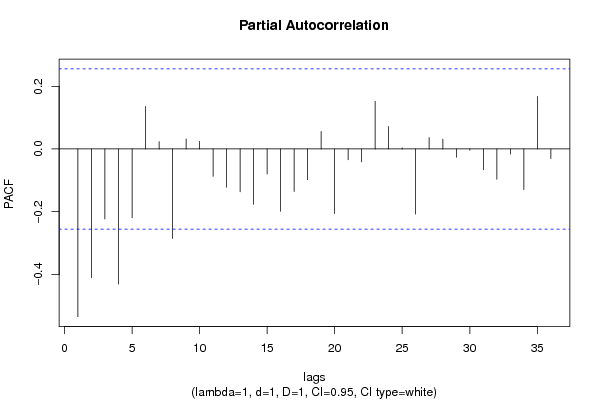
Partial Autocorrelation Function
Time lag kPACF(k)T-STATP-value
1-0.534494-4.10556.3e-05
2-0.410267-3.15130.001277
3-0.223162-1.71410.045876
4-0.430715-3.30840.000801
5-0.219089-1.68290.048844
60.1356981.04230.150758
70.0233860.17960.429028
8-0.285014-2.18920.016274
90.0319660.24550.403446
100.0242050.18590.426572
11-0.087237-0.67010.25271
12-0.12224-0.93890.175794
13-0.136371-1.04750.149574
14-0.175972-1.35170.090821
15-0.079429-0.61010.272066
16-0.198776-1.52680.066074
17-0.13507-1.03750.15187
18-0.097676-0.75030.228039
190.0559020.42940.334601
20-0.205858-1.58120.059587
21-0.034428-0.26440.39618
22-0.04102-0.31510.376905
230.1521681.16880.123587
240.0715460.54960.292349
250.0036310.02790.488922
26-0.207254-1.59190.058371
270.0362090.27810.390944
280.0313690.2410.405214
29-0.026176-0.20110.42067
30-0.004206-0.03230.487168
31-0.066088-0.50760.306802
32-0.096737-0.74310.230199
33-0.016117-0.12380.450948
34-0.129105-0.99170.162703
350.1673551.28550.101825
36-0.03026-0.23240.408504

\begin{tabular}{lllllllll}
\hline
Partial Autocorrelation Function \tabularnewline
Time lag k & PACF(k) & T-STAT & P-value \tabularnewline
1 & -0.534494 & -4.1055 & 6.3e-05 \tabularnewline
2 & -0.410267 & -3.1513 & 0.001277 \tabularnewline
3 & -0.223162 & -1.7141 & 0.045876 \tabularnewline
4 & -0.430715 & -3.3084 & 0.000801 \tabularnewline
5 & -0.219089 & -1.6829 & 0.048844 \tabularnewline
6 & 0.135698 & 1.0423 & 0.150758 \tabularnewline
7 & 0.023386 & 0.1796 & 0.429028 \tabularnewline
8 & -0.285014 & -2.1892 & 0.016274 \tabularnewline
9 & 0.031966 & 0.2455 & 0.403446 \tabularnewline
10 & 0.024205 & 0.1859 & 0.426572 \tabularnewline
11 & -0.087237 & -0.6701 & 0.25271 \tabularnewline
12 & -0.12224 & -0.9389 & 0.175794 \tabularnewline
13 & -0.136371 & -1.0475 & 0.149574 \tabularnewline
14 & -0.175972 & -1.3517 & 0.090821 \tabularnewline
15 & -0.079429 & -0.6101 & 0.272066 \tabularnewline
16 & -0.198776 & -1.5268 & 0.066074 \tabularnewline
17 & -0.13507 & -1.0375 & 0.15187 \tabularnewline
18 & -0.097676 & -0.7503 & 0.228039 \tabularnewline
19 & 0.055902 & 0.4294 & 0.334601 \tabularnewline
20 & -0.205858 & -1.5812 & 0.059587 \tabularnewline
21 & -0.034428 & -0.2644 & 0.39618 \tabularnewline
22 & -0.04102 & -0.3151 & 0.376905 \tabularnewline
23 & 0.152168 & 1.1688 & 0.123587 \tabularnewline
24 & 0.071546 & 0.5496 & 0.292349 \tabularnewline
25 & 0.003631 & 0.0279 & 0.488922 \tabularnewline
26 & -0.207254 & -1.5919 & 0.058371 \tabularnewline
27 & 0.036209 & 0.2781 & 0.390944 \tabularnewline
28 & 0.031369 & 0.241 & 0.405214 \tabularnewline
29 & -0.026176 & -0.2011 & 0.42067 \tabularnewline
30 & -0.004206 & -0.0323 & 0.487168 \tabularnewline
31 & -0.066088 & -0.5076 & 0.306802 \tabularnewline
32 & -0.096737 & -0.7431 & 0.230199 \tabularnewline
33 & -0.016117 & -0.1238 & 0.450948 \tabularnewline
34 & -0.129105 & -0.9917 & 0.162703 \tabularnewline
35 & 0.167355 & 1.2855 & 0.101825 \tabularnewline
36 & -0.03026 & -0.2324 & 0.408504 \tabularnewline
\hline
\end{tabular}
%Source: https://freestatistics.org/blog/index.php?pk=155046&T=2

[TABLE]
[ROW][C]Partial Autocorrelation Function[/C][/ROW]
[ROW][C]Time lag k[/C][C]PACF(k)[/C][C]T-STAT[/C][C]P-value[/C][/ROW]
[ROW][C]1[/C][C]-0.534494[/C][C]-4.1055[/C][C]6.3e-05[/C][/ROW]
[ROW][C]2[/C][C]-0.410267[/C][C]-3.1513[/C][C]0.001277[/C][/ROW]
[ROW][C]3[/C][C]-0.223162[/C][C]-1.7141[/C][C]0.045876[/C][/ROW]
[ROW][C]4[/C][C]-0.430715[/C][C]-3.3084[/C][C]0.000801[/C][/ROW]
[ROW][C]5[/C][C]-0.219089[/C][C]-1.6829[/C][C]0.048844[/C][/ROW]
[ROW][C]6[/C][C]0.135698[/C][C]1.0423[/C][C]0.150758[/C][/ROW]
[ROW][C]7[/C][C]0.023386[/C][C]0.1796[/C][C]0.429028[/C][/ROW]
[ROW][C]8[/C][C]-0.285014[/C][C]-2.1892[/C][C]0.016274[/C][/ROW]
[ROW][C]9[/C][C]0.031966[/C][C]0.2455[/C][C]0.403446[/C][/ROW]
[ROW][C]10[/C][C]0.024205[/C][C]0.1859[/C][C]0.426572[/C][/ROW]
[ROW][C]11[/C][C]-0.087237[/C][C]-0.6701[/C][C]0.25271[/C][/ROW]
[ROW][C]12[/C][C]-0.12224[/C][C]-0.9389[/C][C]0.175794[/C][/ROW]
[ROW][C]13[/C][C]-0.136371[/C][C]-1.0475[/C][C]0.149574[/C][/ROW]
[ROW][C]14[/C][C]-0.175972[/C][C]-1.3517[/C][C]0.090821[/C][/ROW]
[ROW][C]15[/C][C]-0.079429[/C][C]-0.6101[/C][C]0.272066[/C][/ROW]
[ROW][C]16[/C][C]-0.198776[/C][C]-1.5268[/C][C]0.066074[/C][/ROW]
[ROW][C]17[/C][C]-0.13507[/C][C]-1.0375[/C][C]0.15187[/C][/ROW]
[ROW][C]18[/C][C]-0.097676[/C][C]-0.7503[/C][C]0.228039[/C][/ROW]
[ROW][C]19[/C][C]0.055902[/C][C]0.4294[/C][C]0.334601[/C][/ROW]
[ROW][C]20[/C][C]-0.205858[/C][C]-1.5812[/C][C]0.059587[/C][/ROW]
[ROW][C]21[/C][C]-0.034428[/C][C]-0.2644[/C][C]0.39618[/C][/ROW]
[ROW][C]22[/C][C]-0.04102[/C][C]-0.3151[/C][C]0.376905[/C][/ROW]
[ROW][C]23[/C][C]0.152168[/C][C]1.1688[/C][C]0.123587[/C][/ROW]
[ROW][C]24[/C][C]0.071546[/C][C]0.5496[/C][C]0.292349[/C][/ROW]
[ROW][C]25[/C][C]0.003631[/C][C]0.0279[/C][C]0.488922[/C][/ROW]
[ROW][C]26[/C][C]-0.207254[/C][C]-1.5919[/C][C]0.058371[/C][/ROW]
[ROW][C]27[/C][C]0.036209[/C][C]0.2781[/C][C]0.390944[/C][/ROW]
[ROW][C]28[/C][C]0.031369[/C][C]0.241[/C][C]0.405214[/C][/ROW]
[ROW][C]29[/C][C]-0.026176[/C][C]-0.2011[/C][C]0.42067[/C][/ROW]
[ROW][C]30[/C][C]-0.004206[/C][C]-0.0323[/C][C]0.487168[/C][/ROW]
[ROW][C]31[/C][C]-0.066088[/C][C]-0.5076[/C][C]0.306802[/C][/ROW]
[ROW][C]32[/C][C]-0.096737[/C][C]-0.7431[/C][C]0.230199[/C][/ROW]
[ROW][C]33[/C][C]-0.016117[/C][C]-0.1238[/C][C]0.450948[/C][/ROW]
[ROW][C]34[/C][C]-0.129105[/C][C]-0.9917[/C][C]0.162703[/C][/ROW]
[ROW][C]35[/C][C]0.167355[/C][C]1.2855[/C][C]0.101825[/C][/ROW]
[ROW][C]36[/C][C]-0.03026[/C][C]-0.2324[/C][C]0.408504[/C][/ROW]
[/TABLE]
Source: https://freestatistics.org/blog/index.php?pk=155046&T=2

Globally Unique Identifier (entire table): ba.freestatistics.org/blog/index.php?pk=155046&T=2

As an alternative you can also use a QR Code:  

The GUIDs for individual cells are displayed in the table below:

Partial Autocorrelation Function
Time lag kPACF(k)T-STATP-value
1-0.534494-4.10556.3e-05
2-0.410267-3.15130.001277
3-0.223162-1.71410.045876
4-0.430715-3.30840.000801
5-0.219089-1.68290.048844
60.1356981.04230.150758
70.0233860.17960.429028
8-0.285014-2.18920.016274
90.0319660.24550.403446
100.0242050.18590.426572
11-0.087237-0.67010.25271
12-0.12224-0.93890.175794
13-0.136371-1.04750.149574
14-0.175972-1.35170.090821
15-0.079429-0.61010.272066
16-0.198776-1.52680.066074
17-0.13507-1.03750.15187
18-0.097676-0.75030.228039
190.0559020.42940.334601
20-0.205858-1.58120.059587
21-0.034428-0.26440.39618
22-0.04102-0.31510.376905
230.1521681.16880.123587
240.0715460.54960.292349
250.0036310.02790.488922
26-0.207254-1.59190.058371
270.0362090.27810.390944
280.0313690.2410.405214
29-0.026176-0.20110.42067
30-0.004206-0.03230.487168
31-0.066088-0.50760.306802
32-0.096737-0.74310.230199
33-0.016117-0.12380.450948
34-0.129105-0.99170.162703
350.1673551.28550.101825
36-0.03026-0.23240.408504


Parameters (Session):
par1 = 36 ; par2 = 1 ; par3 = 1 ; par4 = 1 ; par5 = 12 ; par6 = White Noise ; par7 = 0.95 ;
Parameters (R input):
par1 = 36 ; par2 = 1 ; par3 = 1 ; par4 = 1 ; par5 = 12 ; par6 = White Noise ; par7 = 0.95 ; par8 = ;
R code (references can be found in the software module):
if (par1 == 'Default') {
par1 = 10*log10(length(x))
} else {
par1 <- as.numeric(par1)
}
par2 <- as.numeric(par2)
par3 <- as.numeric(par3)
par4 <- as.numeric(par4)
par5 <- as.numeric(par5)
if (par6 == 'White Noise') par6 <- 'white' else par6 <- 'ma'
par7 <- as.numeric(par7)
if (par8 != '') par8 <- as.numeric(par8)
ox <- x
if (par8 == '') {
if (par2 == 0) {
x <- log(x)
} else {
x <- (x ^ par2 - 1) / par2
}
} else {
x <- log(x,base=par8)
}
if (par3 > 0) x <- diff(x,lag=1,difference=par3)
if (par4 > 0) x <- diff(x,lag=par5,difference=par4)
bitmap(file='picts.png')
op <- par(mfrow=c(2,1))
plot(ox,type='l',main='Original Time Series',xlab='time',ylab='value')
if (par8=='') {
mytitle <- paste('Working Time Series (lambda=',par2,', d=',par3,', D=',par4,')',sep='')
mysub <- paste('(lambda=',par2,', d=',par3,', D=',par4,', CI=', par7, ', CI type=',par6,')',sep='')
} else {
mytitle <- paste('Working Time Series (base=',par8,', d=',par3,', D=',par4,')',sep='')
mysub <- paste('(base=',par8,', d=',par3,', D=',par4,', CI=', par7, ', CI type=',par6,')',sep='')
}
plot(x,type='l', main=mytitle,xlab='time',ylab='value')
par(op)
dev.off()
bitmap(file='pic1.png')
racf <- acf(x, par1, main='Autocorrelation', xlab='time lag', ylab='ACF', ci.type=par6, ci=par7, sub=mysub)
dev.off()
bitmap(file='pic2.png')
rpacf <- pacf(x,par1,main='Partial Autocorrelation',xlab='lags',ylab='PACF',sub=mysub)
dev.off()
(myacf <- c(racf$acf))
(mypacf <- c(rpacf$acf))
lengthx <- length(x)
sqrtn <- sqrt(lengthx)
load(file='createtable')
a<-table.start()
a<-table.row.start(a)
a<-table.element(a,'Autocorrelation Function',4,TRUE)
a<-table.row.end(a)
a<-table.row.start(a)
a<-table.element(a,'Time lag k',header=TRUE)
a<-table.element(a,hyperlink('basics.htm','ACF(k)','click here for more information about the Autocorrelation Function'),header=TRUE)
a<-table.element(a,'T-STAT',header=TRUE)
a<-table.element(a,'P-value',header=TRUE)
a<-table.row.end(a)
for (i in 2:(par1+1)) {
a<-table.row.start(a)
a<-table.element(a,i-1,header=TRUE)
a<-table.element(a,round(myacf[i],6))
mytstat <- myacf[i]*sqrtn
a<-table.element(a,round(mytstat,4))
a<-table.element(a,round(1-pt(abs(mytstat),lengthx),6))
a<-table.row.end(a)
}
a<-table.end(a)
table.save(a,file='mytable.tab')
a<-table.start()
a<-table.row.start(a)
a<-table.element(a,'Partial Autocorrelation Function',4,TRUE)
a<-table.row.end(a)
a<-table.row.start(a)
a<-table.element(a,'Time lag k',header=TRUE)
a<-table.element(a,hyperlink('basics.htm','PACF(k)','click here for more information about the Partial Autocorrelation Function'),header=TRUE)
a<-table.element(a,'T-STAT',header=TRUE)
a<-table.element(a,'P-value',header=TRUE)
a<-table.row.end(a)
for (i in 1:par1) {
a<-table.row.start(a)
a<-table.element(a,i,header=TRUE)
a<-table.element(a,round(mypacf[i],6))
mytstat <- mypacf[i]*sqrtn
a<-table.element(a,round(mytstat,4))
a<-table.element(a,round(1-pt(abs(mytstat),lengthx),6))
a<-table.row.end(a)
}
a<-table.end(a)
table.save(a,file='mytable1.tab')