Free Statistics

of Irreproducible Research!

Author's title

Author*The author of this computation has been verified*
R Software Modulerwasp_pairs.wasp
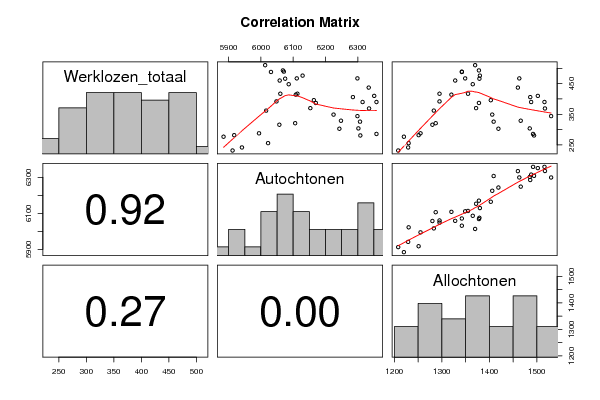
Title produced by softwareKendall tau Correlation Matrix
Date of computationWed, 14 Dec 2011 08:49:05 -0500
Cite this page as followsStatistical Computations at FreeStatistics.org, Office for Research Development and Education, URL https://freestatistics.org/blog/index.php?v=date/2011/Dec/14/t1323870579qiba689iqwwi6t6.htm/, Retrieved Wed, 01 May 2024 20:08:00 +0000
Statistical Computations at FreeStatistics.org, Office for Research Development and Education, URL https://freestatistics.org/blog/index.php?pk=154961, Retrieved Wed, 01 May 2024 20:08:00 +0000
QR Codes:

Original text written by user:
IsPrivate?No (this computation is public)
User-defined keywords
Estimated Impact74
Family? (F = Feedback message, R = changed R code, M = changed R Module, P = changed Parameters, D = changed Data)
-       [Kendall tau Correlation Matrix] [Kendall tau Corre...] [2011-12-14 13:49:05] [51aabe75794be7f34bed5d3096a085df] [Current]
Feedback Forum

Post a new message
Dataseries X:
277	5884	1220
232	5912	1208
256	6022	1230
242	5941	1229
282	5917	1251
288	5994	1255
321	6106	1287
316	6057	1280
362	6016	1283
392	6048	1295
414	6108	1320
417	6060	1295
488	6031	1342
489	6071	1342
467	6111	1349
460	6058	1328
510	6013	1370
493	6068	1378
476	6129	1380
448	6086	1365
466	6075	1379
417	6113	1355
387	6170	1378
370	6153	1372
396	6164	1403
349	6225	1406
326	6307	1409
303	6243	1419
329	6248	1466
304	6302	1485
286	6358	1492
281	6308	1494
344	6299	1530
369	6335	1517
390	6358	1516
406	6285	1486
467	6299	1463
437	6334	1460
410	6351	1502
390	6315	1488


Summary of computational transaction
Raw Inputview raw input (R code)
Raw Outputview raw output of R engine
Computing time1 seconds
R Server'Gertrude Mary Cox' @ cox.wessa.net

\begin{tabular}{lllllllll}
\hline
Summary of computational transaction \tabularnewline
Raw Input & view raw input (R code)  \tabularnewline
Raw Output & view raw output of R engine  \tabularnewline
Computing time & 1 seconds \tabularnewline
R Server & 'Gertrude Mary Cox' @ cox.wessa.net \tabularnewline
\hline
\end{tabular}
%Source: https://freestatistics.org/blog/index.php?pk=154961&T=0

[TABLE]
[ROW][C]Summary of computational transaction[/C][/ROW]
[ROW][C]Raw Input[/C][C]view raw input (R code) [/C][/ROW]
[ROW][C]Raw Output[/C][C]view raw output of R engine [/C][/ROW]
[ROW][C]Computing time[/C][C]1 seconds[/C][/ROW]
[ROW][C]R Server[/C][C]'Gertrude Mary Cox' @ cox.wessa.net[/C][/ROW]
[/TABLE]
Source: https://freestatistics.org/blog/index.php?pk=154961&T=0

Globally Unique Identifier (entire table): ba.freestatistics.org/blog/index.php?pk=154961&T=0

As an alternative you can also use a QR Code:  

The GUIDs for individual cells are displayed in the table below:

Summary of computational transaction
Raw Inputview raw input (R code)
Raw Outputview raw output of R engine
Computing time1 seconds
R Server'Gertrude Mary Cox' @ cox.wessa.net


Correlations for all pairs of data series (method=kendall)
Werklozen_totaalAutochtonenAllochtonen
Werklozen_totaal10.0120.121
Autochtonen0.01210.783
Allochtonen0.1210.7831

\begin{tabular}{lllllllll}
\hline
Correlations for all pairs of data series (method=kendall) \tabularnewline
  & Werklozen_totaal & Autochtonen & Allochtonen \tabularnewline
Werklozen_totaal & 1 & 0.012 & 0.121 \tabularnewline
Autochtonen & 0.012 & 1 & 0.783 \tabularnewline
Allochtonen & 0.121 & 0.783 & 1 \tabularnewline
\hline
\end{tabular}
%Source: https://freestatistics.org/blog/index.php?pk=154961&T=1

[TABLE]
[ROW][C]Correlations for all pairs of data series (method=kendall)[/C][/ROW]
[ROW][C] [/C][C]Werklozen_totaal[/C][C]Autochtonen[/C][C]Allochtonen[/C][/ROW]
[ROW][C]Werklozen_totaal[/C][C]1[/C][C]0.012[/C][C]0.121[/C][/ROW]
[ROW][C]Autochtonen[/C][C]0.012[/C][C]1[/C][C]0.783[/C][/ROW]
[ROW][C]Allochtonen[/C][C]0.121[/C][C]0.783[/C][C]1[/C][/ROW]
[/TABLE]
Source: https://freestatistics.org/blog/index.php?pk=154961&T=1

Globally Unique Identifier (entire table): ba.freestatistics.org/blog/index.php?pk=154961&T=1

As an alternative you can also use a QR Code:  

The GUIDs for individual cells are displayed in the table below:

Correlations for all pairs of data series (method=kendall)
Werklozen_totaalAutochtonenAllochtonen
Werklozen_totaal10.0120.121
Autochtonen0.01210.783
Allochtonen0.1210.7831


Correlations for all pairs of data series with p-values
pairPearson rSpearman rhoKendall tau
Werklozen_totaal;Autochtonen0.08360.07390.0116
p-value(0.6079)(0.6502)(0.9165)
Werklozen_totaal;Allochtonen0.23960.17830.121
p-value(0.1365)(0.2709)(0.2732)
Autochtonen;Allochtonen0.93880.92710.7833
p-value(0)(0)(0)

\begin{tabular}{lllllllll}
\hline
Correlations for all pairs of data series with p-values \tabularnewline
pair & Pearson r & Spearman rho & Kendall tau \tabularnewline
Werklozen_totaal;Autochtonen & 0.0836 & 0.0739 & 0.0116 \tabularnewline
p-value & (0.6079) & (0.6502) & (0.9165) \tabularnewline
Werklozen_totaal;Allochtonen & 0.2396 & 0.1783 & 0.121 \tabularnewline
p-value & (0.1365) & (0.2709) & (0.2732) \tabularnewline
Autochtonen;Allochtonen & 0.9388 & 0.9271 & 0.7833 \tabularnewline
p-value & (0) & (0) & (0) \tabularnewline
\hline
\end{tabular}
%Source: https://freestatistics.org/blog/index.php?pk=154961&T=2

[TABLE]
[ROW][C]Correlations for all pairs of data series with p-values[/C][/ROW]
[ROW][C]pair[/C][C]Pearson r[/C][C]Spearman rho[/C][C]Kendall tau[/C][/ROW]
[ROW][C]Werklozen_totaal;Autochtonen[/C][C]0.0836[/C][C]0.0739[/C][C]0.0116[/C][/ROW]
[ROW][C]p-value[/C][C](0.6079)[/C][C](0.6502)[/C][C](0.9165)[/C][/ROW]
[ROW][C]Werklozen_totaal;Allochtonen[/C][C]0.2396[/C][C]0.1783[/C][C]0.121[/C][/ROW]
[ROW][C]p-value[/C][C](0.1365)[/C][C](0.2709)[/C][C](0.2732)[/C][/ROW]
[ROW][C]Autochtonen;Allochtonen[/C][C]0.9388[/C][C]0.9271[/C][C]0.7833[/C][/ROW]
[ROW][C]p-value[/C][C](0)[/C][C](0)[/C][C](0)[/C][/ROW]
[/TABLE]
Source: https://freestatistics.org/blog/index.php?pk=154961&T=2

Globally Unique Identifier (entire table): ba.freestatistics.org/blog/index.php?pk=154961&T=2

As an alternative you can also use a QR Code:  

The GUIDs for individual cells are displayed in the table below:

Correlations for all pairs of data series with p-values
pairPearson rSpearman rhoKendall tau
Werklozen_totaal;Autochtonen0.08360.07390.0116
p-value(0.6079)(0.6502)(0.9165)
Werklozen_totaal;Allochtonen0.23960.17830.121
p-value(0.1365)(0.2709)(0.2732)
Autochtonen;Allochtonen0.93880.92710.7833
p-value(0)(0)(0)


Parameters (Session):
par1 = kendall ;
Parameters (R input):
par1 = kendall ;
R code (references can be found in the software module):
panel.tau <- function(x, y, digits=2, prefix='', cex.cor)
{
usr <- par('usr'); on.exit(par(usr))
par(usr = c(0, 1, 0, 1))
rr <- cor.test(x, y, method=par1)
r <- round(rr$p.value,2)
txt <- format(c(r, 0.123456789), digits=digits)[1]
txt <- paste(prefix, txt, sep='')
if(missing(cex.cor)) cex <- 0.5/strwidth(txt)
text(0.5, 0.5, txt, cex = cex)
}
panel.hist <- function(x, ...)
{
usr <- par('usr'); on.exit(par(usr))
par(usr = c(usr[1:2], 0, 1.5) )
h <- hist(x, plot = FALSE)
breaks <- h$breaks; nB <- length(breaks)
y <- h$counts; y <- y/max(y)
rect(breaks[-nB], 0, breaks[-1], y, col='grey', ...)
}
bitmap(file='test1.png')
pairs(t(y),diag.panel=panel.hist, upper.panel=panel.smooth, lower.panel=panel.tau, main=main)
dev.off()
load(file='createtable')
n <- length(y[,1])
n
a<-table.start()
a<-table.row.start(a)
a<-table.element(a,paste('Correlations for all pairs of data series (method=',par1,')',sep=''),n+1,TRUE)
a<-table.row.end(a)
a<-table.row.start(a)
a<-table.element(a,' ',header=TRUE)
for (i in 1:n) {
a<-table.element(a,dimnames(t(x))[[2]][i],header=TRUE)
}
a<-table.row.end(a)
for (i in 1:n) {
a<-table.row.start(a)
a<-table.element(a,dimnames(t(x))[[2]][i],header=TRUE)
for (j in 1:n) {
r <- cor.test(y[i,],y[j,],method=par1)
a<-table.element(a,round(r$estimate,3))
}
a<-table.row.end(a)
}
a<-table.end(a)
table.save(a,file='mytable.tab')
a<-table.start()
a<-table.row.start(a)
a<-table.element(a,'Correlations for all pairs of data series with p-values',4,TRUE)
a<-table.row.end(a)
a<-table.row.start(a)
a<-table.element(a,'pair',1,TRUE)
a<-table.element(a,'Pearson r',1,TRUE)
a<-table.element(a,'Spearman rho',1,TRUE)
a<-table.element(a,'Kendall tau',1,TRUE)
a<-table.row.end(a)
cor.test(y[1,],y[2,],method=par1)
for (i in 1:(n-1))
{
for (j in (i+1):n)
{
a<-table.row.start(a)
dum <- paste(dimnames(t(x))[[2]][i],';',dimnames(t(x))[[2]][j],sep='')
a<-table.element(a,dum,header=TRUE)
rp <- cor.test(y[i,],y[j,],method='pearson')
a<-table.element(a,round(rp$estimate,4))
rs <- cor.test(y[i,],y[j,],method='spearman')
a<-table.element(a,round(rs$estimate,4))
rk <- cor.test(y[i,],y[j,],method='kendall')
a<-table.element(a,round(rk$estimate,4))
a<-table.row.end(a)
a<-table.row.start(a)
a<-table.element(a,'p-value',header=T)
a<-table.element(a,paste('(',round(rp$p.value,4),')',sep=''))
a<-table.element(a,paste('(',round(rs$p.value,4),')',sep=''))
a<-table.element(a,paste('(',round(rk$p.value,4),')',sep=''))
a<-table.row.end(a)
}
}
a<-table.end(a)
table.save(a,file='mytable1.tab')