Free Statistics

of Irreproducible Research!

Author's title

Author*The author of this computation has been verified*
R Software Modulerwasp_regression_trees1.wasp
Title produced by softwareRecursive Partitioning (Regression Trees)
Date of computationWed, 14 Dec 2011 08:22:09 -0500
Cite this page as followsStatistical Computations at FreeStatistics.org, Office for Research Development and Education, URL https://freestatistics.org/blog/index.php?v=date/2011/Dec/14/t1323868953w4rh37teud8l7t1.htm/, Retrieved Wed, 01 May 2024 20:35:34 +0000
Statistical Computations at FreeStatistics.org, Office for Research Development and Education, URL https://freestatistics.org/blog/index.php?pk=154935, Retrieved Wed, 01 May 2024 20:35:34 +0000
QR Codes:

Original text written by user:
IsPrivate?No (this computation is public)
User-defined keywords
Estimated Impact77
Family? (F = Feedback message, R = changed R code, M = changed R Module, P = changed Parameters, D = changed Data)
-       [Recursive Partitioning (Regression Trees)] [Recursive partiti...] [2011-12-14 13:22:09] [e5e604418bec6ffe5109fb01f8a59ccb] [Current]
Feedback Forum

Post a new message
Dataseries X:
186448	17822	1942	16739	4872	1020
190530	22422	2547	17851	4905	1200
194207	18817	2033	17034	4971	1279
190855	22043	2049	18055	4971	1308
200779	19191	2007	18216	4930	1173
204428	23171	2660	18960	5001	1291
207617	19463	2063	17903	5059	1466
212071	22522	2113	18842	5085	1507
214239	20265	2145	18907	5111	1478
215883	24249	2866	19862	5190	1629
223484	20299	2163	18836	5076	1712
221529	25455	2157	19846	5134	1727
225247	21089	2201	19511	4804	1519
226699	26237	2838	20318	4579	1617
231406	21362	2142	19843	4526	1637
232324	26489	2253	20975	4550	1633
237192	21828	2258	20485	4566	1469
236727	27496	2979	21407	4588	1657
240698	21991	2288	20404	4564	1599
240688	27611	2431	21454	4723	1420
245283	22512	2393	21558	4553	1495
243556	28581	3244	22442	4556	1623
247826	23000	2476	21201	4542	1346
245798	28385	2490	21804	4234	1613
250479	23387	2547	22537	4341	1563
249216	30192	3461	22736	4269	2071
251896	24346	2549	21525	4217	1584
247616	30393	2496	22427	4207	1843
249994	24753	2532	23437	4267	1598
246552	31723	3553	23366	4249	1687
248771	24838	2555	22281	4217	1473
247551	32272	2565	22994	4172	2080
249745	25219	2548	24007	4161	1703
245742	33191	3932	24145	4103	1832
249019	26218	2525	23065	4027	1781
245841	33537	2633	24374	4042	2481
248771	27975	2657	24805	4120	1977
244723	34356	3829	25159	4188	1974
246878	27082	2769	23751	4185	1777
246014	34333	2816	25487	4216	2303
248496	28141	3052	25608	4250	1480
244351	36125	4146	26396	4259	1907
248016	28451	3185	25207	4206	1610
246509	35801	3147	27000	4132	1546
249426	28979	3161	27369	3944	1718
247840	37285	4311	28401	3872	1841
251035	30310	3155	27126	3797	1650
250161	36721	3284	28474	3840	1671
254278	29534	3350	28926	3895	1974
250801	38626	4268	29894	3633	2153
253985	29654	3220	28822	3622	1898
249174	42638	8289	29849	3562	2725
251287	31372	3419	30624	3555	2047
247947	39603	3902	31038	3489	1698
249992	31647	3223	29468	3500	1768
243805	39946	3447	31294	3373	1921
255812	31518	3389	32110	3285	9782
250417	42743	4637	32827	3292	2231
253033	33462	3509	31327	3241	2062
248705	41744	4107	32749	3266	2132
253950	33142	3632	33598	3168	2465
251484	41753	4490	33878	3181	2198
251093	35487	3649	32292	3246	2330
245996	44720	3983	34021	3159	1214
252721	33472	3678	34955	3209	2517
248019	45134	4570	35322	3220	2255
250464	36255	3778	33816	3305	2379
245571	46228	4153	35766	3251	2349
252690	35483	4027	36770	3281	2219
250183	47663	5050	37762	3304	2470
253639	38064	4155	36298	3270	2540
254436	47177	4475	39219	3377	2667
265280	35062	4117	39664	3235	3507
268705	45062	5193	40178	3125	2972
270643	36943	4199	38402	3091	2678
271480	46194	4391	40957	3102	2979


Summary of computational transaction
Raw Inputview raw input (R code)
Raw Outputview raw output of R engine
Computing time4 seconds
R Server'Gwilym Jenkins' @ jenkins.wessa.net

\begin{tabular}{lllllllll}
\hline
Summary of computational transaction \tabularnewline
Raw Input & view raw input (R code)  \tabularnewline
Raw Output & view raw output of R engine  \tabularnewline
Computing time & 4 seconds \tabularnewline
R Server & 'Gwilym Jenkins' @ jenkins.wessa.net \tabularnewline
\hline
\end{tabular}
%Source: https://freestatistics.org/blog/index.php?pk=154935&T=0

[TABLE]
[ROW][C]Summary of computational transaction[/C][/ROW]
[ROW][C]Raw Input[/C][C]view raw input (R code) [/C][/ROW]
[ROW][C]Raw Output[/C][C]view raw output of R engine [/C][/ROW]
[ROW][C]Computing time[/C][C]4 seconds[/C][/ROW]
[ROW][C]R Server[/C][C]'Gwilym Jenkins' @ jenkins.wessa.net[/C][/ROW]
[/TABLE]
Source: https://freestatistics.org/blog/index.php?pk=154935&T=0

Globally Unique Identifier (entire table): ba.freestatistics.org/blog/index.php?pk=154935&T=0

As an alternative you can also use a QR Code:  

The GUIDs for individual cells are displayed in the table below:

Summary of computational transaction
Raw Inputview raw input (R code)
Raw Outputview raw output of R engine
Computing time4 seconds
R Server'Gwilym Jenkins' @ jenkins.wessa.net


10-Fold Cross Validation
Prediction (training)Prediction (testing)
ActualC1C2CVC1C2CV
C1270620.813335130.7292
C2352990.895210360.7826
Overall--0.8544--0.7553

\begin{tabular}{lllllllll}
\hline
10-Fold Cross Validation \tabularnewline
 & Prediction (training) & Prediction (testing) \tabularnewline
Actual & C1 & C2 & CV & C1 & C2 & CV \tabularnewline
C1 & 270 & 62 & 0.8133 & 35 & 13 & 0.7292 \tabularnewline
C2 & 35 & 299 & 0.8952 & 10 & 36 & 0.7826 \tabularnewline
Overall & - & - & 0.8544 & - & - & 0.7553 \tabularnewline
\hline
\end{tabular}
%Source: https://freestatistics.org/blog/index.php?pk=154935&T=1

[TABLE]
[ROW][C]10-Fold Cross Validation[/C][/ROW]
[ROW][C][/C][C]Prediction (training)[/C][C]Prediction (testing)[/C][/ROW]
[ROW][C]Actual[/C][C]C1[/C][C]C2[/C][C]CV[/C][C]C1[/C][C]C2[/C][C]CV[/C][/ROW]
[ROW][C]C1[/C][C]270[/C][C]62[/C][C]0.8133[/C][C]35[/C][C]13[/C][C]0.7292[/C][/ROW]
[ROW][C]C2[/C][C]35[/C][C]299[/C][C]0.8952[/C][C]10[/C][C]36[/C][C]0.7826[/C][/ROW]
[ROW][C]Overall[/C][C]-[/C][C]-[/C][C]0.8544[/C][C]-[/C][C]-[/C][C]0.7553[/C][/ROW]
[/TABLE]
Source: https://freestatistics.org/blog/index.php?pk=154935&T=1

Globally Unique Identifier (entire table): ba.freestatistics.org/blog/index.php?pk=154935&T=1

As an alternative you can also use a QR Code:  

The GUIDs for individual cells are displayed in the table below:

10-Fold Cross Validation
Prediction (training)Prediction (testing)
ActualC1C2CVC1C2CV
C1270620.813335130.7292
C2352990.895210360.7826
Overall--0.8544--0.7553


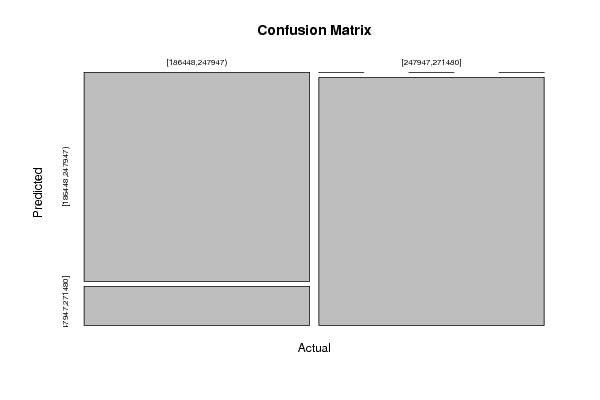
Confusion Matrix (predicted in columns / actuals in rows)
C1C2
C1326
C2038

\begin{tabular}{lllllllll}
\hline
Confusion Matrix (predicted in columns / actuals in rows) \tabularnewline
 & C1 & C2 \tabularnewline
C1 & 32 & 6 \tabularnewline
C2 & 0 & 38 \tabularnewline
\hline
\end{tabular}
%Source: https://freestatistics.org/blog/index.php?pk=154935&T=2

[TABLE]
[ROW][C]Confusion Matrix (predicted in columns / actuals in rows)[/C][/ROW]
[ROW][C][/C][C]C1[/C][C]C2[/C][/ROW]
[ROW][C]C1[/C][C]32[/C][C]6[/C][/ROW]
[ROW][C]C2[/C][C]0[/C][C]38[/C][/ROW]
[/TABLE]
Source: https://freestatistics.org/blog/index.php?pk=154935&T=2

Globally Unique Identifier (entire table): ba.freestatistics.org/blog/index.php?pk=154935&T=2

As an alternative you can also use a QR Code:  

The GUIDs for individual cells are displayed in the table below:

Confusion Matrix (predicted in columns / actuals in rows)
C1C2
C1326
C2038


Parameters (Session):
par1 = 1 ; par2 = quantiles ; par3 = 2 ; par4 = yes ;
Parameters (R input):
par1 = 1 ; par2 = quantiles ; par3 = 2 ; par4 = yes ;
R code (references can be found in the software module):
library(party)
library(Hmisc)
par1 <- as.numeric(par1)
par3 <- as.numeric(par3)
x <- data.frame(t(y))
is.data.frame(x)
x <- x[!is.na(x[,par1]),]
k <- length(x[1,])
n <- length(x[,1])
colnames(x)[par1]
x[,par1]
if (par2 == 'kmeans') {
cl <- kmeans(x[,par1], par3)
print(cl)
clm <- matrix(cbind(cl$centers,1:par3),ncol=2)
clm <- clm[sort.list(clm[,1]),]
for (i in 1:par3) {
cl$cluster[cl$cluster==clm[i,2]] <- paste('C',i,sep='')
}
cl$cluster <- as.factor(cl$cluster)
print(cl$cluster)
x[,par1] <- cl$cluster
}
if (par2 == 'quantiles') {
x[,par1] <- cut2(x[,par1],g=par3)
}
if (par2 == 'hclust') {
hc <- hclust(dist(x[,par1])^2, 'cen')
print(hc)
memb <- cutree(hc, k = par3)
dum <- c(mean(x[memb==1,par1]))
for (i in 2:par3) {
dum <- c(dum, mean(x[memb==i,par1]))
}
hcm <- matrix(cbind(dum,1:par3),ncol=2)
hcm <- hcm[sort.list(hcm[,1]),]
for (i in 1:par3) {
memb[memb==hcm[i,2]] <- paste('C',i,sep='')
}
memb <- as.factor(memb)
print(memb)
x[,par1] <- memb
}
if (par2=='equal') {
ed <- cut(as.numeric(x[,par1]),par3,labels=paste('C',1:par3,sep=''))
x[,par1] <- as.factor(ed)
}
table(x[,par1])
colnames(x)
colnames(x)[par1]
x[,par1]
if (par2 == 'none') {
m <- ctree(as.formula(paste(colnames(x)[par1],' ~ .',sep='')),data = x)
}
load(file='createtable')
if (par2 != 'none') {
m <- ctree(as.formula(paste('as.factor(',colnames(x)[par1],') ~ .',sep='')),data = x)
if (par4=='yes') {
a<-table.start()
a<-table.row.start(a)
a<-table.element(a,'10-Fold Cross Validation',3+2*par3,TRUE)
a<-table.row.end(a)
a<-table.row.start(a)
a<-table.element(a,'',1,TRUE)
a<-table.element(a,'Prediction (training)',par3+1,TRUE)
a<-table.element(a,'Prediction (testing)',par3+1,TRUE)
a<-table.row.end(a)
a<-table.row.start(a)
a<-table.element(a,'Actual',1,TRUE)
for (jjj in 1:par3) a<-table.element(a,paste('C',jjj,sep=''),1,TRUE)
a<-table.element(a,'CV',1,TRUE)
for (jjj in 1:par3) a<-table.element(a,paste('C',jjj,sep=''),1,TRUE)
a<-table.element(a,'CV',1,TRUE)
a<-table.row.end(a)
for (i in 1:10) {
ind <- sample(2, nrow(x), replace=T, prob=c(0.9,0.1))
m.ct <- ctree(as.formula(paste('as.factor(',colnames(x)[par1],') ~ .',sep='')),data =x[ind==1,])
if (i==1) {
m.ct.i.pred <- predict(m.ct, newdata=x[ind==1,])
m.ct.i.actu <- x[ind==1,par1]
m.ct.x.pred <- predict(m.ct, newdata=x[ind==2,])
m.ct.x.actu <- x[ind==2,par1]
} else {
m.ct.i.pred <- c(m.ct.i.pred,predict(m.ct, newdata=x[ind==1,]))
m.ct.i.actu <- c(m.ct.i.actu,x[ind==1,par1])
m.ct.x.pred <- c(m.ct.x.pred,predict(m.ct, newdata=x[ind==2,]))
m.ct.x.actu <- c(m.ct.x.actu,x[ind==2,par1])
}
}
print(m.ct.i.tab <- table(m.ct.i.actu,m.ct.i.pred))
numer <- 0
for (i in 1:par3) {
print(m.ct.i.tab[i,i] / sum(m.ct.i.tab[i,]))
numer <- numer + m.ct.i.tab[i,i]
}
print(m.ct.i.cp <- numer / sum(m.ct.i.tab))
print(m.ct.x.tab <- table(m.ct.x.actu,m.ct.x.pred))
numer <- 0
for (i in 1:par3) {
print(m.ct.x.tab[i,i] / sum(m.ct.x.tab[i,]))
numer <- numer + m.ct.x.tab[i,i]
}
print(m.ct.x.cp <- numer / sum(m.ct.x.tab))
for (i in 1:par3) {
a<-table.row.start(a)
a<-table.element(a,paste('C',i,sep=''),1,TRUE)
for (jjj in 1:par3) a<-table.element(a,m.ct.i.tab[i,jjj])
a<-table.element(a,round(m.ct.i.tab[i,i]/sum(m.ct.i.tab[i,]),4))
for (jjj in 1:par3) a<-table.element(a,m.ct.x.tab[i,jjj])
a<-table.element(a,round(m.ct.x.tab[i,i]/sum(m.ct.x.tab[i,]),4))
a<-table.row.end(a)
}
a<-table.row.start(a)
a<-table.element(a,'Overall',1,TRUE)
for (jjj in 1:par3) a<-table.element(a,'-')
a<-table.element(a,round(m.ct.i.cp,4))
for (jjj in 1:par3) a<-table.element(a,'-')
a<-table.element(a,round(m.ct.x.cp,4))
a<-table.row.end(a)
a<-table.end(a)
table.save(a,file='mytable3.tab')
}
}
m
bitmap(file='test1.png')
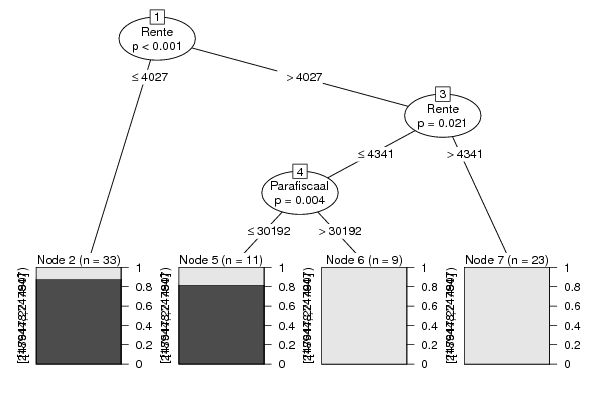
plot(m)
dev.off()
bitmap(file='test1a.png')
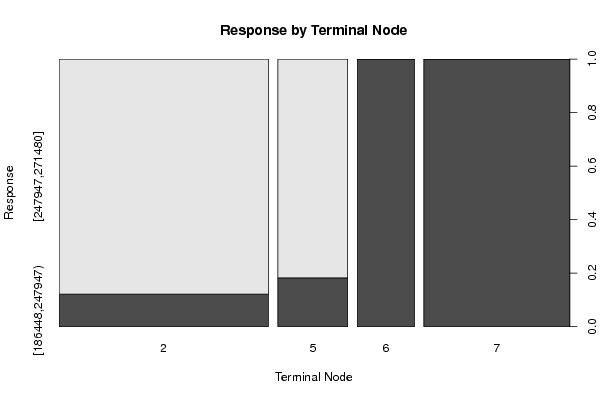
plot(x[,par1] ~ as.factor(where(m)),main='Response by Terminal Node',xlab='Terminal Node',ylab='Response')
dev.off()
if (par2 == 'none') {
forec <- predict(m)
result <- as.data.frame(cbind(x[,par1],forec,x[,par1]-forec))
colnames(result) <- c('Actuals','Forecasts','Residuals')
print(result)
}
if (par2 != 'none') {
print(cbind(as.factor(x[,par1]),predict(m)))
myt <- table(as.factor(x[,par1]),predict(m))
print(myt)
}
bitmap(file='test2.png')
if(par2=='none') {
op <- par(mfrow=c(2,2))
plot(density(result$Actuals),main='Kernel Density Plot of Actuals')
plot(density(result$Residuals),main='Kernel Density Plot of Residuals')
plot(result$Forecasts,result$Actuals,main='Actuals versus Predictions',xlab='Predictions',ylab='Actuals')
plot(density(result$Forecasts),main='Kernel Density Plot of Predictions')
par(op)
}
if(par2!='none') {
plot(myt,main='Confusion Matrix',xlab='Actual',ylab='Predicted')
}
dev.off()
if (par2 == 'none') {
detcoef <- cor(result$Forecasts,result$Actuals)
a<-table.start()
a<-table.row.start(a)
a<-table.element(a,'Goodness of Fit',2,TRUE)
a<-table.row.end(a)
a<-table.row.start(a)
a<-table.element(a,'Correlation',1,TRUE)
a<-table.element(a,round(detcoef,4))
a<-table.row.end(a)
a<-table.row.start(a)
a<-table.element(a,'R-squared',1,TRUE)
a<-table.element(a,round(detcoef*detcoef,4))
a<-table.row.end(a)
a<-table.row.start(a)
a<-table.element(a,'RMSE',1,TRUE)
a<-table.element(a,round(sqrt(mean((result$Residuals)^2)),4))
a<-table.row.end(a)
a<-table.end(a)
table.save(a,file='mytable1.tab')
a<-table.start()
a<-table.row.start(a)
a<-table.element(a,'Actuals, Predictions, and Residuals',4,TRUE)
a<-table.row.end(a)
a<-table.row.start(a)
a<-table.element(a,'#',header=TRUE)
a<-table.element(a,'Actuals',header=TRUE)
a<-table.element(a,'Forecasts',header=TRUE)
a<-table.element(a,'Residuals',header=TRUE)
a<-table.row.end(a)
for (i in 1:length(result$Actuals)) {
a<-table.row.start(a)
a<-table.element(a,i,header=TRUE)
a<-table.element(a,result$Actuals[i])
a<-table.element(a,result$Forecasts[i])
a<-table.element(a,result$Residuals[i])
a<-table.row.end(a)
}
a<-table.end(a)
table.save(a,file='mytable.tab')
}
if (par2 != 'none') {
a<-table.start()
a<-table.row.start(a)
a<-table.element(a,'Confusion Matrix (predicted in columns / actuals in rows)',par3+1,TRUE)
a<-table.row.end(a)
a<-table.row.start(a)
a<-table.element(a,'',1,TRUE)
for (i in 1:par3) {
a<-table.element(a,paste('C',i,sep=''),1,TRUE)
}
a<-table.row.end(a)
for (i in 1:par3) {
a<-table.row.start(a)
a<-table.element(a,paste('C',i,sep=''),1,TRUE)
for (j in 1:par3) {
a<-table.element(a,myt[i,j])
}
a<-table.row.end(a)
}
a<-table.end(a)
table.save(a,file='mytable2.tab')
}