Free Statistics

of Irreproducible Research!

Author's title

Author*The author of this computation has been verified*
R Software Modulerwasp_pairs.wasp
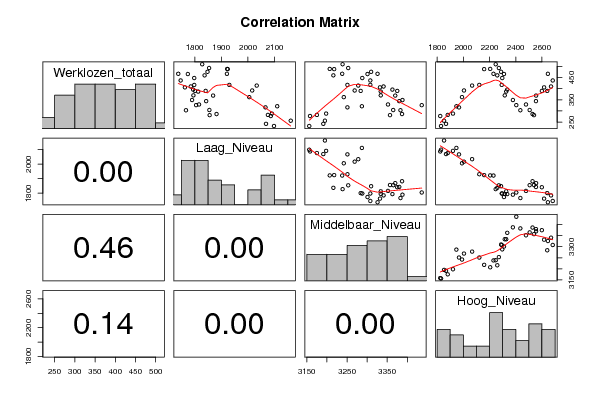
Title produced by softwareKendall tau Correlation Matrix
Date of computationWed, 14 Dec 2011 08:17:12 -0500
Cite this page as followsStatistical Computations at FreeStatistics.org, Office for Research Development and Education, URL https://freestatistics.org/blog/index.php?v=date/2011/Dec/14/t132386868715p4z3a8oebeoap.htm/, Retrieved Wed, 01 May 2024 15:50:38 +0000
Statistical Computations at FreeStatistics.org, Office for Research Development and Education, URL https://freestatistics.org/blog/index.php?pk=154931, Retrieved Wed, 01 May 2024 15:50:38 +0000
QR Codes:

Original text written by user:
IsPrivate?No (this computation is public)
User-defined keywords
Estimated Impact74
Family? (F = Feedback message, R = changed R code, M = changed R Module, P = changed Parameters, D = changed Data)
-       [Kendall tau Correlation Matrix] [Kendall tau Corre...] [2011-12-14 13:17:12] [51aabe75794be7f34bed5d3096a085df] [Current]
Feedback Forum

Post a new message
Dataseries X:
277	2086	3158	1824
232	2098	3156	1830
256	2161	3195	1853
242	2068	3191	1868
282	2075	3175	1881
288	2090	3198	1921
321	2110	3287	1947
316	2066	3251	1967
362	2005	3242	1990
392	2016	3269	2005
414	2033	3278	2067
417	1930	3251	2122
488	1924	3218	2159
489	1922	3207	2205
467	1921	3238	2230
460	1837	3216	2259
510	1828	3239	2247
493	1854	3253	2271
476	1848	3310	2288
448	1798	3288	2297
466	1774	3301	2310
417	1798	3308	2293
387	1813	3334	2327
370	1795	3334	2316
396	1794	3363	2335
349	1790	3388	2378
326	1805	3436	2404
303	1767	3383	2435
329	1816	3352	2478
304	1855	3365	2506
286	1882	3387	2528
281	1856	3357	2539
344	1843	3380	2554
369	1869	3370	2555
390	1841	3375	2599
406	1763	3332	2616
467	1738	3326	2645
437	1747	3308	2682
410	1785	3341	2669
390	1801	3284	2640


Summary of computational transaction
Raw Inputview raw input (R code)
Raw Outputview raw output of R engine
Computing time1 seconds
R Server'AstonUniversity' @ aston.wessa.net

\begin{tabular}{lllllllll}
\hline
Summary of computational transaction \tabularnewline
Raw Input & view raw input (R code)  \tabularnewline
Raw Output & view raw output of R engine  \tabularnewline
Computing time & 1 seconds \tabularnewline
R Server & 'AstonUniversity' @ aston.wessa.net \tabularnewline
\hline
\end{tabular}
%Source: https://freestatistics.org/blog/index.php?pk=154931&T=0

[TABLE]
[ROW][C]Summary of computational transaction[/C][/ROW]
[ROW][C]Raw Input[/C][C]view raw input (R code) [/C][/ROW]
[ROW][C]Raw Output[/C][C]view raw output of R engine [/C][/ROW]
[ROW][C]Computing time[/C][C]1 seconds[/C][/ROW]
[ROW][C]R Server[/C][C]'AstonUniversity' @ aston.wessa.net[/C][/ROW]
[/TABLE]
Source: https://freestatistics.org/blog/index.php?pk=154931&T=0

Globally Unique Identifier (entire table): ba.freestatistics.org/blog/index.php?pk=154931&T=0

As an alternative you can also use a QR Code:  

The GUIDs for individual cells are displayed in the table below:

Summary of computational transaction
Raw Inputview raw input (R code)
Raw Outputview raw output of R engine
Computing time1 seconds
R Server'AstonUniversity' @ aston.wessa.net


Correlations for all pairs of data series (method=kendall)
Werklozen_totaalLaag_NiveauMiddelbaar_NiveauHoog_Niveau
Werklozen_totaal1-0.316-0.0820.163
Laag_Niveau-0.3161-0.424-0.64
Middelbaar_Niveau-0.082-0.42410.59
Hoog_Niveau0.163-0.640.591

\begin{tabular}{lllllllll}
\hline
Correlations for all pairs of data series (method=kendall) \tabularnewline
  & Werklozen_totaal & Laag_Niveau & Middelbaar_Niveau & Hoog_Niveau \tabularnewline
Werklozen_totaal & 1 & -0.316 & -0.082 & 0.163 \tabularnewline
Laag_Niveau & -0.316 & 1 & -0.424 & -0.64 \tabularnewline
Middelbaar_Niveau & -0.082 & -0.424 & 1 & 0.59 \tabularnewline
Hoog_Niveau & 0.163 & -0.64 & 0.59 & 1 \tabularnewline
\hline
\end{tabular}
%Source: https://freestatistics.org/blog/index.php?pk=154931&T=1

[TABLE]
[ROW][C]Correlations for all pairs of data series (method=kendall)[/C][/ROW]
[ROW][C] [/C][C]Werklozen_totaal[/C][C]Laag_Niveau[/C][C]Middelbaar_Niveau[/C][C]Hoog_Niveau[/C][/ROW]
[ROW][C]Werklozen_totaal[/C][C]1[/C][C]-0.316[/C][C]-0.082[/C][C]0.163[/C][/ROW]
[ROW][C]Laag_Niveau[/C][C]-0.316[/C][C]1[/C][C]-0.424[/C][C]-0.64[/C][/ROW]
[ROW][C]Middelbaar_Niveau[/C][C]-0.082[/C][C]-0.424[/C][C]1[/C][C]0.59[/C][/ROW]
[ROW][C]Hoog_Niveau[/C][C]0.163[/C][C]-0.64[/C][C]0.59[/C][C]1[/C][/ROW]
[/TABLE]
Source: https://freestatistics.org/blog/index.php?pk=154931&T=1

Globally Unique Identifier (entire table): ba.freestatistics.org/blog/index.php?pk=154931&T=1

As an alternative you can also use a QR Code:  

The GUIDs for individual cells are displayed in the table below:

Correlations for all pairs of data series (method=kendall)
Werklozen_totaalLaag_NiveauMiddelbaar_NiveauHoog_Niveau
Werklozen_totaal1-0.316-0.0820.163
Laag_Niveau-0.3161-0.424-0.64
Middelbaar_Niveau-0.082-0.42410.59
Hoog_Niveau0.163-0.640.591


Correlations for all pairs of data series with p-values
pairPearson rSpearman rhoKendall tau
Werklozen_totaal;Laag_Niveau-0.5242-0.441-0.3162
p-value(5e-04)(0.0044)(0.0041)
Werklozen_totaal;Middelbaar_Niveau0.0331-0.0291-0.0824
p-value(0.8395)(0.8586)(0.4557)
Werklozen_totaal;Hoog_Niveau0.33350.23110.1631
p-value(0.0354)(0.1514)(0.1389)
Laag_Niveau;Middelbaar_Niveau-0.7053-0.6311-0.4242
p-value(0)(0)(1e-04)
Laag_Niveau;Hoog_Niveau-0.8799-0.8033-0.6402
p-value(0)(0)(0)
Middelbaar_Niveau;Hoog_Niveau0.78630.80190.5896
p-value(0)(0)(0)

\begin{tabular}{lllllllll}
\hline
Correlations for all pairs of data series with p-values \tabularnewline
pair & Pearson r & Spearman rho & Kendall tau \tabularnewline
Werklozen_totaal;Laag_Niveau & -0.5242 & -0.441 & -0.3162 \tabularnewline
p-value & (5e-04) & (0.0044) & (0.0041) \tabularnewline
Werklozen_totaal;Middelbaar_Niveau & 0.0331 & -0.0291 & -0.0824 \tabularnewline
p-value & (0.8395) & (0.8586) & (0.4557) \tabularnewline
Werklozen_totaal;Hoog_Niveau & 0.3335 & 0.2311 & 0.1631 \tabularnewline
p-value & (0.0354) & (0.1514) & (0.1389) \tabularnewline
Laag_Niveau;Middelbaar_Niveau & -0.7053 & -0.6311 & -0.4242 \tabularnewline
p-value & (0) & (0) & (1e-04) \tabularnewline
Laag_Niveau;Hoog_Niveau & -0.8799 & -0.8033 & -0.6402 \tabularnewline
p-value & (0) & (0) & (0) \tabularnewline
Middelbaar_Niveau;Hoog_Niveau & 0.7863 & 0.8019 & 0.5896 \tabularnewline
p-value & (0) & (0) & (0) \tabularnewline
\hline
\end{tabular}
%Source: https://freestatistics.org/blog/index.php?pk=154931&T=2

[TABLE]
[ROW][C]Correlations for all pairs of data series with p-values[/C][/ROW]
[ROW][C]pair[/C][C]Pearson r[/C][C]Spearman rho[/C][C]Kendall tau[/C][/ROW]
[ROW][C]Werklozen_totaal;Laag_Niveau[/C][C]-0.5242[/C][C]-0.441[/C][C]-0.3162[/C][/ROW]
[ROW][C]p-value[/C][C](5e-04)[/C][C](0.0044)[/C][C](0.0041)[/C][/ROW]
[ROW][C]Werklozen_totaal;Middelbaar_Niveau[/C][C]0.0331[/C][C]-0.0291[/C][C]-0.0824[/C][/ROW]
[ROW][C]p-value[/C][C](0.8395)[/C][C](0.8586)[/C][C](0.4557)[/C][/ROW]
[ROW][C]Werklozen_totaal;Hoog_Niveau[/C][C]0.3335[/C][C]0.2311[/C][C]0.1631[/C][/ROW]
[ROW][C]p-value[/C][C](0.0354)[/C][C](0.1514)[/C][C](0.1389)[/C][/ROW]
[ROW][C]Laag_Niveau;Middelbaar_Niveau[/C][C]-0.7053[/C][C]-0.6311[/C][C]-0.4242[/C][/ROW]
[ROW][C]p-value[/C][C](0)[/C][C](0)[/C][C](1e-04)[/C][/ROW]
[ROW][C]Laag_Niveau;Hoog_Niveau[/C][C]-0.8799[/C][C]-0.8033[/C][C]-0.6402[/C][/ROW]
[ROW][C]p-value[/C][C](0)[/C][C](0)[/C][C](0)[/C][/ROW]
[ROW][C]Middelbaar_Niveau;Hoog_Niveau[/C][C]0.7863[/C][C]0.8019[/C][C]0.5896[/C][/ROW]
[ROW][C]p-value[/C][C](0)[/C][C](0)[/C][C](0)[/C][/ROW]
[/TABLE]
Source: https://freestatistics.org/blog/index.php?pk=154931&T=2

Globally Unique Identifier (entire table): ba.freestatistics.org/blog/index.php?pk=154931&T=2

As an alternative you can also use a QR Code:  

The GUIDs for individual cells are displayed in the table below:

Correlations for all pairs of data series with p-values
pairPearson rSpearman rhoKendall tau
Werklozen_totaal;Laag_Niveau-0.5242-0.441-0.3162
p-value(5e-04)(0.0044)(0.0041)
Werklozen_totaal;Middelbaar_Niveau0.0331-0.0291-0.0824
p-value(0.8395)(0.8586)(0.4557)
Werklozen_totaal;Hoog_Niveau0.33350.23110.1631
p-value(0.0354)(0.1514)(0.1389)
Laag_Niveau;Middelbaar_Niveau-0.7053-0.6311-0.4242
p-value(0)(0)(1e-04)
Laag_Niveau;Hoog_Niveau-0.8799-0.8033-0.6402
p-value(0)(0)(0)
Middelbaar_Niveau;Hoog_Niveau0.78630.80190.5896
p-value(0)(0)(0)


Parameters (Session):
par1 = kendall ;
Parameters (R input):
par1 = kendall ;
R code (references can be found in the software module):
panel.tau <- function(x, y, digits=2, prefix='', cex.cor)
{
usr <- par('usr'); on.exit(par(usr))
par(usr = c(0, 1, 0, 1))
rr <- cor.test(x, y, method=par1)
r <- round(rr$p.value,2)
txt <- format(c(r, 0.123456789), digits=digits)[1]
txt <- paste(prefix, txt, sep='')
if(missing(cex.cor)) cex <- 0.5/strwidth(txt)
text(0.5, 0.5, txt, cex = cex)
}
panel.hist <- function(x, ...)
{
usr <- par('usr'); on.exit(par(usr))
par(usr = c(usr[1:2], 0, 1.5) )
h <- hist(x, plot = FALSE)
breaks <- h$breaks; nB <- length(breaks)
y <- h$counts; y <- y/max(y)
rect(breaks[-nB], 0, breaks[-1], y, col='grey', ...)
}
bitmap(file='test1.png')
pairs(t(y),diag.panel=panel.hist, upper.panel=panel.smooth, lower.panel=panel.tau, main=main)
dev.off()
load(file='createtable')
n <- length(y[,1])
n
a<-table.start()
a<-table.row.start(a)
a<-table.element(a,paste('Correlations for all pairs of data series (method=',par1,')',sep=''),n+1,TRUE)
a<-table.row.end(a)
a<-table.row.start(a)
a<-table.element(a,' ',header=TRUE)
for (i in 1:n) {
a<-table.element(a,dimnames(t(x))[[2]][i],header=TRUE)
}
a<-table.row.end(a)
for (i in 1:n) {
a<-table.row.start(a)
a<-table.element(a,dimnames(t(x))[[2]][i],header=TRUE)
for (j in 1:n) {
r <- cor.test(y[i,],y[j,],method=par1)
a<-table.element(a,round(r$estimate,3))
}
a<-table.row.end(a)
}
a<-table.end(a)
table.save(a,file='mytable.tab')
a<-table.start()
a<-table.row.start(a)
a<-table.element(a,'Correlations for all pairs of data series with p-values',4,TRUE)
a<-table.row.end(a)
a<-table.row.start(a)
a<-table.element(a,'pair',1,TRUE)
a<-table.element(a,'Pearson r',1,TRUE)
a<-table.element(a,'Spearman rho',1,TRUE)
a<-table.element(a,'Kendall tau',1,TRUE)
a<-table.row.end(a)
cor.test(y[1,],y[2,],method=par1)
for (i in 1:(n-1))
{
for (j in (i+1):n)
{
a<-table.row.start(a)
dum <- paste(dimnames(t(x))[[2]][i],';',dimnames(t(x))[[2]][j],sep='')
a<-table.element(a,dum,header=TRUE)
rp <- cor.test(y[i,],y[j,],method='pearson')
a<-table.element(a,round(rp$estimate,4))
rs <- cor.test(y[i,],y[j,],method='spearman')
a<-table.element(a,round(rs$estimate,4))
rk <- cor.test(y[i,],y[j,],method='kendall')
a<-table.element(a,round(rk$estimate,4))
a<-table.row.end(a)
a<-table.row.start(a)
a<-table.element(a,'p-value',header=T)
a<-table.element(a,paste('(',round(rp$p.value,4),')',sep=''))
a<-table.element(a,paste('(',round(rs$p.value,4),')',sep=''))
a<-table.element(a,paste('(',round(rk$p.value,4),')',sep=''))
a<-table.row.end(a)
}
}
a<-table.end(a)
table.save(a,file='mytable1.tab')