| Tabulation of Results | |||||||||||||
| Software x Happiness | |||||||||||||
| 7 | 8 | 9 | 10 | 11 | 12 | 13 | 14 | 15 | 16 | 17 | 18 | 19 | 5 | 0 | 0 | 0 | 0 | 0 | 1 | 0 | 0 | 0 | 0 | 0 | 0 | 0 | 6 | 0 | 0 | 1 | 0 | 0 | 2 | 0 | 1 | 2 | 0 | 0 | 0 | 0 | 7 | 0 | 1 | 0 | 1 | 0 | 0 | 0 | 0 | 0 | 2 | 0 | 0 | 0 | 8 | 0 | 0 | 1 | 0 | 0 | 1 | 3 | 2 | 3 | 1 | 0 | 0 | 0 | 9 | 0 | 0 | 1 | 0 | 1 | 1 | 1 | 1 | 1 | 2 | 2 | 0 | 2 | 10 | 0 | 0 | 0 | 0 | 2 | 3 | 2 | 3 | 2 | 2 | 4 | 2 | 0 | 11 | 0 | 0 | 1 | 1 | 1 | 5 | 3 | 5 | 6 | 2 | 2 | 2 | 0 | 12 | 1 | 0 | 1 | 1 | 4 | 1 | 6 | 7 | 16 | 8 | 2 | 0 | 1 | 13 | 0 | 0 | 1 | 1 | 0 | 2 | 1 | 3 | 2 | 3 | 1 | 0 | 0 | 14 | 0 | 0 | 0 | 0 | 3 | 0 | 0 | 2 | 3 | 1 | 1 | 0 | 0 | 15 | 0 | 0 | 0 | 0 | 1 | 0 | 3 | 1 | 0 | 2 | 0 | 1 | 0 |
| Tabulation of Expected Results | |||||||||||||
| Software x Happiness | |||||||||||||
| 7 | 8 | 9 | 10 | 11 | 12 | 13 | 14 | 15 | 16 | 17 | 18 | 19 | 5 | 0.01 | 0.01 | 0.04 | 0.02 | 0.07 | 0.1 | 0.12 | 0.15 | 0.22 | 0.14 | 0.07 | 0.03 | 0.02 | 6 | 0.04 | 0.04 | 0.22 | 0.15 | 0.44 | 0.59 | 0.7 | 0.93 | 1.3 | 0.85 | 0.44 | 0.19 | 0.11 | 7 | 0.02 | 0.02 | 0.15 | 0.1 | 0.3 | 0.4 | 0.47 | 0.62 | 0.86 | 0.57 | 0.3 | 0.12 | 0.07 | 8 | 0.07 | 0.07 | 0.41 | 0.27 | 0.81 | 1.09 | 1.29 | 1.7 | 2.38 | 1.56 | 0.81 | 0.34 | 0.2 | 9 | 0.07 | 0.07 | 0.44 | 0.3 | 0.89 | 1.19 | 1.41 | 1.85 | 2.59 | 1.7 | 0.89 | 0.37 | 0.22 | 10 | 0.12 | 0.12 | 0.74 | 0.49 | 1.48 | 1.98 | 2.35 | 3.09 | 4.32 | 2.84 | 1.48 | 0.62 | 0.37 | 11 | 0.17 | 0.17 | 1.04 | 0.69 | 2.07 | 2.77 | 3.28 | 4.32 | 6.05 | 3.98 | 2.07 | 0.86 | 0.52 | 12 | 0.3 | 0.3 | 1.78 | 1.19 | 3.56 | 4.74 | 5.63 | 7.41 | 10.37 | 6.81 | 3.56 | 1.48 | 0.89 | 13 | 0.09 | 0.09 | 0.52 | 0.35 | 1.04 | 1.38 | 1.64 | 2.16 | 3.02 | 1.99 | 1.04 | 0.43 | 0.26 | 14 | 0.06 | 0.06 | 0.37 | 0.25 | 0.74 | 0.99 | 1.17 | 1.54 | 2.16 | 1.42 | 0.74 | 0.31 | 0.19 | 15 | 0.05 | 0.05 | 0.3 | 0.2 | 0.59 | 0.79 | 0.94 | 1.23 | 1.73 | 1.14 | 0.59 | 0.25 | 0.15 |
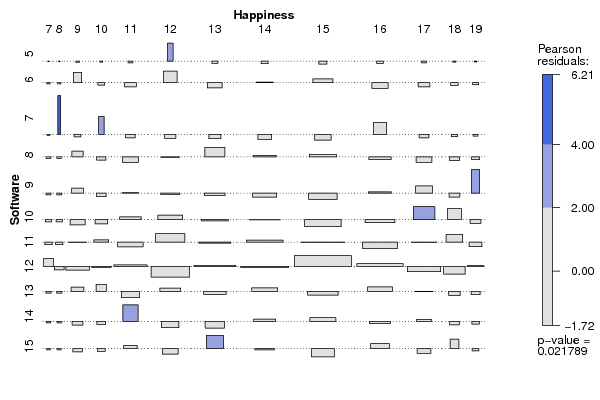
| Statistical Results | |
| Pearson's Chi-squared test | |
| Pearson Chi Square Statistic | 153.27 |
| Degrees of Freedom | 120 |
| P value | 0.02 |