Free Statistics

of Irreproducible Research!

Author's title

Author*The author of this computation has been verified*
R Software Modulerwasp_autocorrelation.wasp
Title produced by software(Partial) Autocorrelation Function
Date of computationTue, 13 Dec 2011 11:40:08 -0500
Cite this page as followsStatistical Computations at FreeStatistics.org, Office for Research Development and Education, URL https://freestatistics.org/blog/index.php?v=date/2011/Dec/13/t1323794416fjpvui7raieuaxl.htm/, Retrieved Thu, 02 May 2024 18:22:58 +0000
Statistical Computations at FreeStatistics.org, Office for Research Development and Education, URL https://freestatistics.org/blog/index.php?pk=154519, Retrieved Thu, 02 May 2024 18:22:58 +0000
QR Codes:

Original text written by user:
IsPrivate?No (this computation is public)
User-defined keywords
Estimated Impact98
Family? (F = Feedback message, R = changed R code, M = changed R Module, P = changed Parameters, D = changed Data)
-     [(Partial) Autocorrelation Function] [] [2011-12-13 16:22:12] [d6b4d011b409693eac2700c83288e3e7]
-    D  [(Partial) Autocorrelation Function] [] [2011-12-13 16:25:51] [d6b4d011b409693eac2700c83288e3e7]
-   P       [(Partial) Autocorrelation Function] [] [2011-12-13 16:40:08] [e232377fd09030116200e3da7df6eeaf] [Current]
Feedback Forum

Post a new message
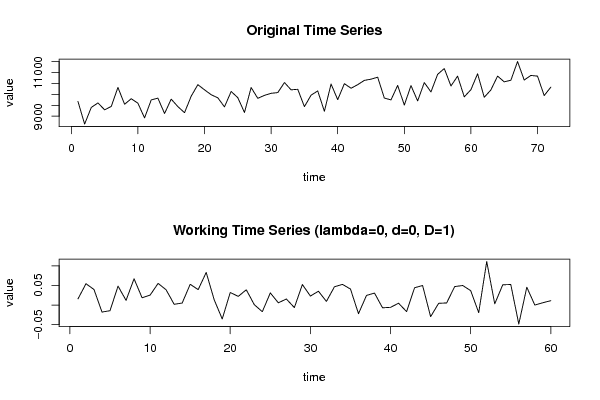
Dataseries X:
9676
8642
9402
9610
9294
9448
10319
9548
9801
9596
8923
9746
9829
9125
9782
9441
9162
9915
10444
10209
9985
9842
9429
10132
9849
9172
10313
9819
9955
10048
10082
10541
10208
10233
9439
9963
10158
9225
10474
9757
10490
10281
10444
10640
10695
10786
9832
9747
10411
9511
10402
9701
10540
10112
10915
11183
10384
10834
9886
10216
10943
9867
10203
10837
10573
10647
11502
10656
10866
10835
9945
10331


Summary of computational transaction
Raw Inputview raw input (R code)
Raw Outputview raw output of R engine
Computing time2 seconds
R Server'Gwilym Jenkins' @ jenkins.wessa.net

\begin{tabular}{lllllllll}
\hline
Summary of computational transaction \tabularnewline
Raw Input & view raw input (R code)  \tabularnewline
Raw Output & view raw output of R engine  \tabularnewline
Computing time & 2 seconds \tabularnewline
R Server & 'Gwilym Jenkins' @ jenkins.wessa.net \tabularnewline
\hline
\end{tabular}
%Source: https://freestatistics.org/blog/index.php?pk=154519&T=0

[TABLE]
[ROW][C]Summary of computational transaction[/C][/ROW]
[ROW][C]Raw Input[/C][C]view raw input (R code) [/C][/ROW]
[ROW][C]Raw Output[/C][C]view raw output of R engine [/C][/ROW]
[ROW][C]Computing time[/C][C]2 seconds[/C][/ROW]
[ROW][C]R Server[/C][C]'Gwilym Jenkins' @ jenkins.wessa.net[/C][/ROW]
[/TABLE]
Source: https://freestatistics.org/blog/index.php?pk=154519&T=0

Globally Unique Identifier (entire table): ba.freestatistics.org/blog/index.php?pk=154519&T=0

As an alternative you can also use a QR Code:  

The GUIDs for individual cells are displayed in the table below:

Summary of computational transaction
Raw Inputview raw input (R code)
Raw Outputview raw output of R engine
Computing time2 seconds
R Server'Gwilym Jenkins' @ jenkins.wessa.net


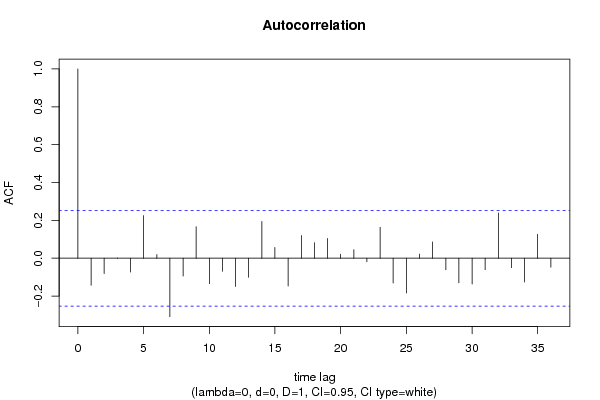
Autocorrelation Function
Time lag kACF(k)T-STATP-value
1-0.142629-1.10480.136828
2-0.080824-0.62610.266824
3-0.001132-0.00880.496515
4-0.072975-0.56530.287001
50.2251951.74440.043109
60.0190780.14780.441506
7-0.308783-2.39180.009958
8-0.093986-0.7280.234719
90.1665831.29030.10094
10-0.135225-1.04740.149548
11-0.068886-0.53360.297798
12-0.149692-1.15950.125421
13-0.100323-0.77710.220076
140.1942581.50470.068822
150.057010.44160.330184
16-0.146508-1.13480.130477
170.1202230.93120.177731
180.0817490.63320.264495
190.1038770.80460.212105
200.0207470.16070.436432
210.045180.350.363795
22-0.019126-0.14810.441362
230.1631851.2640.105555
24-0.131255-1.01670.15669
25-0.183524-1.42160.080164
260.0214930.16650.434166
270.0858260.66480.25436
28-0.061087-0.47320.318901
29-0.129689-1.00460.15957
30-0.135967-1.05320.148237
31-0.060523-0.46880.320453
320.2389051.85060.03458
33-0.049965-0.3870.350053
34-0.125569-0.97270.167316
350.1264670.97960.165606
36-0.047031-0.36430.358457

\begin{tabular}{lllllllll}
\hline
Autocorrelation Function \tabularnewline
Time lag k & ACF(k) & T-STAT & P-value \tabularnewline
1 & -0.142629 & -1.1048 & 0.136828 \tabularnewline
2 & -0.080824 & -0.6261 & 0.266824 \tabularnewline
3 & -0.001132 & -0.0088 & 0.496515 \tabularnewline
4 & -0.072975 & -0.5653 & 0.287001 \tabularnewline
5 & 0.225195 & 1.7444 & 0.043109 \tabularnewline
6 & 0.019078 & 0.1478 & 0.441506 \tabularnewline
7 & -0.308783 & -2.3918 & 0.009958 \tabularnewline
8 & -0.093986 & -0.728 & 0.234719 \tabularnewline
9 & 0.166583 & 1.2903 & 0.10094 \tabularnewline
10 & -0.135225 & -1.0474 & 0.149548 \tabularnewline
11 & -0.068886 & -0.5336 & 0.297798 \tabularnewline
12 & -0.149692 & -1.1595 & 0.125421 \tabularnewline
13 & -0.100323 & -0.7771 & 0.220076 \tabularnewline
14 & 0.194258 & 1.5047 & 0.068822 \tabularnewline
15 & 0.05701 & 0.4416 & 0.330184 \tabularnewline
16 & -0.146508 & -1.1348 & 0.130477 \tabularnewline
17 & 0.120223 & 0.9312 & 0.177731 \tabularnewline
18 & 0.081749 & 0.6332 & 0.264495 \tabularnewline
19 & 0.103877 & 0.8046 & 0.212105 \tabularnewline
20 & 0.020747 & 0.1607 & 0.436432 \tabularnewline
21 & 0.04518 & 0.35 & 0.363795 \tabularnewline
22 & -0.019126 & -0.1481 & 0.441362 \tabularnewline
23 & 0.163185 & 1.264 & 0.105555 \tabularnewline
24 & -0.131255 & -1.0167 & 0.15669 \tabularnewline
25 & -0.183524 & -1.4216 & 0.080164 \tabularnewline
26 & 0.021493 & 0.1665 & 0.434166 \tabularnewline
27 & 0.085826 & 0.6648 & 0.25436 \tabularnewline
28 & -0.061087 & -0.4732 & 0.318901 \tabularnewline
29 & -0.129689 & -1.0046 & 0.15957 \tabularnewline
30 & -0.135967 & -1.0532 & 0.148237 \tabularnewline
31 & -0.060523 & -0.4688 & 0.320453 \tabularnewline
32 & 0.238905 & 1.8506 & 0.03458 \tabularnewline
33 & -0.049965 & -0.387 & 0.350053 \tabularnewline
34 & -0.125569 & -0.9727 & 0.167316 \tabularnewline
35 & 0.126467 & 0.9796 & 0.165606 \tabularnewline
36 & -0.047031 & -0.3643 & 0.358457 \tabularnewline
\hline
\end{tabular}
%Source: https://freestatistics.org/blog/index.php?pk=154519&T=1

[TABLE]
[ROW][C]Autocorrelation Function[/C][/ROW]
[ROW][C]Time lag k[/C][C]ACF(k)[/C][C]T-STAT[/C][C]P-value[/C][/ROW]
[ROW][C]1[/C][C]-0.142629[/C][C]-1.1048[/C][C]0.136828[/C][/ROW]
[ROW][C]2[/C][C]-0.080824[/C][C]-0.6261[/C][C]0.266824[/C][/ROW]
[ROW][C]3[/C][C]-0.001132[/C][C]-0.0088[/C][C]0.496515[/C][/ROW]
[ROW][C]4[/C][C]-0.072975[/C][C]-0.5653[/C][C]0.287001[/C][/ROW]
[ROW][C]5[/C][C]0.225195[/C][C]1.7444[/C][C]0.043109[/C][/ROW]
[ROW][C]6[/C][C]0.019078[/C][C]0.1478[/C][C]0.441506[/C][/ROW]
[ROW][C]7[/C][C]-0.308783[/C][C]-2.3918[/C][C]0.009958[/C][/ROW]
[ROW][C]8[/C][C]-0.093986[/C][C]-0.728[/C][C]0.234719[/C][/ROW]
[ROW][C]9[/C][C]0.166583[/C][C]1.2903[/C][C]0.10094[/C][/ROW]
[ROW][C]10[/C][C]-0.135225[/C][C]-1.0474[/C][C]0.149548[/C][/ROW]
[ROW][C]11[/C][C]-0.068886[/C][C]-0.5336[/C][C]0.297798[/C][/ROW]
[ROW][C]12[/C][C]-0.149692[/C][C]-1.1595[/C][C]0.125421[/C][/ROW]
[ROW][C]13[/C][C]-0.100323[/C][C]-0.7771[/C][C]0.220076[/C][/ROW]
[ROW][C]14[/C][C]0.194258[/C][C]1.5047[/C][C]0.068822[/C][/ROW]
[ROW][C]15[/C][C]0.05701[/C][C]0.4416[/C][C]0.330184[/C][/ROW]
[ROW][C]16[/C][C]-0.146508[/C][C]-1.1348[/C][C]0.130477[/C][/ROW]
[ROW][C]17[/C][C]0.120223[/C][C]0.9312[/C][C]0.177731[/C][/ROW]
[ROW][C]18[/C][C]0.081749[/C][C]0.6332[/C][C]0.264495[/C][/ROW]
[ROW][C]19[/C][C]0.103877[/C][C]0.8046[/C][C]0.212105[/C][/ROW]
[ROW][C]20[/C][C]0.020747[/C][C]0.1607[/C][C]0.436432[/C][/ROW]
[ROW][C]21[/C][C]0.04518[/C][C]0.35[/C][C]0.363795[/C][/ROW]
[ROW][C]22[/C][C]-0.019126[/C][C]-0.1481[/C][C]0.441362[/C][/ROW]
[ROW][C]23[/C][C]0.163185[/C][C]1.264[/C][C]0.105555[/C][/ROW]
[ROW][C]24[/C][C]-0.131255[/C][C]-1.0167[/C][C]0.15669[/C][/ROW]
[ROW][C]25[/C][C]-0.183524[/C][C]-1.4216[/C][C]0.080164[/C][/ROW]
[ROW][C]26[/C][C]0.021493[/C][C]0.1665[/C][C]0.434166[/C][/ROW]
[ROW][C]27[/C][C]0.085826[/C][C]0.6648[/C][C]0.25436[/C][/ROW]
[ROW][C]28[/C][C]-0.061087[/C][C]-0.4732[/C][C]0.318901[/C][/ROW]
[ROW][C]29[/C][C]-0.129689[/C][C]-1.0046[/C][C]0.15957[/C][/ROW]
[ROW][C]30[/C][C]-0.135967[/C][C]-1.0532[/C][C]0.148237[/C][/ROW]
[ROW][C]31[/C][C]-0.060523[/C][C]-0.4688[/C][C]0.320453[/C][/ROW]
[ROW][C]32[/C][C]0.238905[/C][C]1.8506[/C][C]0.03458[/C][/ROW]
[ROW][C]33[/C][C]-0.049965[/C][C]-0.387[/C][C]0.350053[/C][/ROW]
[ROW][C]34[/C][C]-0.125569[/C][C]-0.9727[/C][C]0.167316[/C][/ROW]
[ROW][C]35[/C][C]0.126467[/C][C]0.9796[/C][C]0.165606[/C][/ROW]
[ROW][C]36[/C][C]-0.047031[/C][C]-0.3643[/C][C]0.358457[/C][/ROW]
[/TABLE]
Source: https://freestatistics.org/blog/index.php?pk=154519&T=1

Globally Unique Identifier (entire table): ba.freestatistics.org/blog/index.php?pk=154519&T=1

As an alternative you can also use a QR Code:  

The GUIDs for individual cells are displayed in the table below:

Autocorrelation Function
Time lag kACF(k)T-STATP-value
1-0.142629-1.10480.136828
2-0.080824-0.62610.266824
3-0.001132-0.00880.496515
4-0.072975-0.56530.287001
50.2251951.74440.043109
60.0190780.14780.441506
7-0.308783-2.39180.009958
8-0.093986-0.7280.234719
90.1665831.29030.10094
10-0.135225-1.04740.149548
11-0.068886-0.53360.297798
12-0.149692-1.15950.125421
13-0.100323-0.77710.220076
140.1942581.50470.068822
150.057010.44160.330184
16-0.146508-1.13480.130477
170.1202230.93120.177731
180.0817490.63320.264495
190.1038770.80460.212105
200.0207470.16070.436432
210.045180.350.363795
22-0.019126-0.14810.441362
230.1631851.2640.105555
24-0.131255-1.01670.15669
25-0.183524-1.42160.080164
260.0214930.16650.434166
270.0858260.66480.25436
28-0.061087-0.47320.318901
29-0.129689-1.00460.15957
30-0.135967-1.05320.148237
31-0.060523-0.46880.320453
320.2389051.85060.03458
33-0.049965-0.3870.350053
34-0.125569-0.97270.167316
350.1264670.97960.165606
36-0.047031-0.36430.358457


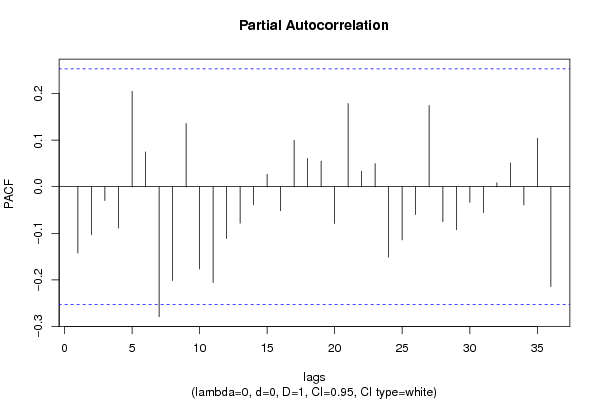
Partial Autocorrelation Function
Time lag kPACF(k)T-STATP-value
1-0.142629-1.10480.136828
2-0.103268-0.79990.213459
3-0.029488-0.22840.410052
4-0.088896-0.68860.246868
50.2050041.5880.058777
60.0744290.57650.283208
7-0.279209-2.16270.017278
8-0.201579-1.56140.061842
90.1359881.05340.148201
10-0.176596-1.36790.088221
11-0.205936-1.59520.057964
12-0.111154-0.8610.196333
13-0.078311-0.60660.273205
14-0.038679-0.29960.382756
150.0267630.20730.418237
16-0.05148-0.39880.345743
170.0998210.77320.221218
180.0606610.46990.320073
190.054610.4230.336901
20-0.078849-0.61080.271833
210.1784831.38250.085968
220.0329880.25550.399595
230.0496540.38460.350941
24-0.15136-1.17240.122829
25-0.114266-0.88510.189817
26-0.059655-0.46210.322846
270.1743291.35030.090989
28-0.075412-0.58410.280657
29-0.092683-0.71790.237797
30-0.033281-0.25780.398724
31-0.055473-0.42970.334478
320.0084720.06560.473948
330.0508140.39360.347634
34-0.039114-0.3030.381477
350.1039680.80530.211905
36-0.214306-1.660.051065

\begin{tabular}{lllllllll}
\hline
Partial Autocorrelation Function \tabularnewline
Time lag k & PACF(k) & T-STAT & P-value \tabularnewline
1 & -0.142629 & -1.1048 & 0.136828 \tabularnewline
2 & -0.103268 & -0.7999 & 0.213459 \tabularnewline
3 & -0.029488 & -0.2284 & 0.410052 \tabularnewline
4 & -0.088896 & -0.6886 & 0.246868 \tabularnewline
5 & 0.205004 & 1.588 & 0.058777 \tabularnewline
6 & 0.074429 & 0.5765 & 0.283208 \tabularnewline
7 & -0.279209 & -2.1627 & 0.017278 \tabularnewline
8 & -0.201579 & -1.5614 & 0.061842 \tabularnewline
9 & 0.135988 & 1.0534 & 0.148201 \tabularnewline
10 & -0.176596 & -1.3679 & 0.088221 \tabularnewline
11 & -0.205936 & -1.5952 & 0.057964 \tabularnewline
12 & -0.111154 & -0.861 & 0.196333 \tabularnewline
13 & -0.078311 & -0.6066 & 0.273205 \tabularnewline
14 & -0.038679 & -0.2996 & 0.382756 \tabularnewline
15 & 0.026763 & 0.2073 & 0.418237 \tabularnewline
16 & -0.05148 & -0.3988 & 0.345743 \tabularnewline
17 & 0.099821 & 0.7732 & 0.221218 \tabularnewline
18 & 0.060661 & 0.4699 & 0.320073 \tabularnewline
19 & 0.05461 & 0.423 & 0.336901 \tabularnewline
20 & -0.078849 & -0.6108 & 0.271833 \tabularnewline
21 & 0.178483 & 1.3825 & 0.085968 \tabularnewline
22 & 0.032988 & 0.2555 & 0.399595 \tabularnewline
23 & 0.049654 & 0.3846 & 0.350941 \tabularnewline
24 & -0.15136 & -1.1724 & 0.122829 \tabularnewline
25 & -0.114266 & -0.8851 & 0.189817 \tabularnewline
26 & -0.059655 & -0.4621 & 0.322846 \tabularnewline
27 & 0.174329 & 1.3503 & 0.090989 \tabularnewline
28 & -0.075412 & -0.5841 & 0.280657 \tabularnewline
29 & -0.092683 & -0.7179 & 0.237797 \tabularnewline
30 & -0.033281 & -0.2578 & 0.398724 \tabularnewline
31 & -0.055473 & -0.4297 & 0.334478 \tabularnewline
32 & 0.008472 & 0.0656 & 0.473948 \tabularnewline
33 & 0.050814 & 0.3936 & 0.347634 \tabularnewline
34 & -0.039114 & -0.303 & 0.381477 \tabularnewline
35 & 0.103968 & 0.8053 & 0.211905 \tabularnewline
36 & -0.214306 & -1.66 & 0.051065 \tabularnewline
\hline
\end{tabular}
%Source: https://freestatistics.org/blog/index.php?pk=154519&T=2

[TABLE]
[ROW][C]Partial Autocorrelation Function[/C][/ROW]
[ROW][C]Time lag k[/C][C]PACF(k)[/C][C]T-STAT[/C][C]P-value[/C][/ROW]
[ROW][C]1[/C][C]-0.142629[/C][C]-1.1048[/C][C]0.136828[/C][/ROW]
[ROW][C]2[/C][C]-0.103268[/C][C]-0.7999[/C][C]0.213459[/C][/ROW]
[ROW][C]3[/C][C]-0.029488[/C][C]-0.2284[/C][C]0.410052[/C][/ROW]
[ROW][C]4[/C][C]-0.088896[/C][C]-0.6886[/C][C]0.246868[/C][/ROW]
[ROW][C]5[/C][C]0.205004[/C][C]1.588[/C][C]0.058777[/C][/ROW]
[ROW][C]6[/C][C]0.074429[/C][C]0.5765[/C][C]0.283208[/C][/ROW]
[ROW][C]7[/C][C]-0.279209[/C][C]-2.1627[/C][C]0.017278[/C][/ROW]
[ROW][C]8[/C][C]-0.201579[/C][C]-1.5614[/C][C]0.061842[/C][/ROW]
[ROW][C]9[/C][C]0.135988[/C][C]1.0534[/C][C]0.148201[/C][/ROW]
[ROW][C]10[/C][C]-0.176596[/C][C]-1.3679[/C][C]0.088221[/C][/ROW]
[ROW][C]11[/C][C]-0.205936[/C][C]-1.5952[/C][C]0.057964[/C][/ROW]
[ROW][C]12[/C][C]-0.111154[/C][C]-0.861[/C][C]0.196333[/C][/ROW]
[ROW][C]13[/C][C]-0.078311[/C][C]-0.6066[/C][C]0.273205[/C][/ROW]
[ROW][C]14[/C][C]-0.038679[/C][C]-0.2996[/C][C]0.382756[/C][/ROW]
[ROW][C]15[/C][C]0.026763[/C][C]0.2073[/C][C]0.418237[/C][/ROW]
[ROW][C]16[/C][C]-0.05148[/C][C]-0.3988[/C][C]0.345743[/C][/ROW]
[ROW][C]17[/C][C]0.099821[/C][C]0.7732[/C][C]0.221218[/C][/ROW]
[ROW][C]18[/C][C]0.060661[/C][C]0.4699[/C][C]0.320073[/C][/ROW]
[ROW][C]19[/C][C]0.05461[/C][C]0.423[/C][C]0.336901[/C][/ROW]
[ROW][C]20[/C][C]-0.078849[/C][C]-0.6108[/C][C]0.271833[/C][/ROW]
[ROW][C]21[/C][C]0.178483[/C][C]1.3825[/C][C]0.085968[/C][/ROW]
[ROW][C]22[/C][C]0.032988[/C][C]0.2555[/C][C]0.399595[/C][/ROW]
[ROW][C]23[/C][C]0.049654[/C][C]0.3846[/C][C]0.350941[/C][/ROW]
[ROW][C]24[/C][C]-0.15136[/C][C]-1.1724[/C][C]0.122829[/C][/ROW]
[ROW][C]25[/C][C]-0.114266[/C][C]-0.8851[/C][C]0.189817[/C][/ROW]
[ROW][C]26[/C][C]-0.059655[/C][C]-0.4621[/C][C]0.322846[/C][/ROW]
[ROW][C]27[/C][C]0.174329[/C][C]1.3503[/C][C]0.090989[/C][/ROW]
[ROW][C]28[/C][C]-0.075412[/C][C]-0.5841[/C][C]0.280657[/C][/ROW]
[ROW][C]29[/C][C]-0.092683[/C][C]-0.7179[/C][C]0.237797[/C][/ROW]
[ROW][C]30[/C][C]-0.033281[/C][C]-0.2578[/C][C]0.398724[/C][/ROW]
[ROW][C]31[/C][C]-0.055473[/C][C]-0.4297[/C][C]0.334478[/C][/ROW]
[ROW][C]32[/C][C]0.008472[/C][C]0.0656[/C][C]0.473948[/C][/ROW]
[ROW][C]33[/C][C]0.050814[/C][C]0.3936[/C][C]0.347634[/C][/ROW]
[ROW][C]34[/C][C]-0.039114[/C][C]-0.303[/C][C]0.381477[/C][/ROW]
[ROW][C]35[/C][C]0.103968[/C][C]0.8053[/C][C]0.211905[/C][/ROW]
[ROW][C]36[/C][C]-0.214306[/C][C]-1.66[/C][C]0.051065[/C][/ROW]
[/TABLE]
Source: https://freestatistics.org/blog/index.php?pk=154519&T=2

Globally Unique Identifier (entire table): ba.freestatistics.org/blog/index.php?pk=154519&T=2

As an alternative you can also use a QR Code:  

The GUIDs for individual cells are displayed in the table below:

Partial Autocorrelation Function
Time lag kPACF(k)T-STATP-value
1-0.142629-1.10480.136828
2-0.103268-0.79990.213459
3-0.029488-0.22840.410052
4-0.088896-0.68860.246868
50.2050041.5880.058777
60.0744290.57650.283208
7-0.279209-2.16270.017278
8-0.201579-1.56140.061842
90.1359881.05340.148201
10-0.176596-1.36790.088221
11-0.205936-1.59520.057964
12-0.111154-0.8610.196333
13-0.078311-0.60660.273205
14-0.038679-0.29960.382756
150.0267630.20730.418237
16-0.05148-0.39880.345743
170.0998210.77320.221218
180.0606610.46990.320073
190.054610.4230.336901
20-0.078849-0.61080.271833
210.1784831.38250.085968
220.0329880.25550.399595
230.0496540.38460.350941
24-0.15136-1.17240.122829
25-0.114266-0.88510.189817
26-0.059655-0.46210.322846
270.1743291.35030.090989
28-0.075412-0.58410.280657
29-0.092683-0.71790.237797
30-0.033281-0.25780.398724
31-0.055473-0.42970.334478
320.0084720.06560.473948
330.0508140.39360.347634
34-0.039114-0.3030.381477
350.1039680.80530.211905
36-0.214306-1.660.051065


Parameters (Session):
par1 = 36 ; par2 = 0.0 ; par3 = 0 ; par4 = 1 ; par5 = 12 ; par6 = White Noise ; par7 = 0.95 ;
Parameters (R input):
par1 = 36 ; par2 = 0.0 ; par3 = 0 ; par4 = 1 ; par5 = 12 ; par6 = White Noise ; par7 = 0.95 ; par8 = ;
R code (references can be found in the software module):
if (par1 == 'Default') {
par1 = 10*log10(length(x))
} else {
par1 <- as.numeric(par1)
}
par2 <- as.numeric(par2)
par3 <- as.numeric(par3)
par4 <- as.numeric(par4)
par5 <- as.numeric(par5)
if (par6 == 'White Noise') par6 <- 'white' else par6 <- 'ma'
par7 <- as.numeric(par7)
if (par8 != '') par8 <- as.numeric(par8)
ox <- x
if (par8 == '') {
if (par2 == 0) {
x <- log(x)
} else {
x <- (x ^ par2 - 1) / par2
}
} else {
x <- log(x,base=par8)
}
if (par3 > 0) x <- diff(x,lag=1,difference=par3)
if (par4 > 0) x <- diff(x,lag=par5,difference=par4)
bitmap(file='picts.png')
op <- par(mfrow=c(2,1))
plot(ox,type='l',main='Original Time Series',xlab='time',ylab='value')
if (par8=='') {
mytitle <- paste('Working Time Series (lambda=',par2,', d=',par3,', D=',par4,')',sep='')
mysub <- paste('(lambda=',par2,', d=',par3,', D=',par4,', CI=', par7, ', CI type=',par6,')',sep='')
} else {
mytitle <- paste('Working Time Series (base=',par8,', d=',par3,', D=',par4,')',sep='')
mysub <- paste('(base=',par8,', d=',par3,', D=',par4,', CI=', par7, ', CI type=',par6,')',sep='')
}
plot(x,type='l', main=mytitle,xlab='time',ylab='value')
par(op)
dev.off()
bitmap(file='pic1.png')
racf <- acf(x, par1, main='Autocorrelation', xlab='time lag', ylab='ACF', ci.type=par6, ci=par7, sub=mysub)
dev.off()
bitmap(file='pic2.png')
rpacf <- pacf(x,par1,main='Partial Autocorrelation',xlab='lags',ylab='PACF',sub=mysub)
dev.off()
(myacf <- c(racf$acf))
(mypacf <- c(rpacf$acf))
lengthx <- length(x)
sqrtn <- sqrt(lengthx)
load(file='createtable')
a<-table.start()
a<-table.row.start(a)
a<-table.element(a,'Autocorrelation Function',4,TRUE)
a<-table.row.end(a)
a<-table.row.start(a)
a<-table.element(a,'Time lag k',header=TRUE)
a<-table.element(a,hyperlink('basics.htm','ACF(k)','click here for more information about the Autocorrelation Function'),header=TRUE)
a<-table.element(a,'T-STAT',header=TRUE)
a<-table.element(a,'P-value',header=TRUE)
a<-table.row.end(a)
for (i in 2:(par1+1)) {
a<-table.row.start(a)
a<-table.element(a,i-1,header=TRUE)
a<-table.element(a,round(myacf[i],6))
mytstat <- myacf[i]*sqrtn
a<-table.element(a,round(mytstat,4))
a<-table.element(a,round(1-pt(abs(mytstat),lengthx),6))
a<-table.row.end(a)
}
a<-table.end(a)
table.save(a,file='mytable.tab')
a<-table.start()
a<-table.row.start(a)
a<-table.element(a,'Partial Autocorrelation Function',4,TRUE)
a<-table.row.end(a)
a<-table.row.start(a)
a<-table.element(a,'Time lag k',header=TRUE)
a<-table.element(a,hyperlink('basics.htm','PACF(k)','click here for more information about the Partial Autocorrelation Function'),header=TRUE)
a<-table.element(a,'T-STAT',header=TRUE)
a<-table.element(a,'P-value',header=TRUE)
a<-table.row.end(a)
for (i in 1:par1) {
a<-table.row.start(a)
a<-table.element(a,i,header=TRUE)
a<-table.element(a,round(mypacf[i],6))
mytstat <- mypacf[i]*sqrtn
a<-table.element(a,round(mytstat,4))
a<-table.element(a,round(1-pt(abs(mytstat),lengthx),6))
a<-table.row.end(a)
}
a<-table.end(a)
table.save(a,file='mytable1.tab')