Free Statistics

of Irreproducible Research!

Author's title

Author*Unverified author*
R Software Modulerwasp_decompose.wasp
Title produced by softwareClassical Decomposition
Date of computationTue, 13 Dec 2011 06:57:25 -0500
Cite this page as followsStatistical Computations at FreeStatistics.org, Office for Research Development and Education, URL https://freestatistics.org/blog/index.php?v=date/2011/Dec/13/t1323777497efhnaro0pd0nbmi.htm/, Retrieved Thu, 02 May 2024 14:03:29 +0000
Statistical Computations at FreeStatistics.org, Office for Research Development and Education, URL https://freestatistics.org/blog/index.php?pk=154369, Retrieved Thu, 02 May 2024 14:03:29 +0000
QR Codes:

Original text written by user:
IsPrivate?No (this computation is public)
User-defined keywords
Estimated Impact73
Family? (F = Feedback message, R = changed R code, M = changed R Module, P = changed Parameters, D = changed Data)
-       [Classical Decomposition] [KDGP2W92] [2011-12-13 11:57:25] [6aac311a4ef05dd368847e65a478df77] [Current]
Feedback Forum

Post a new message
Dataseries X:
217.5
218.6
220.4
221.8
222.5
223.4
225.5
226.5
227.8
228.5
229.1
229.9
230.8
231.9
236
237.5
239.1
240.5
241.4
243.2
243.6
244.3
244.5
245.1
245.8
246.7
247.7
248.5


Summary of computational transaction
Raw Inputview raw input (R code)
Raw Outputview raw output of R engine
Computing time2 seconds
R Server'Gwilym Jenkins' @ jenkins.wessa.net

\begin{tabular}{lllllllll}
\hline
Summary of computational transaction \tabularnewline
Raw Input & view raw input (R code)  \tabularnewline
Raw Output & view raw output of R engine  \tabularnewline
Computing time & 2 seconds \tabularnewline
R Server & 'Gwilym Jenkins' @ jenkins.wessa.net \tabularnewline
\hline
\end{tabular}
%Source: https://freestatistics.org/blog/index.php?pk=154369&T=0

[TABLE]
[ROW][C]Summary of computational transaction[/C][/ROW]
[ROW][C]Raw Input[/C][C]view raw input (R code) [/C][/ROW]
[ROW][C]Raw Output[/C][C]view raw output of R engine [/C][/ROW]
[ROW][C]Computing time[/C][C]2 seconds[/C][/ROW]
[ROW][C]R Server[/C][C]'Gwilym Jenkins' @ jenkins.wessa.net[/C][/ROW]
[/TABLE]
Source: https://freestatistics.org/blog/index.php?pk=154369&T=0

Globally Unique Identifier (entire table): ba.freestatistics.org/blog/index.php?pk=154369&T=0

As an alternative you can also use a QR Code:  

The GUIDs for individual cells are displayed in the table below:

Summary of computational transaction
Raw Inputview raw input (R code)
Raw Outputview raw output of R engine
Computing time2 seconds
R Server'Gwilym Jenkins' @ jenkins.wessa.net


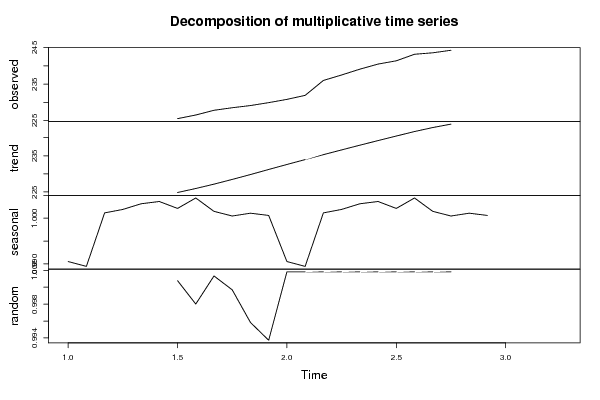
Classical Decomposition by Moving Averages
tObservationsFitTrendSeasonalRandom
1217.5NANA0.990511906231404NA
2218.6NANA0.989454209285536NA
3220.4NANA1.00115274438143NA
4221.8NANA1.00190962423714NA
5222.5NANA1.003147917671NA
6223.4NANA1.00364309762254NA
7225.5225.324073884462224.8458333333331.002126970929541.00078076928268
8226.5226.951216367254225.9541666666671.004412619228470.998011835431085
9227.8227.496644059999227.1583333333331.001489316820131.00133345237357
10228.5228.569817628954228.46251.000469738486420.999694545720524
11229.1230.058212824111229.8083333333331.001087338684170.995834911467198
12229.9231.349959628274231.21251.000594516422220.993732613437222
13230.8230.380687990597232.58750.9905119062314041.0018200831548
14231.9231.478689536479233.9458333333330.9894542092855361.0018200831548
15236235.57124075295235.31.001152744381431.0018200831548
16237.5237.068515588244236.6166666666671.001909624237141.0018200831548
17239.1238.665608745891237.9166666666671.0031479176711.0018200831548
18240.5240.063065258832239.1916666666671.003643097622541.0018200831548
19241.4240.961430160009240.451.002126970929541.0018200831548
20243.2242.758159962362241.6916666666671.004412619228471.0018200831548
21243.6243.157433251774242.7958333333331.001489316820131.0018200831548
22244.3243.856161508244243.7416666666671.000469738486421.0018200831548
23244.5NANA1.00108733868417NA
24245.1NANA1.00059451642222NA
25245.8NANANANA
26246.7NANANANA
27247.7NANANANA
28248.5NANANANA

\begin{tabular}{lllllllll}
\hline
Classical Decomposition by Moving Averages \tabularnewline
t & Observations & Fit & Trend & Seasonal & Random \tabularnewline
1 & 217.5 & NA & NA & 0.990511906231404 & NA \tabularnewline
2 & 218.6 & NA & NA & 0.989454209285536 & NA \tabularnewline
3 & 220.4 & NA & NA & 1.00115274438143 & NA \tabularnewline
4 & 221.8 & NA & NA & 1.00190962423714 & NA \tabularnewline
5 & 222.5 & NA & NA & 1.003147917671 & NA \tabularnewline
6 & 223.4 & NA & NA & 1.00364309762254 & NA \tabularnewline
7 & 225.5 & 225.324073884462 & 224.845833333333 & 1.00212697092954 & 1.00078076928268 \tabularnewline
8 & 226.5 & 226.951216367254 & 225.954166666667 & 1.00441261922847 & 0.998011835431085 \tabularnewline
9 & 227.8 & 227.496644059999 & 227.158333333333 & 1.00148931682013 & 1.00133345237357 \tabularnewline
10 & 228.5 & 228.569817628954 & 228.4625 & 1.00046973848642 & 0.999694545720524 \tabularnewline
11 & 229.1 & 230.058212824111 & 229.808333333333 & 1.00108733868417 & 0.995834911467198 \tabularnewline
12 & 229.9 & 231.349959628274 & 231.2125 & 1.00059451642222 & 0.993732613437222 \tabularnewline
13 & 230.8 & 230.380687990597 & 232.5875 & 0.990511906231404 & 1.0018200831548 \tabularnewline
14 & 231.9 & 231.478689536479 & 233.945833333333 & 0.989454209285536 & 1.0018200831548 \tabularnewline
15 & 236 & 235.57124075295 & 235.3 & 1.00115274438143 & 1.0018200831548 \tabularnewline
16 & 237.5 & 237.068515588244 & 236.616666666667 & 1.00190962423714 & 1.0018200831548 \tabularnewline
17 & 239.1 & 238.665608745891 & 237.916666666667 & 1.003147917671 & 1.0018200831548 \tabularnewline
18 & 240.5 & 240.063065258832 & 239.191666666667 & 1.00364309762254 & 1.0018200831548 \tabularnewline
19 & 241.4 & 240.961430160009 & 240.45 & 1.00212697092954 & 1.0018200831548 \tabularnewline
20 & 243.2 & 242.758159962362 & 241.691666666667 & 1.00441261922847 & 1.0018200831548 \tabularnewline
21 & 243.6 & 243.157433251774 & 242.795833333333 & 1.00148931682013 & 1.0018200831548 \tabularnewline
22 & 244.3 & 243.856161508244 & 243.741666666667 & 1.00046973848642 & 1.0018200831548 \tabularnewline
23 & 244.5 & NA & NA & 1.00108733868417 & NA \tabularnewline
24 & 245.1 & NA & NA & 1.00059451642222 & NA \tabularnewline
25 & 245.8 & NA & NA & NA & NA \tabularnewline
26 & 246.7 & NA & NA & NA & NA \tabularnewline
27 & 247.7 & NA & NA & NA & NA \tabularnewline
28 & 248.5 & NA & NA & NA & NA \tabularnewline
\hline
\end{tabular}
%Source: https://freestatistics.org/blog/index.php?pk=154369&T=1

[TABLE]
[ROW][C]Classical Decomposition by Moving Averages[/C][/ROW]
[ROW][C]t[/C][C]Observations[/C][C]Fit[/C][C]Trend[/C][C]Seasonal[/C][C]Random[/C][/ROW]
[ROW][C]1[/C][C]217.5[/C][C]NA[/C][C]NA[/C][C]0.990511906231404[/C][C]NA[/C][/ROW]
[ROW][C]2[/C][C]218.6[/C][C]NA[/C][C]NA[/C][C]0.989454209285536[/C][C]NA[/C][/ROW]
[ROW][C]3[/C][C]220.4[/C][C]NA[/C][C]NA[/C][C]1.00115274438143[/C][C]NA[/C][/ROW]
[ROW][C]4[/C][C]221.8[/C][C]NA[/C][C]NA[/C][C]1.00190962423714[/C][C]NA[/C][/ROW]
[ROW][C]5[/C][C]222.5[/C][C]NA[/C][C]NA[/C][C]1.003147917671[/C][C]NA[/C][/ROW]
[ROW][C]6[/C][C]223.4[/C][C]NA[/C][C]NA[/C][C]1.00364309762254[/C][C]NA[/C][/ROW]
[ROW][C]7[/C][C]225.5[/C][C]225.324073884462[/C][C]224.845833333333[/C][C]1.00212697092954[/C][C]1.00078076928268[/C][/ROW]
[ROW][C]8[/C][C]226.5[/C][C]226.951216367254[/C][C]225.954166666667[/C][C]1.00441261922847[/C][C]0.998011835431085[/C][/ROW]
[ROW][C]9[/C][C]227.8[/C][C]227.496644059999[/C][C]227.158333333333[/C][C]1.00148931682013[/C][C]1.00133345237357[/C][/ROW]
[ROW][C]10[/C][C]228.5[/C][C]228.569817628954[/C][C]228.4625[/C][C]1.00046973848642[/C][C]0.999694545720524[/C][/ROW]
[ROW][C]11[/C][C]229.1[/C][C]230.058212824111[/C][C]229.808333333333[/C][C]1.00108733868417[/C][C]0.995834911467198[/C][/ROW]
[ROW][C]12[/C][C]229.9[/C][C]231.349959628274[/C][C]231.2125[/C][C]1.00059451642222[/C][C]0.993732613437222[/C][/ROW]
[ROW][C]13[/C][C]230.8[/C][C]230.380687990597[/C][C]232.5875[/C][C]0.990511906231404[/C][C]1.0018200831548[/C][/ROW]
[ROW][C]14[/C][C]231.9[/C][C]231.478689536479[/C][C]233.945833333333[/C][C]0.989454209285536[/C][C]1.0018200831548[/C][/ROW]
[ROW][C]15[/C][C]236[/C][C]235.57124075295[/C][C]235.3[/C][C]1.00115274438143[/C][C]1.0018200831548[/C][/ROW]
[ROW][C]16[/C][C]237.5[/C][C]237.068515588244[/C][C]236.616666666667[/C][C]1.00190962423714[/C][C]1.0018200831548[/C][/ROW]
[ROW][C]17[/C][C]239.1[/C][C]238.665608745891[/C][C]237.916666666667[/C][C]1.003147917671[/C][C]1.0018200831548[/C][/ROW]
[ROW][C]18[/C][C]240.5[/C][C]240.063065258832[/C][C]239.191666666667[/C][C]1.00364309762254[/C][C]1.0018200831548[/C][/ROW]
[ROW][C]19[/C][C]241.4[/C][C]240.961430160009[/C][C]240.45[/C][C]1.00212697092954[/C][C]1.0018200831548[/C][/ROW]
[ROW][C]20[/C][C]243.2[/C][C]242.758159962362[/C][C]241.691666666667[/C][C]1.00441261922847[/C][C]1.0018200831548[/C][/ROW]
[ROW][C]21[/C][C]243.6[/C][C]243.157433251774[/C][C]242.795833333333[/C][C]1.00148931682013[/C][C]1.0018200831548[/C][/ROW]
[ROW][C]22[/C][C]244.3[/C][C]243.856161508244[/C][C]243.741666666667[/C][C]1.00046973848642[/C][C]1.0018200831548[/C][/ROW]
[ROW][C]23[/C][C]244.5[/C][C]NA[/C][C]NA[/C][C]1.00108733868417[/C][C]NA[/C][/ROW]
[ROW][C]24[/C][C]245.1[/C][C]NA[/C][C]NA[/C][C]1.00059451642222[/C][C]NA[/C][/ROW]
[ROW][C]25[/C][C]245.8[/C][C]NA[/C][C]NA[/C][C]NA[/C][C]NA[/C][/ROW]
[ROW][C]26[/C][C]246.7[/C][C]NA[/C][C]NA[/C][C]NA[/C][C]NA[/C][/ROW]
[ROW][C]27[/C][C]247.7[/C][C]NA[/C][C]NA[/C][C]NA[/C][C]NA[/C][/ROW]
[ROW][C]28[/C][C]248.5[/C][C]NA[/C][C]NA[/C][C]NA[/C][C]NA[/C][/ROW]
[/TABLE]
Source: https://freestatistics.org/blog/index.php?pk=154369&T=1

Globally Unique Identifier (entire table): ba.freestatistics.org/blog/index.php?pk=154369&T=1

As an alternative you can also use a QR Code:  

The GUIDs for individual cells are displayed in the table below:

Classical Decomposition by Moving Averages
tObservationsFitTrendSeasonalRandom
1217.5NANA0.990511906231404NA
2218.6NANA0.989454209285536NA
3220.4NANA1.00115274438143NA
4221.8NANA1.00190962423714NA
5222.5NANA1.003147917671NA
6223.4NANA1.00364309762254NA
7225.5225.324073884462224.8458333333331.002126970929541.00078076928268
8226.5226.951216367254225.9541666666671.004412619228470.998011835431085
9227.8227.496644059999227.1583333333331.001489316820131.00133345237357
10228.5228.569817628954228.46251.000469738486420.999694545720524
11229.1230.058212824111229.8083333333331.001087338684170.995834911467198
12229.9231.349959628274231.21251.000594516422220.993732613437222
13230.8230.380687990597232.58750.9905119062314041.0018200831548
14231.9231.478689536479233.9458333333330.9894542092855361.0018200831548
15236235.57124075295235.31.001152744381431.0018200831548
16237.5237.068515588244236.6166666666671.001909624237141.0018200831548
17239.1238.665608745891237.9166666666671.0031479176711.0018200831548
18240.5240.063065258832239.1916666666671.003643097622541.0018200831548
19241.4240.961430160009240.451.002126970929541.0018200831548
20243.2242.758159962362241.6916666666671.004412619228471.0018200831548
21243.6243.157433251774242.7958333333331.001489316820131.0018200831548
22244.3243.856161508244243.7416666666671.000469738486421.0018200831548
23244.5NANA1.00108733868417NA
24245.1NANA1.00059451642222NA
25245.8NANANANA
26246.7NANANANA
27247.7NANANANA
28248.5NANANANA


Parameters (Session):
par1 = multiplicative ; par2 = 12 ;
Parameters (R input):
par1 = multiplicative ; par2 = 12 ;
R code (references can be found in the software module):
par2 <- as.numeric(par2)
x <- ts(x,freq=par2)
m <- decompose(x,type=par1)
m$figure
bitmap(file='test1.png')
plot(m)
dev.off()
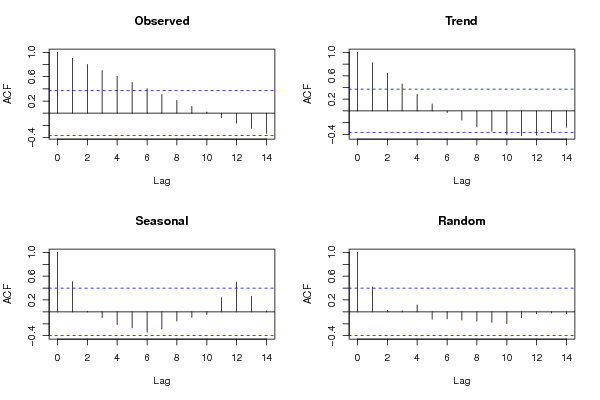
mylagmax <- length(x)/2
bitmap(file='test2.png')
op <- par(mfrow = c(2,2))
acf(as.numeric(x),lag.max = mylagmax,main='Observed')
acf(as.numeric(m$trend),na.action=na.pass,lag.max = mylagmax,main='Trend')
acf(as.numeric(m$seasonal),na.action=na.pass,lag.max = mylagmax,main='Seasonal')
acf(as.numeric(m$random),na.action=na.pass,lag.max = mylagmax,main='Random')
par(op)
dev.off()
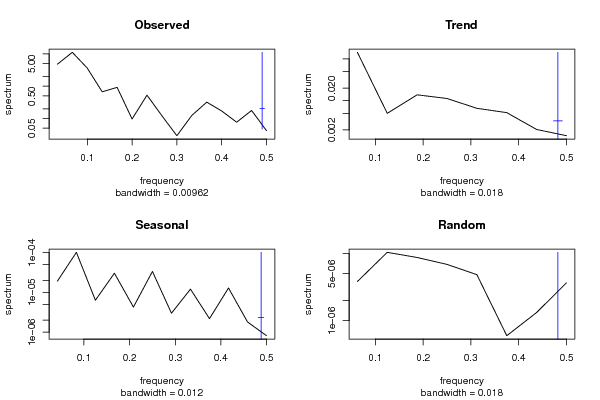
bitmap(file='test3.png')
op <- par(mfrow = c(2,2))
spectrum(as.numeric(x),main='Observed')
spectrum(as.numeric(m$trend[!is.na(m$trend)]),main='Trend')
spectrum(as.numeric(m$seasonal[!is.na(m$seasonal)]),main='Seasonal')
spectrum(as.numeric(m$random[!is.na(m$random)]),main='Random')
par(op)
dev.off()
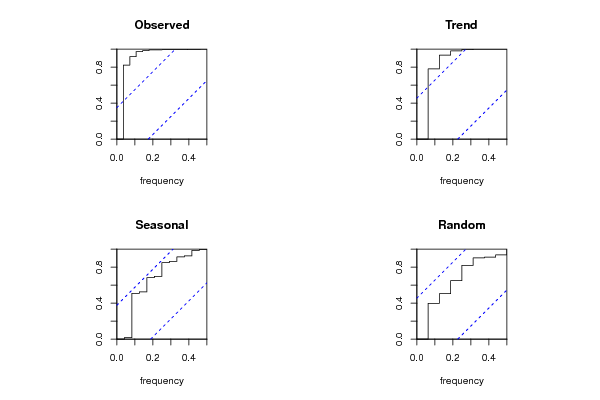
bitmap(file='test4.png')
op <- par(mfrow = c(2,2))
cpgram(as.numeric(x),main='Observed')
cpgram(as.numeric(m$trend[!is.na(m$trend)]),main='Trend')
cpgram(as.numeric(m$seasonal[!is.na(m$seasonal)]),main='Seasonal')
cpgram(as.numeric(m$random[!is.na(m$random)]),main='Random')
par(op)
dev.off()
load(file='createtable')
a<-table.start()
a<-table.row.start(a)
a<-table.element(a,'Classical Decomposition by Moving Averages',6,TRUE)
a<-table.row.end(a)
a<-table.row.start(a)
a<-table.element(a,'t',header=TRUE)
a<-table.element(a,'Observations',header=TRUE)
a<-table.element(a,'Fit',header=TRUE)
a<-table.element(a,'Trend',header=TRUE)
a<-table.element(a,'Seasonal',header=TRUE)
a<-table.element(a,'Random',header=TRUE)
a<-table.row.end(a)
for (i in 1:length(m$trend)) {
a<-table.row.start(a)
a<-table.element(a,i,header=TRUE)
a<-table.element(a,x[i])
if (par1 == 'additive') a<-table.element(a,m$trend[i]+m$seasonal[i]) else a<-table.element(a,m$trend[i]*m$seasonal[i])
a<-table.element(a,m$trend[i])
a<-table.element(a,m$seasonal[i])
a<-table.element(a,m$random[i])
a<-table.row.end(a)
}
a<-table.end(a)
table.save(a,file='mytable.tab')