Free Statistics

of Irreproducible Research!

Author's title

Author*The author of this computation has been verified*
R Software Modulerwasp_multipleregression.wasp
Title produced by softwareMultiple Regression
Date of computationSun, 11 Dec 2011 10:11:10 -0500
Cite this page as followsStatistical Computations at FreeStatistics.org, Office for Research Development and Education, URL https://freestatistics.org/blog/index.php?v=date/2011/Dec/11/t1323616290l2apqnun46d0tbg.htm/, Retrieved Mon, 29 Apr 2024 00:05:53 +0000
Statistical Computations at FreeStatistics.org, Office for Research Development and Education, URL https://freestatistics.org/blog/index.php?pk=153800, Retrieved Mon, 29 Apr 2024 00:05:53 +0000
QR Codes:

Original text written by user:
IsPrivate?No (this computation is public)
User-defined keywords
Estimated Impact53
Family? (F = Feedback message, R = changed R code, M = changed R Module, P = changed Parameters, D = changed Data)
-     [Multiple Regression] [] [2010-12-05 20:18:32] [b98453cac15ba1066b407e146608df68]
- R PD    [Multiple Regression] [] [2011-12-11 15:11:10] [c092f3a3bdd85c7279ddab6c8c6c9261] [Current]
Feedback Forum

Post a new message
Dataseries X:
0	210907	0	2
0	149061	0	0
0	237213	1	0
0	133131	1	4
0	324799	1	0
0	230964	0	-1
0	236785	1	0
0	344297	1	1
0	174724	1	0
0	174415	1	3
0	223632	1	-1
0	294424	0	4
0	325107	1	3
0	106408	0	1
0	96560	0	0
0	265769	1	-2
0	149112	0	-4
0	152871	0	2
0	362301	1	2
0	183167	0	-4
0	218946	1	2
0	244052	1	2
0	341570	1	0
0	196553	1	-3
0	143246	0	2
0	143756	0	4
0	152299	1	2
0	193339	1	2
0	130585	0	-4
0	112611	1	3
0	148446	1	3
0	182079	0	2
0	243060	1	-1
0	162765	1	-3
0	85574	1	0
0	225060	0	1
0	133328	1	-3
0	100750	1	3
0	101523	1	0
0	243511	1	0
0	152474	1	0
0	132487	1	3
0	317394	0	-3
0	244749	1	0
0	128423	0	2
0	97839	0	-1
1	229242	1	2
1	324598	0	2
1	195838	0	-2
1	254488	0	0
1	92499	1	-2
1	224330	0	0
1	181633	1	6
1	271856	1	-3
1	95227	1	3
1	98146	0	0
1	118612	0	-2
1	65475	1	1
1	108446	0	0
1	121848	0	2
1	76302	1	2
1	98104	0	-3
1	30989	1	-2
1	31774	0	1
1	150580	1	-4
1	59382	0	1
1	84105	0	0


Summary of computational transaction
Raw Inputview raw input (R code)
Raw Outputview raw output of R engine
Computing time4 seconds
R Server'Gwilym Jenkins' @ jenkins.wessa.net

\begin{tabular}{lllllllll}
\hline
Summary of computational transaction \tabularnewline
Raw Input & view raw input (R code)  \tabularnewline
Raw Output & view raw output of R engine  \tabularnewline
Computing time & 4 seconds \tabularnewline
R Server & 'Gwilym Jenkins' @ jenkins.wessa.net \tabularnewline
\hline
\end{tabular}
%Source: https://freestatistics.org/blog/index.php?pk=153800&T=0

[TABLE]
[ROW][C]Summary of computational transaction[/C][/ROW]
[ROW][C]Raw Input[/C][C]view raw input (R code) [/C][/ROW]
[ROW][C]Raw Output[/C][C]view raw output of R engine [/C][/ROW]
[ROW][C]Computing time[/C][C]4 seconds[/C][/ROW]
[ROW][C]R Server[/C][C]'Gwilym Jenkins' @ jenkins.wessa.net[/C][/ROW]
[/TABLE]
Source: https://freestatistics.org/blog/index.php?pk=153800&T=0

Globally Unique Identifier (entire table): ba.freestatistics.org/blog/index.php?pk=153800&T=0

As an alternative you can also use a QR Code:  

The GUIDs for individual cells are displayed in the table below:

Summary of computational transaction
Raw Inputview raw input (R code)
Raw Outputview raw output of R engine
Computing time4 seconds
R Server'Gwilym Jenkins' @ jenkins.wessa.net


Multiple Linear Regression - Estimated Regression Equation
pop[t] = + 0.688270169826297 -1.70228289188336e-06time_in_rfc[t] -0.121266574954631gender[t] -0.0122986314051313total_tests[t] + e[t]

\begin{tabular}{lllllllll}
\hline
Multiple Linear Regression - Estimated Regression Equation \tabularnewline
pop[t] =  +  0.688270169826297 -1.70228289188336e-06time_in_rfc[t] -0.121266574954631gender[t] -0.0122986314051313total_tests[t]  + e[t] \tabularnewline
\hline
\end{tabular}
%Source: https://freestatistics.org/blog/index.php?pk=153800&T=1

[TABLE]
[ROW][C]Multiple Linear Regression - Estimated Regression Equation[/C][/ROW]
[ROW][C]pop[t] =  +  0.688270169826297 -1.70228289188336e-06time_in_rfc[t] -0.121266574954631gender[t] -0.0122986314051313total_tests[t]  + e[t][/C][/ROW]
[/TABLE]
Source: https://freestatistics.org/blog/index.php?pk=153800&T=1

Globally Unique Identifier (entire table): ba.freestatistics.org/blog/index.php?pk=153800&T=1

As an alternative you can also use a QR Code:  

The GUIDs for individual cells are displayed in the table below:

Multiple Linear Regression - Estimated Regression Equation
pop[t] = + 0.688270169826297 -1.70228289188336e-06time_in_rfc[t] -0.121266574954631gender[t] -0.0122986314051313total_tests[t] + e[t]


Multiple Linear Regression - Ordinary Least Squares
VariableParameterS.D.T-STATH0: parameter = 02-tail p-value1-tail p-value
(Intercept)0.6882701698262970.1383354.97545e-063e-06
time_in_rfc-1.70228289188336e-061e-06-2.47450.0160460.008023
gender-0.1212665749546310.112881-1.07430.286790.143395
total_tests-0.01229863140513130.024385-0.50440.6157740.307887

\begin{tabular}{lllllllll}
\hline
Multiple Linear Regression - Ordinary Least Squares \tabularnewline
Variable & Parameter & S.D. & T-STATH0: parameter = 0 & 2-tail p-value & 1-tail p-value \tabularnewline
(Intercept) & 0.688270169826297 & 0.138335 & 4.9754 & 5e-06 & 3e-06 \tabularnewline
time_in_rfc & -1.70228289188336e-06 & 1e-06 & -2.4745 & 0.016046 & 0.008023 \tabularnewline
gender & -0.121266574954631 & 0.112881 & -1.0743 & 0.28679 & 0.143395 \tabularnewline
total_tests & -0.0122986314051313 & 0.024385 & -0.5044 & 0.615774 & 0.307887 \tabularnewline
\hline
\end{tabular}
%Source: https://freestatistics.org/blog/index.php?pk=153800&T=2

[TABLE]
[ROW][C]Multiple Linear Regression - Ordinary Least Squares[/C][/ROW]
[ROW][C]Variable[/C][C]Parameter[/C][C]S.D.[/C][C]T-STATH0: parameter = 0[/C][C]2-tail p-value[/C][C]1-tail p-value[/C][/ROW]
[ROW][C](Intercept)[/C][C]0.688270169826297[/C][C]0.138335[/C][C]4.9754[/C][C]5e-06[/C][C]3e-06[/C][/ROW]
[ROW][C]time_in_rfc[/C][C]-1.70228289188336e-06[/C][C]1e-06[/C][C]-2.4745[/C][C]0.016046[/C][C]0.008023[/C][/ROW]
[ROW][C]gender[/C][C]-0.121266574954631[/C][C]0.112881[/C][C]-1.0743[/C][C]0.28679[/C][C]0.143395[/C][/ROW]
[ROW][C]total_tests[/C][C]-0.0122986314051313[/C][C]0.024385[/C][C]-0.5044[/C][C]0.615774[/C][C]0.307887[/C][/ROW]
[/TABLE]
Source: https://freestatistics.org/blog/index.php?pk=153800&T=2

Globally Unique Identifier (entire table): ba.freestatistics.org/blog/index.php?pk=153800&T=2

As an alternative you can also use a QR Code:  

The GUIDs for individual cells are displayed in the table below:

Multiple Linear Regression - Ordinary Least Squares
VariableParameterS.D.T-STATH0: parameter = 02-tail p-value1-tail p-value
(Intercept)0.6882701698262970.1383354.97545e-063e-06
time_in_rfc-1.70228289188336e-061e-06-2.47450.0160460.008023
gender-0.1212665749546310.112881-1.07430.286790.143395
total_tests-0.01229863140513130.024385-0.50440.6157740.307887


Multiple Linear Regression - Regression Statistics
Multiple R0.352943922266451
R-squared0.124569412264827
Adjusted R-squared0.0828822414202948
F-TEST (value)2.98819540259509
F-TEST (DF numerator)3
F-TEST (DF denominator)63
p-value0.037625688967849
Multiple Linear Regression - Residual Statistics
Residual Standard Deviation0.447601718814463
Sum Squared Residuals12.6218798171967

\begin{tabular}{lllllllll}
\hline
Multiple Linear Regression - Regression Statistics \tabularnewline
Multiple R & 0.352943922266451 \tabularnewline
R-squared & 0.124569412264827 \tabularnewline
Adjusted R-squared & 0.0828822414202948 \tabularnewline
F-TEST (value) & 2.98819540259509 \tabularnewline
F-TEST (DF numerator) & 3 \tabularnewline
F-TEST (DF denominator) & 63 \tabularnewline
p-value & 0.037625688967849 \tabularnewline
Multiple Linear Regression - Residual Statistics \tabularnewline
Residual Standard Deviation & 0.447601718814463 \tabularnewline
Sum Squared Residuals & 12.6218798171967 \tabularnewline
\hline
\end{tabular}
%Source: https://freestatistics.org/blog/index.php?pk=153800&T=3

[TABLE]
[ROW][C]Multiple Linear Regression - Regression Statistics[/C][/ROW]
[ROW][C]Multiple R[/C][C]0.352943922266451[/C][/ROW]
[ROW][C]R-squared[/C][C]0.124569412264827[/C][/ROW]
[ROW][C]Adjusted R-squared[/C][C]0.0828822414202948[/C][/ROW]
[ROW][C]F-TEST (value)[/C][C]2.98819540259509[/C][/ROW]
[ROW][C]F-TEST (DF numerator)[/C][C]3[/C][/ROW]
[ROW][C]F-TEST (DF denominator)[/C][C]63[/C][/ROW]
[ROW][C]p-value[/C][C]0.037625688967849[/C][/ROW]
[ROW][C]Multiple Linear Regression - Residual Statistics[/C][/ROW]
[ROW][C]Residual Standard Deviation[/C][C]0.447601718814463[/C][/ROW]
[ROW][C]Sum Squared Residuals[/C][C]12.6218798171967[/C][/ROW]
[/TABLE]
Source: https://freestatistics.org/blog/index.php?pk=153800&T=3

Globally Unique Identifier (entire table): ba.freestatistics.org/blog/index.php?pk=153800&T=3

As an alternative you can also use a QR Code:  

The GUIDs for individual cells are displayed in the table below:

Multiple Linear Regression - Regression Statistics
Multiple R0.352943922266451
R-squared0.124569412264827
Adjusted R-squared0.0828822414202948
F-TEST (value)2.98819540259509
F-TEST (DF numerator)3
F-TEST (DF denominator)63
p-value0.037625688967849
Multiple Linear Regression - Residual Statistics
Residual Standard Deviation0.447601718814463
Sum Squared Residuals12.6218798171967


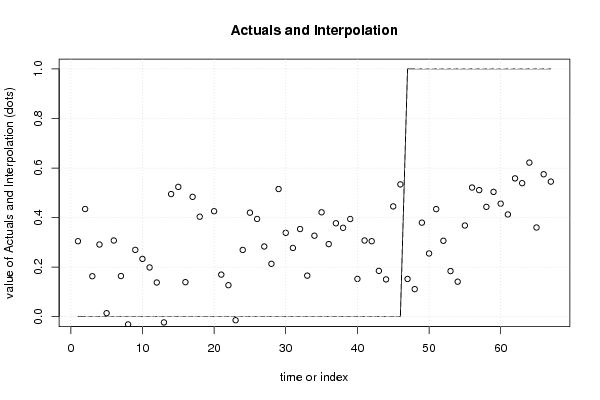
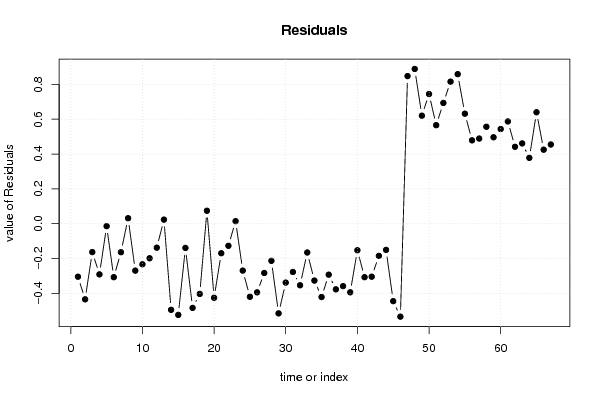
Multiple Linear Regression - Actuals, Interpolation, and Residuals
Time or IndexActualsInterpolationForecastResidualsPrediction Error
100.304649529137591-0.304649529137591
200.434526179679272-0.434526179679272
300.16319996323934-0.16319996323934
400.291182445571818-0.291182445571818
500.014103813870844-0.014103813870844
600.307402735390481-0.307402735390481
700.163928540317066-0.163928540317066
80-0.0313859293602290.031385929360229
900.269573918870239-0.269573918870239
1000.233204030068437-0.233204030068437
1100.198617298599139-0.198617298599139
1200.137882706045906-0.137882706045906
130-0.02331638347525010.0233163834752501
1400.494835020461641-0.494835020461641
1500.52389773378604-0.52389773378604
1600.139186835788981-0.139186835788981
1700.483633888872311-0.483633888872311
1800.403443219050934-0.403443219050934
190-0.07433246195082830.0743324619508283
2000.425662644989224-0.425662644989224
2100.16969830201511-0.16969830201511
2200.126960787731487-0.126960787731487
230-0.01444517250893170.0144451725089317
2400.269310679838711-0.269310679838711
2500.419827691885311-0.419827691885311
2600.394362264800188-0.394362264800188
2700.28315034991046-0.28315034991046
2800.213288660027567-0.213288660027567
2900.515172084010234-0.515172084010234
3000.338411921918395-0.338411921918395
3100.277410614487755-0.277410614487755
3200.353722940344805-0.353722940344805
3300.165545346575629-0.165545346575629
3400.326827414189666-0.326827414189666
3500.42133243868164-0.42133243868164
3600.292855750773897-0.292855750773897
3700.376937515678036-0.376937515678036
3800.358602699299024-0.358602699299024
3900.394182728838992-0.394182728838992
4000.152478985586258-0.152478985586258
4100.307449713214643-0.307449713214643
4200.304577347159322-0.304577347159322
4300.184871687855265-0.184871687855265
4400.150371559366107-0.150371559366107
4500.445060631191698-0.445060631191698
4600.534019145372452-0.534019145372452
4710.1521715973602790.847828402639721
4810.1111152848764810.888884715123519
4910.3794957556559070.620504244344093
5010.2550596012366850.744940398763315
5110.434141392465610.56585860753439
5210.3063970486901040.693602951309896
5310.1840210579394280.815978942060572
5410.1411236712312190.858876328768781
5510.3680044077108960.631995592289104
5610.5211979131195130.478802086880487
5710.5109562542644910.489043745735509
5810.4432479911204720.556752008879528
5910.5036643993331140.496335600666886
6010.4562531412058310.543746858794169
6110.412518742844920.58748125715508
6210.5581653032163660.441834696783634
6310.5388488131453560.461151186854644
6410.6218832018144640.378116798185536
6510.3598683626323960.640131637367604
6610.5748865757353480.425113424264652
6710.5450996672044470.454900332795553

\begin{tabular}{lllllllll}
\hline
Multiple Linear Regression - Actuals, Interpolation, and Residuals \tabularnewline
Time or Index & Actuals & InterpolationForecast & ResidualsPrediction Error \tabularnewline
1 & 0 & 0.304649529137591 & -0.304649529137591 \tabularnewline
2 & 0 & 0.434526179679272 & -0.434526179679272 \tabularnewline
3 & 0 & 0.16319996323934 & -0.16319996323934 \tabularnewline
4 & 0 & 0.291182445571818 & -0.291182445571818 \tabularnewline
5 & 0 & 0.014103813870844 & -0.014103813870844 \tabularnewline
6 & 0 & 0.307402735390481 & -0.307402735390481 \tabularnewline
7 & 0 & 0.163928540317066 & -0.163928540317066 \tabularnewline
8 & 0 & -0.031385929360229 & 0.031385929360229 \tabularnewline
9 & 0 & 0.269573918870239 & -0.269573918870239 \tabularnewline
10 & 0 & 0.233204030068437 & -0.233204030068437 \tabularnewline
11 & 0 & 0.198617298599139 & -0.198617298599139 \tabularnewline
12 & 0 & 0.137882706045906 & -0.137882706045906 \tabularnewline
13 & 0 & -0.0233163834752501 & 0.0233163834752501 \tabularnewline
14 & 0 & 0.494835020461641 & -0.494835020461641 \tabularnewline
15 & 0 & 0.52389773378604 & -0.52389773378604 \tabularnewline
16 & 0 & 0.139186835788981 & -0.139186835788981 \tabularnewline
17 & 0 & 0.483633888872311 & -0.483633888872311 \tabularnewline
18 & 0 & 0.403443219050934 & -0.403443219050934 \tabularnewline
19 & 0 & -0.0743324619508283 & 0.0743324619508283 \tabularnewline
20 & 0 & 0.425662644989224 & -0.425662644989224 \tabularnewline
21 & 0 & 0.16969830201511 & -0.16969830201511 \tabularnewline
22 & 0 & 0.126960787731487 & -0.126960787731487 \tabularnewline
23 & 0 & -0.0144451725089317 & 0.0144451725089317 \tabularnewline
24 & 0 & 0.269310679838711 & -0.269310679838711 \tabularnewline
25 & 0 & 0.419827691885311 & -0.419827691885311 \tabularnewline
26 & 0 & 0.394362264800188 & -0.394362264800188 \tabularnewline
27 & 0 & 0.28315034991046 & -0.28315034991046 \tabularnewline
28 & 0 & 0.213288660027567 & -0.213288660027567 \tabularnewline
29 & 0 & 0.515172084010234 & -0.515172084010234 \tabularnewline
30 & 0 & 0.338411921918395 & -0.338411921918395 \tabularnewline
31 & 0 & 0.277410614487755 & -0.277410614487755 \tabularnewline
32 & 0 & 0.353722940344805 & -0.353722940344805 \tabularnewline
33 & 0 & 0.165545346575629 & -0.165545346575629 \tabularnewline
34 & 0 & 0.326827414189666 & -0.326827414189666 \tabularnewline
35 & 0 & 0.42133243868164 & -0.42133243868164 \tabularnewline
36 & 0 & 0.292855750773897 & -0.292855750773897 \tabularnewline
37 & 0 & 0.376937515678036 & -0.376937515678036 \tabularnewline
38 & 0 & 0.358602699299024 & -0.358602699299024 \tabularnewline
39 & 0 & 0.394182728838992 & -0.394182728838992 \tabularnewline
40 & 0 & 0.152478985586258 & -0.152478985586258 \tabularnewline
41 & 0 & 0.307449713214643 & -0.307449713214643 \tabularnewline
42 & 0 & 0.304577347159322 & -0.304577347159322 \tabularnewline
43 & 0 & 0.184871687855265 & -0.184871687855265 \tabularnewline
44 & 0 & 0.150371559366107 & -0.150371559366107 \tabularnewline
45 & 0 & 0.445060631191698 & -0.445060631191698 \tabularnewline
46 & 0 & 0.534019145372452 & -0.534019145372452 \tabularnewline
47 & 1 & 0.152171597360279 & 0.847828402639721 \tabularnewline
48 & 1 & 0.111115284876481 & 0.888884715123519 \tabularnewline
49 & 1 & 0.379495755655907 & 0.620504244344093 \tabularnewline
50 & 1 & 0.255059601236685 & 0.744940398763315 \tabularnewline
51 & 1 & 0.43414139246561 & 0.56585860753439 \tabularnewline
52 & 1 & 0.306397048690104 & 0.693602951309896 \tabularnewline
53 & 1 & 0.184021057939428 & 0.815978942060572 \tabularnewline
54 & 1 & 0.141123671231219 & 0.858876328768781 \tabularnewline
55 & 1 & 0.368004407710896 & 0.631995592289104 \tabularnewline
56 & 1 & 0.521197913119513 & 0.478802086880487 \tabularnewline
57 & 1 & 0.510956254264491 & 0.489043745735509 \tabularnewline
58 & 1 & 0.443247991120472 & 0.556752008879528 \tabularnewline
59 & 1 & 0.503664399333114 & 0.496335600666886 \tabularnewline
60 & 1 & 0.456253141205831 & 0.543746858794169 \tabularnewline
61 & 1 & 0.41251874284492 & 0.58748125715508 \tabularnewline
62 & 1 & 0.558165303216366 & 0.441834696783634 \tabularnewline
63 & 1 & 0.538848813145356 & 0.461151186854644 \tabularnewline
64 & 1 & 0.621883201814464 & 0.378116798185536 \tabularnewline
65 & 1 & 0.359868362632396 & 0.640131637367604 \tabularnewline
66 & 1 & 0.574886575735348 & 0.425113424264652 \tabularnewline
67 & 1 & 0.545099667204447 & 0.454900332795553 \tabularnewline
\hline
\end{tabular}
%Source: https://freestatistics.org/blog/index.php?pk=153800&T=4

[TABLE]
[ROW][C]Multiple Linear Regression - Actuals, Interpolation, and Residuals[/C][/ROW]
[ROW][C]Time or Index[/C][C]Actuals[/C][C]InterpolationForecast[/C][C]ResidualsPrediction Error[/C][/ROW]
[ROW][C]1[/C][C]0[/C][C]0.304649529137591[/C][C]-0.304649529137591[/C][/ROW]
[ROW][C]2[/C][C]0[/C][C]0.434526179679272[/C][C]-0.434526179679272[/C][/ROW]
[ROW][C]3[/C][C]0[/C][C]0.16319996323934[/C][C]-0.16319996323934[/C][/ROW]
[ROW][C]4[/C][C]0[/C][C]0.291182445571818[/C][C]-0.291182445571818[/C][/ROW]
[ROW][C]5[/C][C]0[/C][C]0.014103813870844[/C][C]-0.014103813870844[/C][/ROW]
[ROW][C]6[/C][C]0[/C][C]0.307402735390481[/C][C]-0.307402735390481[/C][/ROW]
[ROW][C]7[/C][C]0[/C][C]0.163928540317066[/C][C]-0.163928540317066[/C][/ROW]
[ROW][C]8[/C][C]0[/C][C]-0.031385929360229[/C][C]0.031385929360229[/C][/ROW]
[ROW][C]9[/C][C]0[/C][C]0.269573918870239[/C][C]-0.269573918870239[/C][/ROW]
[ROW][C]10[/C][C]0[/C][C]0.233204030068437[/C][C]-0.233204030068437[/C][/ROW]
[ROW][C]11[/C][C]0[/C][C]0.198617298599139[/C][C]-0.198617298599139[/C][/ROW]
[ROW][C]12[/C][C]0[/C][C]0.137882706045906[/C][C]-0.137882706045906[/C][/ROW]
[ROW][C]13[/C][C]0[/C][C]-0.0233163834752501[/C][C]0.0233163834752501[/C][/ROW]
[ROW][C]14[/C][C]0[/C][C]0.494835020461641[/C][C]-0.494835020461641[/C][/ROW]
[ROW][C]15[/C][C]0[/C][C]0.52389773378604[/C][C]-0.52389773378604[/C][/ROW]
[ROW][C]16[/C][C]0[/C][C]0.139186835788981[/C][C]-0.139186835788981[/C][/ROW]
[ROW][C]17[/C][C]0[/C][C]0.483633888872311[/C][C]-0.483633888872311[/C][/ROW]
[ROW][C]18[/C][C]0[/C][C]0.403443219050934[/C][C]-0.403443219050934[/C][/ROW]
[ROW][C]19[/C][C]0[/C][C]-0.0743324619508283[/C][C]0.0743324619508283[/C][/ROW]
[ROW][C]20[/C][C]0[/C][C]0.425662644989224[/C][C]-0.425662644989224[/C][/ROW]
[ROW][C]21[/C][C]0[/C][C]0.16969830201511[/C][C]-0.16969830201511[/C][/ROW]
[ROW][C]22[/C][C]0[/C][C]0.126960787731487[/C][C]-0.126960787731487[/C][/ROW]
[ROW][C]23[/C][C]0[/C][C]-0.0144451725089317[/C][C]0.0144451725089317[/C][/ROW]
[ROW][C]24[/C][C]0[/C][C]0.269310679838711[/C][C]-0.269310679838711[/C][/ROW]
[ROW][C]25[/C][C]0[/C][C]0.419827691885311[/C][C]-0.419827691885311[/C][/ROW]
[ROW][C]26[/C][C]0[/C][C]0.394362264800188[/C][C]-0.394362264800188[/C][/ROW]
[ROW][C]27[/C][C]0[/C][C]0.28315034991046[/C][C]-0.28315034991046[/C][/ROW]
[ROW][C]28[/C][C]0[/C][C]0.213288660027567[/C][C]-0.213288660027567[/C][/ROW]
[ROW][C]29[/C][C]0[/C][C]0.515172084010234[/C][C]-0.515172084010234[/C][/ROW]
[ROW][C]30[/C][C]0[/C][C]0.338411921918395[/C][C]-0.338411921918395[/C][/ROW]
[ROW][C]31[/C][C]0[/C][C]0.277410614487755[/C][C]-0.277410614487755[/C][/ROW]
[ROW][C]32[/C][C]0[/C][C]0.353722940344805[/C][C]-0.353722940344805[/C][/ROW]
[ROW][C]33[/C][C]0[/C][C]0.165545346575629[/C][C]-0.165545346575629[/C][/ROW]
[ROW][C]34[/C][C]0[/C][C]0.326827414189666[/C][C]-0.326827414189666[/C][/ROW]
[ROW][C]35[/C][C]0[/C][C]0.42133243868164[/C][C]-0.42133243868164[/C][/ROW]
[ROW][C]36[/C][C]0[/C][C]0.292855750773897[/C][C]-0.292855750773897[/C][/ROW]
[ROW][C]37[/C][C]0[/C][C]0.376937515678036[/C][C]-0.376937515678036[/C][/ROW]
[ROW][C]38[/C][C]0[/C][C]0.358602699299024[/C][C]-0.358602699299024[/C][/ROW]
[ROW][C]39[/C][C]0[/C][C]0.394182728838992[/C][C]-0.394182728838992[/C][/ROW]
[ROW][C]40[/C][C]0[/C][C]0.152478985586258[/C][C]-0.152478985586258[/C][/ROW]
[ROW][C]41[/C][C]0[/C][C]0.307449713214643[/C][C]-0.307449713214643[/C][/ROW]
[ROW][C]42[/C][C]0[/C][C]0.304577347159322[/C][C]-0.304577347159322[/C][/ROW]
[ROW][C]43[/C][C]0[/C][C]0.184871687855265[/C][C]-0.184871687855265[/C][/ROW]
[ROW][C]44[/C][C]0[/C][C]0.150371559366107[/C][C]-0.150371559366107[/C][/ROW]
[ROW][C]45[/C][C]0[/C][C]0.445060631191698[/C][C]-0.445060631191698[/C][/ROW]
[ROW][C]46[/C][C]0[/C][C]0.534019145372452[/C][C]-0.534019145372452[/C][/ROW]
[ROW][C]47[/C][C]1[/C][C]0.152171597360279[/C][C]0.847828402639721[/C][/ROW]
[ROW][C]48[/C][C]1[/C][C]0.111115284876481[/C][C]0.888884715123519[/C][/ROW]
[ROW][C]49[/C][C]1[/C][C]0.379495755655907[/C][C]0.620504244344093[/C][/ROW]
[ROW][C]50[/C][C]1[/C][C]0.255059601236685[/C][C]0.744940398763315[/C][/ROW]
[ROW][C]51[/C][C]1[/C][C]0.43414139246561[/C][C]0.56585860753439[/C][/ROW]
[ROW][C]52[/C][C]1[/C][C]0.306397048690104[/C][C]0.693602951309896[/C][/ROW]
[ROW][C]53[/C][C]1[/C][C]0.184021057939428[/C][C]0.815978942060572[/C][/ROW]
[ROW][C]54[/C][C]1[/C][C]0.141123671231219[/C][C]0.858876328768781[/C][/ROW]
[ROW][C]55[/C][C]1[/C][C]0.368004407710896[/C][C]0.631995592289104[/C][/ROW]
[ROW][C]56[/C][C]1[/C][C]0.521197913119513[/C][C]0.478802086880487[/C][/ROW]
[ROW][C]57[/C][C]1[/C][C]0.510956254264491[/C][C]0.489043745735509[/C][/ROW]
[ROW][C]58[/C][C]1[/C][C]0.443247991120472[/C][C]0.556752008879528[/C][/ROW]
[ROW][C]59[/C][C]1[/C][C]0.503664399333114[/C][C]0.496335600666886[/C][/ROW]
[ROW][C]60[/C][C]1[/C][C]0.456253141205831[/C][C]0.543746858794169[/C][/ROW]
[ROW][C]61[/C][C]1[/C][C]0.41251874284492[/C][C]0.58748125715508[/C][/ROW]
[ROW][C]62[/C][C]1[/C][C]0.558165303216366[/C][C]0.441834696783634[/C][/ROW]
[ROW][C]63[/C][C]1[/C][C]0.538848813145356[/C][C]0.461151186854644[/C][/ROW]
[ROW][C]64[/C][C]1[/C][C]0.621883201814464[/C][C]0.378116798185536[/C][/ROW]
[ROW][C]65[/C][C]1[/C][C]0.359868362632396[/C][C]0.640131637367604[/C][/ROW]
[ROW][C]66[/C][C]1[/C][C]0.574886575735348[/C][C]0.425113424264652[/C][/ROW]
[ROW][C]67[/C][C]1[/C][C]0.545099667204447[/C][C]0.454900332795553[/C][/ROW]
[/TABLE]
Source: https://freestatistics.org/blog/index.php?pk=153800&T=4

Globally Unique Identifier (entire table): ba.freestatistics.org/blog/index.php?pk=153800&T=4

As an alternative you can also use a QR Code:  

The GUIDs for individual cells are displayed in the table below:

Multiple Linear Regression - Actuals, Interpolation, and Residuals
Time or IndexActualsInterpolationForecastResidualsPrediction Error
100.304649529137591-0.304649529137591
200.434526179679272-0.434526179679272
300.16319996323934-0.16319996323934
400.291182445571818-0.291182445571818
500.014103813870844-0.014103813870844
600.307402735390481-0.307402735390481
700.163928540317066-0.163928540317066
80-0.0313859293602290.031385929360229
900.269573918870239-0.269573918870239
1000.233204030068437-0.233204030068437
1100.198617298599139-0.198617298599139
1200.137882706045906-0.137882706045906
130-0.02331638347525010.0233163834752501
1400.494835020461641-0.494835020461641
1500.52389773378604-0.52389773378604
1600.139186835788981-0.139186835788981
1700.483633888872311-0.483633888872311
1800.403443219050934-0.403443219050934
190-0.07433246195082830.0743324619508283
2000.425662644989224-0.425662644989224
2100.16969830201511-0.16969830201511
2200.126960787731487-0.126960787731487
230-0.01444517250893170.0144451725089317
2400.269310679838711-0.269310679838711
2500.419827691885311-0.419827691885311
2600.394362264800188-0.394362264800188
2700.28315034991046-0.28315034991046
2800.213288660027567-0.213288660027567
2900.515172084010234-0.515172084010234
3000.338411921918395-0.338411921918395
3100.277410614487755-0.277410614487755
3200.353722940344805-0.353722940344805
3300.165545346575629-0.165545346575629
3400.326827414189666-0.326827414189666
3500.42133243868164-0.42133243868164
3600.292855750773897-0.292855750773897
3700.376937515678036-0.376937515678036
3800.358602699299024-0.358602699299024
3900.394182728838992-0.394182728838992
4000.152478985586258-0.152478985586258
4100.307449713214643-0.307449713214643
4200.304577347159322-0.304577347159322
4300.184871687855265-0.184871687855265
4400.150371559366107-0.150371559366107
4500.445060631191698-0.445060631191698
4600.534019145372452-0.534019145372452
4710.1521715973602790.847828402639721
4810.1111152848764810.888884715123519
4910.3794957556559070.620504244344093
5010.2550596012366850.744940398763315
5110.434141392465610.56585860753439
5210.3063970486901040.693602951309896
5310.1840210579394280.815978942060572
5410.1411236712312190.858876328768781
5510.3680044077108960.631995592289104
5610.5211979131195130.478802086880487
5710.5109562542644910.489043745735509
5810.4432479911204720.556752008879528
5910.5036643993331140.496335600666886
6010.4562531412058310.543746858794169
6110.412518742844920.58748125715508
6210.5581653032163660.441834696783634
6310.5388488131453560.461151186854644
6410.6218832018144640.378116798185536
6510.3598683626323960.640131637367604
6610.5748865757353480.425113424264652
6710.5450996672044470.454900332795553


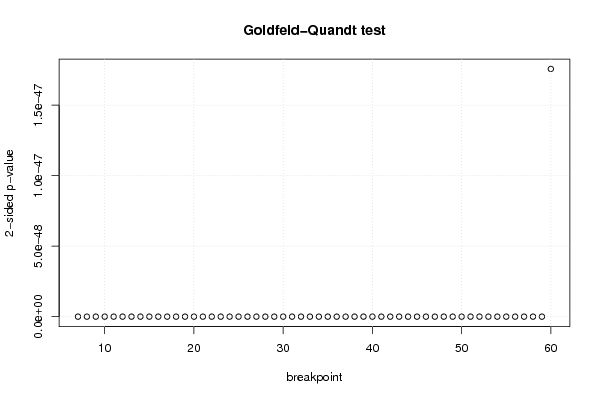
Goldfeld-Quandt test for Heteroskedasticity
p-valuesAlternative Hypothesis
breakpoint indexgreater2-sidedless
7001
8001
9001
10001
11001
12001
13001
14001
15001
16001
17001
18001
19001
20001
21001
22001
23001
24001
25001
26001
27001
28001
29001
30001
31001
32001
33001
34001
35001
36001
37001
38001
39001
40001
41001
42001
43001
44001
45001
46001
4712.68409946657104e-2511.34204973328552e-251
4811.70357679063378e-2258.51788395316891e-226
4911.11517644414876e-2135.57588222074378e-214
5019.24975957152756e-2124.62487978576378e-212
51100
5215.98053752533559e-1692.99026876266779e-169
5311.3142558267257e-1546.5712791336285e-155
5411.40634185944566e-1577.03170929722828e-158
5515.47501814664106e-1232.73750907332053e-123
5611.77302611002525e-1158.86513055012626e-116
5718.51646375865457e-954.25823187932728e-95
5816.35999335501763e-793.17999667750882e-79
5913.43567286477708e-621.71783643238854e-62
6011.75674689453397e-478.78373447266983e-48

\begin{tabular}{lllllllll}
\hline
Goldfeld-Quandt test for Heteroskedasticity \tabularnewline
p-values & Alternative Hypothesis \tabularnewline
breakpoint index & greater & 2-sided & less \tabularnewline
7 & 0 & 0 & 1 \tabularnewline
8 & 0 & 0 & 1 \tabularnewline
9 & 0 & 0 & 1 \tabularnewline
10 & 0 & 0 & 1 \tabularnewline
11 & 0 & 0 & 1 \tabularnewline
12 & 0 & 0 & 1 \tabularnewline
13 & 0 & 0 & 1 \tabularnewline
14 & 0 & 0 & 1 \tabularnewline
15 & 0 & 0 & 1 \tabularnewline
16 & 0 & 0 & 1 \tabularnewline
17 & 0 & 0 & 1 \tabularnewline
18 & 0 & 0 & 1 \tabularnewline
19 & 0 & 0 & 1 \tabularnewline
20 & 0 & 0 & 1 \tabularnewline
21 & 0 & 0 & 1 \tabularnewline
22 & 0 & 0 & 1 \tabularnewline
23 & 0 & 0 & 1 \tabularnewline
24 & 0 & 0 & 1 \tabularnewline
25 & 0 & 0 & 1 \tabularnewline
26 & 0 & 0 & 1 \tabularnewline
27 & 0 & 0 & 1 \tabularnewline
28 & 0 & 0 & 1 \tabularnewline
29 & 0 & 0 & 1 \tabularnewline
30 & 0 & 0 & 1 \tabularnewline
31 & 0 & 0 & 1 \tabularnewline
32 & 0 & 0 & 1 \tabularnewline
33 & 0 & 0 & 1 \tabularnewline
34 & 0 & 0 & 1 \tabularnewline
35 & 0 & 0 & 1 \tabularnewline
36 & 0 & 0 & 1 \tabularnewline
37 & 0 & 0 & 1 \tabularnewline
38 & 0 & 0 & 1 \tabularnewline
39 & 0 & 0 & 1 \tabularnewline
40 & 0 & 0 & 1 \tabularnewline
41 & 0 & 0 & 1 \tabularnewline
42 & 0 & 0 & 1 \tabularnewline
43 & 0 & 0 & 1 \tabularnewline
44 & 0 & 0 & 1 \tabularnewline
45 & 0 & 0 & 1 \tabularnewline
46 & 0 & 0 & 1 \tabularnewline
47 & 1 & 2.68409946657104e-251 & 1.34204973328552e-251 \tabularnewline
48 & 1 & 1.70357679063378e-225 & 8.51788395316891e-226 \tabularnewline
49 & 1 & 1.11517644414876e-213 & 5.57588222074378e-214 \tabularnewline
50 & 1 & 9.24975957152756e-212 & 4.62487978576378e-212 \tabularnewline
51 & 1 & 0 & 0 \tabularnewline
52 & 1 & 5.98053752533559e-169 & 2.99026876266779e-169 \tabularnewline
53 & 1 & 1.3142558267257e-154 & 6.5712791336285e-155 \tabularnewline
54 & 1 & 1.40634185944566e-157 & 7.03170929722828e-158 \tabularnewline
55 & 1 & 5.47501814664106e-123 & 2.73750907332053e-123 \tabularnewline
56 & 1 & 1.77302611002525e-115 & 8.86513055012626e-116 \tabularnewline
57 & 1 & 8.51646375865457e-95 & 4.25823187932728e-95 \tabularnewline
58 & 1 & 6.35999335501763e-79 & 3.17999667750882e-79 \tabularnewline
59 & 1 & 3.43567286477708e-62 & 1.71783643238854e-62 \tabularnewline
60 & 1 & 1.75674689453397e-47 & 8.78373447266983e-48 \tabularnewline
\hline
\end{tabular}
%Source: https://freestatistics.org/blog/index.php?pk=153800&T=5

[TABLE]
[ROW][C]Goldfeld-Quandt test for Heteroskedasticity[/C][/ROW]
[ROW][C]p-values[/C][C]Alternative Hypothesis[/C][/ROW]
[ROW][C]breakpoint index[/C][C]greater[/C][C]2-sided[/C][C]less[/C][/ROW]
[ROW][C]7[/C][C]0[/C][C]0[/C][C]1[/C][/ROW]
[ROW][C]8[/C][C]0[/C][C]0[/C][C]1[/C][/ROW]
[ROW][C]9[/C][C]0[/C][C]0[/C][C]1[/C][/ROW]
[ROW][C]10[/C][C]0[/C][C]0[/C][C]1[/C][/ROW]
[ROW][C]11[/C][C]0[/C][C]0[/C][C]1[/C][/ROW]
[ROW][C]12[/C][C]0[/C][C]0[/C][C]1[/C][/ROW]
[ROW][C]13[/C][C]0[/C][C]0[/C][C]1[/C][/ROW]
[ROW][C]14[/C][C]0[/C][C]0[/C][C]1[/C][/ROW]
[ROW][C]15[/C][C]0[/C][C]0[/C][C]1[/C][/ROW]
[ROW][C]16[/C][C]0[/C][C]0[/C][C]1[/C][/ROW]
[ROW][C]17[/C][C]0[/C][C]0[/C][C]1[/C][/ROW]
[ROW][C]18[/C][C]0[/C][C]0[/C][C]1[/C][/ROW]
[ROW][C]19[/C][C]0[/C][C]0[/C][C]1[/C][/ROW]
[ROW][C]20[/C][C]0[/C][C]0[/C][C]1[/C][/ROW]
[ROW][C]21[/C][C]0[/C][C]0[/C][C]1[/C][/ROW]
[ROW][C]22[/C][C]0[/C][C]0[/C][C]1[/C][/ROW]
[ROW][C]23[/C][C]0[/C][C]0[/C][C]1[/C][/ROW]
[ROW][C]24[/C][C]0[/C][C]0[/C][C]1[/C][/ROW]
[ROW][C]25[/C][C]0[/C][C]0[/C][C]1[/C][/ROW]
[ROW][C]26[/C][C]0[/C][C]0[/C][C]1[/C][/ROW]
[ROW][C]27[/C][C]0[/C][C]0[/C][C]1[/C][/ROW]
[ROW][C]28[/C][C]0[/C][C]0[/C][C]1[/C][/ROW]
[ROW][C]29[/C][C]0[/C][C]0[/C][C]1[/C][/ROW]
[ROW][C]30[/C][C]0[/C][C]0[/C][C]1[/C][/ROW]
[ROW][C]31[/C][C]0[/C][C]0[/C][C]1[/C][/ROW]
[ROW][C]32[/C][C]0[/C][C]0[/C][C]1[/C][/ROW]
[ROW][C]33[/C][C]0[/C][C]0[/C][C]1[/C][/ROW]
[ROW][C]34[/C][C]0[/C][C]0[/C][C]1[/C][/ROW]
[ROW][C]35[/C][C]0[/C][C]0[/C][C]1[/C][/ROW]
[ROW][C]36[/C][C]0[/C][C]0[/C][C]1[/C][/ROW]
[ROW][C]37[/C][C]0[/C][C]0[/C][C]1[/C][/ROW]
[ROW][C]38[/C][C]0[/C][C]0[/C][C]1[/C][/ROW]
[ROW][C]39[/C][C]0[/C][C]0[/C][C]1[/C][/ROW]
[ROW][C]40[/C][C]0[/C][C]0[/C][C]1[/C][/ROW]
[ROW][C]41[/C][C]0[/C][C]0[/C][C]1[/C][/ROW]
[ROW][C]42[/C][C]0[/C][C]0[/C][C]1[/C][/ROW]
[ROW][C]43[/C][C]0[/C][C]0[/C][C]1[/C][/ROW]
[ROW][C]44[/C][C]0[/C][C]0[/C][C]1[/C][/ROW]
[ROW][C]45[/C][C]0[/C][C]0[/C][C]1[/C][/ROW]
[ROW][C]46[/C][C]0[/C][C]0[/C][C]1[/C][/ROW]
[ROW][C]47[/C][C]1[/C][C]2.68409946657104e-251[/C][C]1.34204973328552e-251[/C][/ROW]
[ROW][C]48[/C][C]1[/C][C]1.70357679063378e-225[/C][C]8.51788395316891e-226[/C][/ROW]
[ROW][C]49[/C][C]1[/C][C]1.11517644414876e-213[/C][C]5.57588222074378e-214[/C][/ROW]
[ROW][C]50[/C][C]1[/C][C]9.24975957152756e-212[/C][C]4.62487978576378e-212[/C][/ROW]
[ROW][C]51[/C][C]1[/C][C]0[/C][C]0[/C][/ROW]
[ROW][C]52[/C][C]1[/C][C]5.98053752533559e-169[/C][C]2.99026876266779e-169[/C][/ROW]
[ROW][C]53[/C][C]1[/C][C]1.3142558267257e-154[/C][C]6.5712791336285e-155[/C][/ROW]
[ROW][C]54[/C][C]1[/C][C]1.40634185944566e-157[/C][C]7.03170929722828e-158[/C][/ROW]
[ROW][C]55[/C][C]1[/C][C]5.47501814664106e-123[/C][C]2.73750907332053e-123[/C][/ROW]
[ROW][C]56[/C][C]1[/C][C]1.77302611002525e-115[/C][C]8.86513055012626e-116[/C][/ROW]
[ROW][C]57[/C][C]1[/C][C]8.51646375865457e-95[/C][C]4.25823187932728e-95[/C][/ROW]
[ROW][C]58[/C][C]1[/C][C]6.35999335501763e-79[/C][C]3.17999667750882e-79[/C][/ROW]
[ROW][C]59[/C][C]1[/C][C]3.43567286477708e-62[/C][C]1.71783643238854e-62[/C][/ROW]
[ROW][C]60[/C][C]1[/C][C]1.75674689453397e-47[/C][C]8.78373447266983e-48[/C][/ROW]
[/TABLE]
Source: https://freestatistics.org/blog/index.php?pk=153800&T=5

Globally Unique Identifier (entire table): ba.freestatistics.org/blog/index.php?pk=153800&T=5

As an alternative you can also use a QR Code:  

The GUIDs for individual cells are displayed in the table below:

Goldfeld-Quandt test for Heteroskedasticity
p-valuesAlternative Hypothesis
breakpoint indexgreater2-sidedless
7001
8001
9001
10001
11001
12001
13001
14001
15001
16001
17001
18001
19001
20001
21001
22001
23001
24001
25001
26001
27001
28001
29001
30001
31001
32001
33001
34001
35001
36001
37001
38001
39001
40001
41001
42001
43001
44001
45001
46001
4712.68409946657104e-2511.34204973328552e-251
4811.70357679063378e-2258.51788395316891e-226
4911.11517644414876e-2135.57588222074378e-214
5019.24975957152756e-2124.62487978576378e-212
51100
5215.98053752533559e-1692.99026876266779e-169
5311.3142558267257e-1546.5712791336285e-155
5411.40634185944566e-1577.03170929722828e-158
5515.47501814664106e-1232.73750907332053e-123
5611.77302611002525e-1158.86513055012626e-116
5718.51646375865457e-954.25823187932728e-95
5816.35999335501763e-793.17999667750882e-79
5913.43567286477708e-621.71783643238854e-62
6011.75674689453397e-478.78373447266983e-48


Meta Analysis of Goldfeld-Quandt test for Heteroskedasticity
Description# significant tests% significant testsOK/NOK
1% type I error level541NOK
5% type I error level541NOK
10% type I error level541NOK

\begin{tabular}{lllllllll}
\hline
Meta Analysis of Goldfeld-Quandt test for Heteroskedasticity \tabularnewline
Description & # significant tests & % significant tests & OK/NOK \tabularnewline
1% type I error level & 54 & 1 & NOK \tabularnewline
5% type I error level & 54 & 1 & NOK \tabularnewline
10% type I error level & 54 & 1 & NOK \tabularnewline
\hline
\end{tabular}
%Source: https://freestatistics.org/blog/index.php?pk=153800&T=6

[TABLE]
[ROW][C]Meta Analysis of Goldfeld-Quandt test for Heteroskedasticity[/C][/ROW]
[ROW][C]Description[/C][C]# significant tests[/C][C]% significant tests[/C][C]OK/NOK[/C][/ROW]
[ROW][C]1% type I error level[/C][C]54[/C][C]1[/C][C]NOK[/C][/ROW]
[ROW][C]5% type I error level[/C][C]54[/C][C]1[/C][C]NOK[/C][/ROW]
[ROW][C]10% type I error level[/C][C]54[/C][C]1[/C][C]NOK[/C][/ROW]
[/TABLE]
Source: https://freestatistics.org/blog/index.php?pk=153800&T=6

Globally Unique Identifier (entire table): ba.freestatistics.org/blog/index.php?pk=153800&T=6

As an alternative you can also use a QR Code:  

The GUIDs for individual cells are displayed in the table below:

Meta Analysis of Goldfeld-Quandt test for Heteroskedasticity
Description# significant tests% significant testsOK/NOK
1% type I error level541NOK
5% type I error level541NOK
10% type I error level541NOK


Parameters (Session):
par1 = 4 ; par2 = Do not include Seasonal Dummies ; par3 = No Linear Trend ;
Parameters (R input):
par1 = 1 ; par2 = Do not include Seasonal Dummies ; par3 = No Linear Trend ;
R code (references can be found in the software module):
library(lattice)
library(lmtest)
n25 <- 25 #minimum number of obs. for Goldfeld-Quandt test
par1 <- as.numeric(par1)
x <- t(y)
k <- length(x[1,])
n <- length(x[,1])
x1 <- cbind(x[,par1], x[,1:k!=par1])
mycolnames <- c(colnames(x)[par1], colnames(x)[1:k!=par1])
colnames(x1) <- mycolnames #colnames(x)[par1]
x <- x1
if (par3 == 'First Differences'){
x2 <- array(0, dim=c(n-1,k), dimnames=list(1:(n-1), paste('(1-B)',colnames(x),sep='')))
for (i in 1:n-1) {
for (j in 1:k) {
x2[i,j] <- x[i+1,j] - x[i,j]
}
}
x <- x2
}
if (par2 == 'Include Monthly Dummies'){
x2 <- array(0, dim=c(n,11), dimnames=list(1:n, paste('M', seq(1:11), sep ='')))
for (i in 1:11){
x2[seq(i,n,12),i] <- 1
}
x <- cbind(x, x2)
}
if (par2 == 'Include Quarterly Dummies'){
x2 <- array(0, dim=c(n,3), dimnames=list(1:n, paste('Q', seq(1:3), sep ='')))
for (i in 1:3){
x2[seq(i,n,4),i] <- 1
}
x <- cbind(x, x2)
}
k <- length(x[1,])
if (par3 == 'Linear Trend'){
x <- cbind(x, c(1:n))
colnames(x)[k+1] <- 't'
}
x
k <- length(x[1,])
df <- as.data.frame(x)
(mylm <- lm(df))
(mysum <- summary(mylm))
if (n > n25) {
kp3 <- k + 3
nmkm3 <- n - k - 3
gqarr <- array(NA, dim=c(nmkm3-kp3+1,3))
numgqtests <- 0
numsignificant1 <- 0
numsignificant5 <- 0
numsignificant10 <- 0
for (mypoint in kp3:nmkm3) {
j <- 0
numgqtests <- numgqtests + 1
for (myalt in c('greater', 'two.sided', 'less')) {
j <- j + 1
gqarr[mypoint-kp3+1,j] <- gqtest(mylm, point=mypoint, alternative=myalt)$p.value
}
if (gqarr[mypoint-kp3+1,2] < 0.01) numsignificant1 <- numsignificant1 + 1
if (gqarr[mypoint-kp3+1,2] < 0.05) numsignificant5 <- numsignificant5 + 1
if (gqarr[mypoint-kp3+1,2] < 0.10) numsignificant10 <- numsignificant10 + 1
}
gqarr
}
bitmap(file='test0.png')
plot(x[,1], type='l', main='Actuals and Interpolation', ylab='value of Actuals and Interpolation (dots)', xlab='time or index')
points(x[,1]-mysum$resid)
grid()
dev.off()
bitmap(file='test1.png')
plot(mysum$resid, type='b', pch=19, main='Residuals', ylab='value of Residuals', xlab='time or index')
grid()
dev.off()
bitmap(file='test2.png')
hist(mysum$resid, main='Residual Histogram', xlab='values of Residuals')
grid()
dev.off()
bitmap(file='test3.png')
densityplot(~mysum$resid,col='black',main='Residual Density Plot', xlab='values of Residuals')
dev.off()
bitmap(file='test4.png')
qqnorm(mysum$resid, main='Residual Normal Q-Q Plot')
qqline(mysum$resid)
grid()
dev.off()
(myerror <- as.ts(mysum$resid))
bitmap(file='test5.png')
dum <- cbind(lag(myerror,k=1),myerror)
dum
dum1 <- dum[2:length(myerror),]
dum1
z <- as.data.frame(dum1)
z
plot(z,main=paste('Residual Lag plot, lowess, and regression line'), ylab='values of Residuals', xlab='lagged values of Residuals')
lines(lowess(z))
abline(lm(z))
grid()
dev.off()
bitmap(file='test6.png')
acf(mysum$resid, lag.max=length(mysum$resid)/2, main='Residual Autocorrelation Function')
grid()
dev.off()
bitmap(file='test7.png')
pacf(mysum$resid, lag.max=length(mysum$resid)/2, main='Residual Partial Autocorrelation Function')
grid()
dev.off()
bitmap(file='test8.png')
opar <- par(mfrow = c(2,2), oma = c(0, 0, 1.1, 0))
plot(mylm, las = 1, sub='Residual Diagnostics')
par(opar)
dev.off()
if (n > n25) {
bitmap(file='test9.png')
plot(kp3:nmkm3,gqarr[,2], main='Goldfeld-Quandt test',ylab='2-sided p-value',xlab='breakpoint')
grid()
dev.off()
}
load(file='createtable')
a<-table.start()
a<-table.row.start(a)
a<-table.element(a, 'Multiple Linear Regression - Estimated Regression Equation', 1, TRUE)
a<-table.row.end(a)
myeq <- colnames(x)[1]
myeq <- paste(myeq, '[t] = ', sep='')
for (i in 1:k){
if (mysum$coefficients[i,1] > 0) myeq <- paste(myeq, '+', '')
myeq <- paste(myeq, mysum$coefficients[i,1], sep=' ')
if (rownames(mysum$coefficients)[i] != '(Intercept)') {
myeq <- paste(myeq, rownames(mysum$coefficients)[i], sep='')
if (rownames(mysum$coefficients)[i] != 't') myeq <- paste(myeq, '[t]', sep='')
}
}
myeq <- paste(myeq, ' + e[t]')
a<-table.row.start(a)
a<-table.element(a, myeq)
a<-table.row.end(a)
a<-table.end(a)
table.save(a,file='mytable1.tab')
a<-table.start()
a<-table.row.start(a)
a<-table.element(a,hyperlink('ols1.htm','Multiple Linear Regression - Ordinary Least Squares',''), 6, TRUE)
a<-table.row.end(a)
a<-table.row.start(a)
a<-table.element(a,'Variable',header=TRUE)
a<-table.element(a,'Parameter',header=TRUE)
a<-table.element(a,'S.D.',header=TRUE)
a<-table.element(a,'T-STAT
H0: parameter = 0',header=TRUE)
a<-table.element(a,'2-tail p-value',header=TRUE)
a<-table.element(a,'1-tail p-value',header=TRUE)
a<-table.row.end(a)
for (i in 1:k){
a<-table.row.start(a)
a<-table.element(a,rownames(mysum$coefficients)[i],header=TRUE)
a<-table.element(a,mysum$coefficients[i,1])
a<-table.element(a, round(mysum$coefficients[i,2],6))
a<-table.element(a, round(mysum$coefficients[i,3],4))
a<-table.element(a, round(mysum$coefficients[i,4],6))
a<-table.element(a, round(mysum$coefficients[i,4]/2,6))
a<-table.row.end(a)
}
a<-table.end(a)
table.save(a,file='mytable2.tab')
a<-table.start()
a<-table.row.start(a)
a<-table.element(a, 'Multiple Linear Regression - Regression Statistics', 2, TRUE)
a<-table.row.end(a)
a<-table.row.start(a)
a<-table.element(a, 'Multiple R',1,TRUE)
a<-table.element(a, sqrt(mysum$r.squared))
a<-table.row.end(a)
a<-table.row.start(a)
a<-table.element(a, 'R-squared',1,TRUE)
a<-table.element(a, mysum$r.squared)
a<-table.row.end(a)
a<-table.row.start(a)
a<-table.element(a, 'Adjusted R-squared',1,TRUE)
a<-table.element(a, mysum$adj.r.squared)
a<-table.row.end(a)
a<-table.row.start(a)
a<-table.element(a, 'F-TEST (value)',1,TRUE)
a<-table.element(a, mysum$fstatistic[1])
a<-table.row.end(a)
a<-table.row.start(a)
a<-table.element(a, 'F-TEST (DF numerator)',1,TRUE)
a<-table.element(a, mysum$fstatistic[2])
a<-table.row.end(a)
a<-table.row.start(a)
a<-table.element(a, 'F-TEST (DF denominator)',1,TRUE)
a<-table.element(a, mysum$fstatistic[3])
a<-table.row.end(a)
a<-table.row.start(a)
a<-table.element(a, 'p-value',1,TRUE)
a<-table.element(a, 1-pf(mysum$fstatistic[1],mysum$fstatistic[2],mysum$fstatistic[3]))
a<-table.row.end(a)
a<-table.row.start(a)
a<-table.element(a, 'Multiple Linear Regression - Residual Statistics', 2, TRUE)
a<-table.row.end(a)
a<-table.row.start(a)
a<-table.element(a, 'Residual Standard Deviation',1,TRUE)
a<-table.element(a, mysum$sigma)
a<-table.row.end(a)
a<-table.row.start(a)
a<-table.element(a, 'Sum Squared Residuals',1,TRUE)
a<-table.element(a, sum(myerror*myerror))
a<-table.row.end(a)
a<-table.end(a)
table.save(a,file='mytable3.tab')
a<-table.start()
a<-table.row.start(a)
a<-table.element(a, 'Multiple Linear Regression - Actuals, Interpolation, and Residuals', 4, TRUE)
a<-table.row.end(a)
a<-table.row.start(a)
a<-table.element(a, 'Time or Index', 1, TRUE)
a<-table.element(a, 'Actuals', 1, TRUE)
a<-table.element(a, 'Interpolation
Forecast', 1, TRUE)
a<-table.element(a, 'Residuals
Prediction Error', 1, TRUE)
a<-table.row.end(a)
for (i in 1:n) {
a<-table.row.start(a)
a<-table.element(a,i, 1, TRUE)
a<-table.element(a,x[i])
a<-table.element(a,x[i]-mysum$resid[i])
a<-table.element(a,mysum$resid[i])
a<-table.row.end(a)
}
a<-table.end(a)
table.save(a,file='mytable4.tab')
if (n > n25) {
a<-table.start()
a<-table.row.start(a)
a<-table.element(a,'Goldfeld-Quandt test for Heteroskedasticity',4,TRUE)
a<-table.row.end(a)
a<-table.row.start(a)
a<-table.element(a,'p-values',header=TRUE)
a<-table.element(a,'Alternative Hypothesis',3,header=TRUE)
a<-table.row.end(a)
a<-table.row.start(a)
a<-table.element(a,'breakpoint index',header=TRUE)
a<-table.element(a,'greater',header=TRUE)
a<-table.element(a,'2-sided',header=TRUE)
a<-table.element(a,'less',header=TRUE)
a<-table.row.end(a)
for (mypoint in kp3:nmkm3) {
a<-table.row.start(a)
a<-table.element(a,mypoint,header=TRUE)
a<-table.element(a,gqarr[mypoint-kp3+1,1])
a<-table.element(a,gqarr[mypoint-kp3+1,2])
a<-table.element(a,gqarr[mypoint-kp3+1,3])
a<-table.row.end(a)
}
a<-table.end(a)
table.save(a,file='mytable5.tab')
a<-table.start()
a<-table.row.start(a)
a<-table.element(a,'Meta Analysis of Goldfeld-Quandt test for Heteroskedasticity',4,TRUE)
a<-table.row.end(a)
a<-table.row.start(a)
a<-table.element(a,'Description',header=TRUE)
a<-table.element(a,'# significant tests',header=TRUE)
a<-table.element(a,'% significant tests',header=TRUE)
a<-table.element(a,'OK/NOK',header=TRUE)
a<-table.row.end(a)
a<-table.row.start(a)
a<-table.element(a,'1% type I error level',header=TRUE)
a<-table.element(a,numsignificant1)
a<-table.element(a,numsignificant1/numgqtests)
if (numsignificant1/numgqtests < 0.01) dum <- 'OK' else dum <- 'NOK'
a<-table.element(a,dum)
a<-table.row.end(a)
a<-table.row.start(a)
a<-table.element(a,'5% type I error level',header=TRUE)
a<-table.element(a,numsignificant5)
a<-table.element(a,numsignificant5/numgqtests)
if (numsignificant5/numgqtests < 0.05) dum <- 'OK' else dum <- 'NOK'
a<-table.element(a,dum)
a<-table.row.end(a)
a<-table.row.start(a)
a<-table.element(a,'10% type I error level',header=TRUE)
a<-table.element(a,numsignificant10)
a<-table.element(a,numsignificant10/numgqtests)
if (numsignificant10/numgqtests < 0.1) dum <- 'OK' else dum <- 'NOK'
a<-table.element(a,dum)
a<-table.row.end(a)
a<-table.end(a)
table.save(a,file='mytable6.tab')
}