| Multiple Linear Regression - Estimated Regression Equation |
| total_tests[t] = + 0.264628007899176 -0.326978050387373pop[t] -3.75515496194193e-07time_in_rfc[t] + 0.489267280779002gender[t] + e[t] |
| Multiple Linear Regression - Ordinary Least Squares | |||||
| Variable | Parameter | S.D. | T-STAT H0: parameter = 0 | 2-tail p-value | 1-tail p-value |
| (Intercept) | 0.264628007899176 | 0.841174 | 0.3146 | 0.75411 | 0.377055 |
| pop | -0.326978050387373 | 0.648314 | -0.5044 | 0.615774 | 0.307887 |
| time_in_rfc | -3.75515496194193e-07 | 4e-06 | -0.1011 | 0.919811 | 0.459905 |
| gender | 0.489267280779002 | 0.5841 | 0.8376 | 0.405398 | 0.202699 |
| Multiple Linear Regression - Regression Statistics | |
| Multiple R | 0.133611514318266 |
| R-squared | 0.0178520367584202 |
| Adjusted R-squared | -0.0289169138721312 |
| F-TEST (value) | 0.381707019672973 |
| F-TEST (DF numerator) | 3 |
| F-TEST (DF denominator) | 63 |
| p-value | 0.766519133367996 |
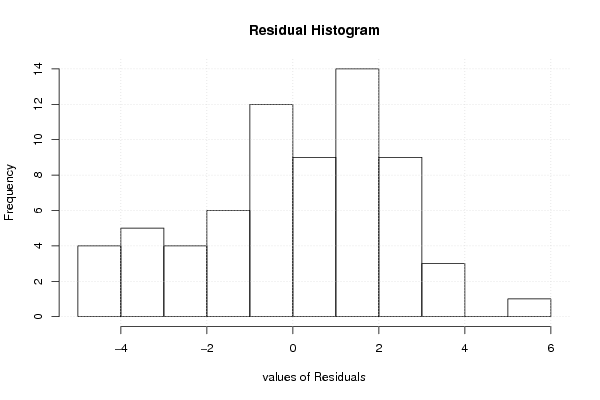
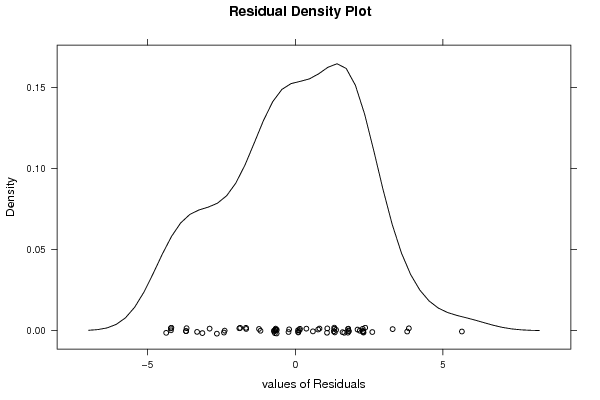
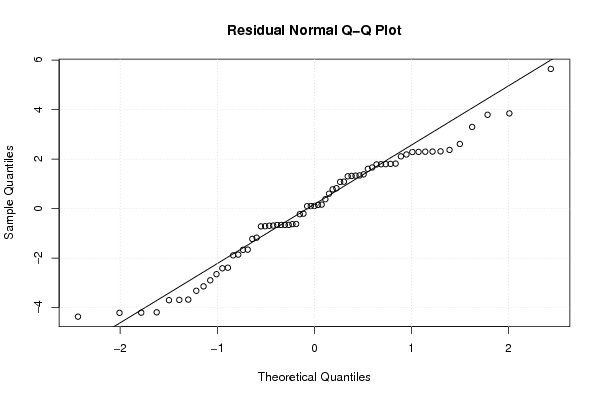
| Multiple Linear Regression - Residual Statistics | |
| Residual Standard Deviation | 2.30793010775058 |
| Sum Squared Residuals | 335.572107082481 |
| Multiple Linear Regression - Actuals, Interpolation, and Residuals | |||
| Time or Index | Actuals | Interpolation Forecast | Residuals Prediction Error |
| 1 | 2 | 0.185429161143348 | 1.81457083885665 |
| 2 | 0 | 0.208653292520974 | -0.208653292520974 |
| 3 | 0 | 0.664818131279465 | -0.664818131279465 |
| 4 | 4 | 0.70390253515435 | 3.29609746484565 |
| 5 | 0 | 0.6319282310298 | -0.6319282310298 |
| 6 | -1 | 0.17789744683618 | -1.17789744683618 |
| 7 | 0 | 0.664978851911836 | -0.664978851911836 |
| 8 | 1 | 0.624606429885006 | 0.375393570114994 |
| 9 | 0 | 0.688283719121144 | -0.688283719121144 |
| 10 | 3 | 0.688399753409469 | 2.31160024659053 |
| 11 | -1 | 0.669918007233278 | -1.66991800723328 |
| 12 | 4 | 0.154067233447697 | 3.8459327665523 |
| 13 | 3 | 0.631812572256973 | 2.36818742774303 |
| 14 | 1 | 0.224670154980145 | 0.775329845019855 |
| 15 | 0 | 0.228368231586665 | -0.228368231586665 |
| 16 | -2 | 0.654094910770144 | -2.65409491077014 |
| 17 | -4 | 0.208634141230668 | -4.20863414123067 |
| 18 | 2 | 0.207222578480474 | 1.79277742151953 |
| 19 | 2 | 0.617845648891526 | 1.38215435110847 |
| 20 | -4 | 0.195845961007774 | -4.19584596100777 |
| 21 | 2 | 0.671677672848444 | 1.32832232715156 |
| 22 | 2 | 0.662249980800993 | 1.33775001919901 |
| 23 | 0 | 0.625630460643128 | -0.625630460643128 |
| 24 | -3 | 0.680086591354721 | -3.68008659135472 |
| 25 | 2 | 0.210836915131343 | 1.78916308486866 |
| 26 | 4 | 0.210645402228284 | 3.78935459777172 |
| 27 | 2 | 0.696704654123299 | 1.3032953458767 |
| 28 | 2 | 0.681293498159489 | 1.31870650184051 |
| 29 | -4 | 0.215591316828658 | -4.21559131682866 |
| 30 | 3 | 0.711608113136254 | 2.28839188686375 |
| 31 | 3 | 0.698151515330135 | 2.30184848466986 |
| 32 | 2 | 0.196254521867634 | 1.80374547813237 |
| 33 | -1 | 0.662622492173217 | -1.66262249217322 |
| 34 | -3 | 0.69277450894013 | -3.69277450894013 |
| 35 | 0 | 0.721760925606857 | -0.721760925606857 |
| 36 | 1 | 0.180114490325711 | 0.819885509674289 |
| 37 | -3 | 0.703828558601599 | -3.7038285586016 |
| 38 | 3 | 0.716062102436613 | 2.28393789756339 |
| 39 | 0 | 0.715771828958055 | -0.715771828958055 |
| 40 | 0 | 0.662453134684434 | -0.662453134684434 |
| 41 | 0 | 0.696638938911465 | -0.696638938911465 |
| 42 | 3 | 0.704144367133899 | 2.2958556328661 |
| 43 | -3 | 0.145441642500117 | -3.14544164250012 |
| 44 | 0 | 0.661988246500146 | -0.661988246500146 |
| 45 | 2 | 0.216403181331429 | 1.78359681866857 |
| 46 | -1 | 0.227887947267032 | -1.22788794726703 |
| 47 | 2 | 0.340833314912256 | 1.65916668508774 |
| 48 | 2 | -0.18424162152184 | 2.18424162152184 |
| 49 | -2 | -0.135890246231875 | -1.86410975376813 |
| 50 | 0 | -0.157914230083665 | 0.157914230083665 |
| 51 | -2 | 0.392182430408339 | -2.39218243040834 |
| 52 | 0 | -0.14658943374944 | 0.14658943374944 |
| 53 | 6 | 0.358711232170564 | 5.64128876782944 |
| 54 | -3 | 0.324831097557437 | -3.32483109755744 |
| 55 | 3 | 0.391158024134721 | 2.60884197586528 |
| 56 | 0 | -0.0992053863776725 | 0.0992053863776725 |
| 57 | -2 | -0.106890686522782 | -1.89310931347722 |
| 58 | 1 | 0.40233036117749 | 0.59766963882251 |
| 59 | 0 | -0.103073195988473 | 0.103073195988473 |
| 60 | 2 | -0.108105854668467 | 2.10810585466847 |
| 61 | 2 | 0.398264654900196 | 1.6017353450998 |
| 62 | -3 | -0.0991896147268316 | -2.90081038527317 |
| 63 | -2 | 0.415280388579244 | -2.41528038857924 |
| 64 | 1 | -0.0742816718642716 | 1.07428167186427 |
| 65 | -4 | 0.370372114873883 | -4.37037211487388 |
| 66 | 1 | -0.0846489036832008 | 1.0846489036832 |
| 67 | 0 | -0.0939327732956099 | 0.0939327732956099 |
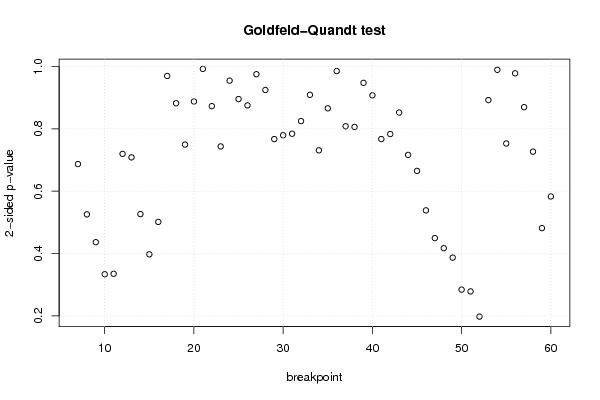
| Goldfeld-Quandt test for Heteroskedasticity | |||
| p-values | Alternative Hypothesis | ||
| breakpoint index | greater | 2-sided | less |
| 7 | 0.343524686005436 | 0.687049372010872 | 0.656475313994564 |
| 8 | 0.262795396219814 | 0.525590792439629 | 0.737204603780186 |
| 9 | 0.21818119018245 | 0.4363623803649 | 0.78181880981755 |
| 10 | 0.166782719632911 | 0.333565439265822 | 0.833217280367089 |
| 11 | 0.167494368288326 | 0.334988736576653 | 0.832505631711673 |
| 12 | 0.359853185948162 | 0.719706371896323 | 0.640146814051838 |
| 13 | 0.354215374935494 | 0.708430749870988 | 0.645784625064506 |
| 14 | 0.263221676782294 | 0.526443353564587 | 0.736778323217706 |
| 15 | 0.198743478255009 | 0.397486956510018 | 0.801256521744991 |
| 16 | 0.250741192922533 | 0.501482385845067 | 0.749258807077467 |
| 17 | 0.484754812615441 | 0.969509625230883 | 0.515245187384559 |
| 18 | 0.441015704425602 | 0.882031408851204 | 0.558984295574398 |
| 19 | 0.374796932377426 | 0.749593864754852 | 0.625203067622574 |
| 20 | 0.556145020714711 | 0.887709958570578 | 0.443854979285289 |
| 21 | 0.496040074267718 | 0.992080148535437 | 0.503959925732282 |
| 22 | 0.436359470094804 | 0.872718940189609 | 0.563640529905196 |
| 23 | 0.3717721883473 | 0.743544376694601 | 0.6282278116527 |
| 24 | 0.477272601454246 | 0.954545202908491 | 0.522727398545754 |
| 25 | 0.447747434757051 | 0.895494869514101 | 0.552252565242949 |
| 26 | 0.562413648539721 | 0.875172702920557 | 0.437586351460279 |
| 27 | 0.512440587128576 | 0.975118825742847 | 0.487559412871424 |
| 28 | 0.462331448861024 | 0.924662897722048 | 0.537668551138976 |
| 29 | 0.616444727222045 | 0.767110545555909 | 0.383555272777955 |
| 30 | 0.610275711324535 | 0.779448577350931 | 0.389724288675465 |
| 31 | 0.60787599202272 | 0.784248015954561 | 0.392124007977281 |
| 32 | 0.587550947215711 | 0.824898105568577 | 0.412449052784289 |
| 33 | 0.545474339804677 | 0.909051320390647 | 0.454525660195324 |
| 34 | 0.634484601199974 | 0.731030797600052 | 0.365515398800026 |
| 35 | 0.567046217901465 | 0.86590756419707 | 0.432953782098535 |
| 36 | 0.507348535925397 | 0.985302928149206 | 0.492651464074603 |
| 37 | 0.595877699878527 | 0.808244600242946 | 0.404122300121473 |
| 38 | 0.596953440891898 | 0.806093118216205 | 0.403046559108102 |
| 39 | 0.526225493860702 | 0.947549012278596 | 0.473774506139298 |
| 40 | 0.453739169919757 | 0.907478339839515 | 0.546260830080243 |
| 41 | 0.383560066669508 | 0.767120133339016 | 0.616439933330492 |
| 42 | 0.391586695101276 | 0.783173390202553 | 0.608413304898724 |
| 43 | 0.42612740849062 | 0.852254816981241 | 0.57387259150938 |
| 44 | 0.358201468131358 | 0.716402936262716 | 0.641798531868642 |
| 45 | 0.332550022899046 | 0.665100045798091 | 0.667449977100954 |
| 46 | 0.269252337099263 | 0.538504674198525 | 0.730747662900737 |
| 47 | 0.224735724294964 | 0.449471448589929 | 0.775264275705036 |
| 48 | 0.208571533393054 | 0.417143066786107 | 0.791428466606946 |
| 49 | 0.193452944478613 | 0.386905888957227 | 0.806547055521387 |
| 50 | 0.142131015028381 | 0.284262030056763 | 0.857868984971619 |
| 51 | 0.139259670348628 | 0.278519340697257 | 0.860740329651372 |
| 52 | 0.0987560086834235 | 0.197512017366847 | 0.901243991316577 |
| 53 | 0.553905366416895 | 0.89218926716621 | 0.446094633583105 |
| 54 | 0.494634276713508 | 0.989268553427016 | 0.505365723286492 |
| 55 | 0.623554790458944 | 0.752890419082112 | 0.376445209541056 |
| 56 | 0.510938115147843 | 0.978123769704314 | 0.489061884852157 |
| 57 | 0.434738888394107 | 0.869477776788214 | 0.565261111605893 |
| 58 | 0.363415359855508 | 0.726830719711016 | 0.636584640144492 |
| 59 | 0.240782564289402 | 0.481565128578804 | 0.759217435710598 |
| 60 | 0.291501097147994 | 0.583002194295988 | 0.708498902852006 |
| Meta Analysis of Goldfeld-Quandt test for Heteroskedasticity | |||
| Description | # significant tests | % significant tests | OK/NOK |
| 1% type I error level | 0 | 0 | OK |
| 5% type I error level | 0 | 0 | OK |
| 10% type I error level | 0 | 0 | OK |