Free Statistics

of Irreproducible Research!

Author's title

Author*The author of this computation has been verified*
R Software Modulerwasp_regression_trees1.wasp
Title produced by softwareRecursive Partitioning (Regression Trees)
Date of computationSat, 10 Dec 2011 13:05:22 -0500
Cite this page as followsStatistical Computations at FreeStatistics.org, Office for Research Development and Education, URL https://freestatistics.org/blog/index.php?v=date/2011/Dec/10/t1323540512dwm43g7wvcj2dh1.htm/, Retrieved Sun, 05 May 2024 06:44:18 +0000
Statistical Computations at FreeStatistics.org, Office for Research Development and Education, URL https://freestatistics.org/blog/index.php?pk=153613, Retrieved Sun, 05 May 2024 06:44:18 +0000
QR Codes:

Original text written by user:
IsPrivate?No (this computation is public)
User-defined keywords
Estimated Impact95
Family? (F = Feedback message, R = changed R code, M = changed R Module, P = changed Parameters, D = changed Data)
-       [Recursive Partitioning (Regression Trees)] [Regression Trees ...] [2011-12-10 18:05:22] [10a6f28c51bb1cb94db47cee32729d66] [Current]
Feedback Forum

Post a new message
Dataseries X:
118,49	548	4,2	23118	2075
118,31	563	3,88	22849	2294
117,99	581	4,11	20198	2670
118,09	572	4,22	18130	2242
117,95	519	4,14	25597	2764
117,59	521	4,21	28785	2409
117,2	531	4,29	28229	2187
116,91	540	4,21	33474	2221
116,33	548	4,21	28287	1777
115,66	556	4,14	27297	1956
115	551	3,99	16167	1493
114,55	549	3,48	22380	1719
114,41	564	3,21	24256	3471
114,25	586	3,12	19573	4894
113,89	604	3,03	21553	4242
113,82	601	3,29	21359	3595
113,77	545	3,47	29586	3762
113,78	537	3,31	27186	3055
113,33	552	3,54	32066	2503
112,94	563	3,63	34670	2327
112,52	575	3,73	25985	2389
112,05	580	3,75	27561	2923
111,54	575	3,61	14538	2624
111,36	558	3,64	18730	2424
111,07	564	3,68	22485	2592
111,02	581	3,72	20036	2859
111,31	597	3,77	16971	2349
110,97	587	3,92	19028	2524
111,04	536	4,12	22759	2622
111,25	524	4,03	20516	2362
111,33	537	3,93	26195	2251
111,1	536	4,03	27786	3071
111,74	533	4,24	24090	2859
111,36	528	4,13	25447	2645
111,25	516	3,87	11509	3133
111,49	502	4,26	15572	2575
112,16	506	4,46	22518	2583
112,36	518	4,56	20520	3200
112,18	534	4,58	17789	2875
112,87	528	4,85	20205	3014
112,28	478	4,84	26835	2925
111,66	469	4,51	25826	3373
110,67	490	4,37	31934	2925
110,42	493	4,23	30019	2591
109,62	508	4,23	30111	2814
108,84	517	4,25	31566	3641
108,4	514	4,41	12738	2578
108,1	510	4,28	19814	3129
107,1	527	4,42	24776	2849
106,54	542	4,39	20424	3534
106,44	565	4,44	18688	2617
106,57	555	4,62	20418	3016
106,12	499	4,64	25778	3483
106,13	511	4,34	25100	3014
106,26	526	4,22	25859	3179
105,78	532	4,01	30651	2907
105,77	549	4,11	26551	2770
105,2	561	4,06	31124	3498
105,15	557	3,82	9367	3417
105,01	566	3,76	17382	3324


Summary of computational transaction
Raw Inputview raw input (R code)
Raw Outputview raw output of R engine
Computing time4 seconds
R Server'George Udny Yule' @ yule.wessa.net

\begin{tabular}{lllllllll}
\hline
Summary of computational transaction \tabularnewline
Raw Input & view raw input (R code)  \tabularnewline
Raw Output & view raw output of R engine  \tabularnewline
Computing time & 4 seconds \tabularnewline
R Server & 'George Udny Yule' @ yule.wessa.net \tabularnewline
\hline
\end{tabular}
%Source: https://freestatistics.org/blog/index.php?pk=153613&T=0

[TABLE]
[ROW][C]Summary of computational transaction[/C][/ROW]
[ROW][C]Raw Input[/C][C]view raw input (R code) [/C][/ROW]
[ROW][C]Raw Output[/C][C]view raw output of R engine [/C][/ROW]
[ROW][C]Computing time[/C][C]4 seconds[/C][/ROW]
[ROW][C]R Server[/C][C]'George Udny Yule' @ yule.wessa.net[/C][/ROW]
[/TABLE]
Source: https://freestatistics.org/blog/index.php?pk=153613&T=0

Globally Unique Identifier (entire table): ba.freestatistics.org/blog/index.php?pk=153613&T=0

As an alternative you can also use a QR Code:  

The GUIDs for individual cells are displayed in the table below:

Summary of computational transaction
Raw Inputview raw input (R code)
Raw Outputview raw output of R engine
Computing time4 seconds
R Server'George Udny Yule' @ yule.wessa.net


Goodness of Fit
Correlation0.5467
R-squared0.2989
RMSE3.1188

\begin{tabular}{lllllllll}
\hline
Goodness of Fit \tabularnewline
Correlation & 0.5467 \tabularnewline
R-squared & 0.2989 \tabularnewline
RMSE & 3.1188 \tabularnewline
\hline
\end{tabular}
%Source: https://freestatistics.org/blog/index.php?pk=153613&T=1

[TABLE]
[ROW][C]Goodness of Fit[/C][/ROW]
[ROW][C]Correlation[/C][C]0.5467[/C][/ROW]
[ROW][C]R-squared[/C][C]0.2989[/C][/ROW]
[ROW][C]RMSE[/C][C]3.1188[/C][/ROW]
[/TABLE]
Source: https://freestatistics.org/blog/index.php?pk=153613&T=1

Globally Unique Identifier (entire table): ba.freestatistics.org/blog/index.php?pk=153613&T=1

As an alternative you can also use a QR Code:  

The GUIDs for individual cells are displayed in the table below:

Goodness of Fit
Correlation0.5467
R-squared0.2989
RMSE3.1188


Actuals, Predictions, and Residuals
#ActualsForecastsResiduals
1118.49115.1653333333333.32466666666666
2118.31115.1653333333333.14466666666667
3117.99110.4624444444447.52755555555555
4118.09115.1653333333332.92466666666667
5117.95110.4624444444447.48755555555556
6117.59115.1653333333332.42466666666667
7117.2115.1653333333332.03466666666667
8116.91115.1653333333331.74466666666666
9116.33115.1653333333331.16466666666666
10115.66115.1653333333330.49466666666666
11115115.165333333333-0.165333333333336
12114.55115.165333333333-0.61533333333334
13114.41110.4624444444443.94755555555555
14114.25110.4624444444443.78755555555556
15113.89110.4624444444443.42755555555556
16113.82110.4624444444443.35755555555555
17113.77110.4624444444443.30755555555555
18113.78110.4624444444443.31755555555556
19113.33110.4624444444442.86755555555555
20112.94115.165333333333-2.22533333333334
21112.52115.165333333333-2.64533333333334
22112.05110.4624444444441.58755555555555
23111.54110.4624444444441.07755555555556
24111.36110.4624444444440.897555555555556
25111.07110.4624444444440.60755555555555
26111.02110.4624444444440.557555555555552
27111.31115.165333333333-3.85533333333333
28110.97110.4624444444440.507555555555555
29111.04110.4624444444440.577555555555563
30111.25115.165333333333-3.91533333333334
31111.33115.165333333333-3.83533333333334
32111.1110.4624444444440.637555555555551
33111.74110.4624444444441.27755555555555
34111.36110.4624444444440.897555555555556
35111.25110.4624444444440.787555555555556
36111.49110.4624444444441.02755555555555
37112.16110.4624444444441.69755555555555
38112.36110.4624444444441.89755555555556
39112.18110.4624444444441.71755555555556
40112.87110.4624444444442.40755555555556
41112.28110.4624444444441.81755555555556
42111.66110.4624444444441.19755555555555
43110.67110.4624444444440.207555555555558
44110.42110.462444444444-0.0424444444444418
45109.62110.462444444444-0.842444444444439
46108.84110.462444444444-1.62244444444444
47108.4110.462444444444-2.06244444444444
48108.1110.462444444444-2.36244444444445
49107.1110.462444444444-3.36244444444445
50106.54110.462444444444-3.92244444444444
51106.44110.462444444444-4.02244444444445
52106.57110.462444444444-3.89244444444445
53106.12110.462444444444-4.34244444444444
54106.13110.462444444444-4.33244444444445
55106.26110.462444444444-4.20244444444444
56105.78110.462444444444-4.68244444444444
57105.77110.462444444444-4.69244444444445
58105.2110.462444444444-5.26244444444444
59105.15110.462444444444-5.31244444444444
60105.01110.462444444444-5.45244444444444

\begin{tabular}{lllllllll}
\hline
Actuals, Predictions, and Residuals \tabularnewline
# & Actuals & Forecasts & Residuals \tabularnewline
1 & 118.49 & 115.165333333333 & 3.32466666666666 \tabularnewline
2 & 118.31 & 115.165333333333 & 3.14466666666667 \tabularnewline
3 & 117.99 & 110.462444444444 & 7.52755555555555 \tabularnewline
4 & 118.09 & 115.165333333333 & 2.92466666666667 \tabularnewline
5 & 117.95 & 110.462444444444 & 7.48755555555556 \tabularnewline
6 & 117.59 & 115.165333333333 & 2.42466666666667 \tabularnewline
7 & 117.2 & 115.165333333333 & 2.03466666666667 \tabularnewline
8 & 116.91 & 115.165333333333 & 1.74466666666666 \tabularnewline
9 & 116.33 & 115.165333333333 & 1.16466666666666 \tabularnewline
10 & 115.66 & 115.165333333333 & 0.49466666666666 \tabularnewline
11 & 115 & 115.165333333333 & -0.165333333333336 \tabularnewline
12 & 114.55 & 115.165333333333 & -0.61533333333334 \tabularnewline
13 & 114.41 & 110.462444444444 & 3.94755555555555 \tabularnewline
14 & 114.25 & 110.462444444444 & 3.78755555555556 \tabularnewline
15 & 113.89 & 110.462444444444 & 3.42755555555556 \tabularnewline
16 & 113.82 & 110.462444444444 & 3.35755555555555 \tabularnewline
17 & 113.77 & 110.462444444444 & 3.30755555555555 \tabularnewline
18 & 113.78 & 110.462444444444 & 3.31755555555556 \tabularnewline
19 & 113.33 & 110.462444444444 & 2.86755555555555 \tabularnewline
20 & 112.94 & 115.165333333333 & -2.22533333333334 \tabularnewline
21 & 112.52 & 115.165333333333 & -2.64533333333334 \tabularnewline
22 & 112.05 & 110.462444444444 & 1.58755555555555 \tabularnewline
23 & 111.54 & 110.462444444444 & 1.07755555555556 \tabularnewline
24 & 111.36 & 110.462444444444 & 0.897555555555556 \tabularnewline
25 & 111.07 & 110.462444444444 & 0.60755555555555 \tabularnewline
26 & 111.02 & 110.462444444444 & 0.557555555555552 \tabularnewline
27 & 111.31 & 115.165333333333 & -3.85533333333333 \tabularnewline
28 & 110.97 & 110.462444444444 & 0.507555555555555 \tabularnewline
29 & 111.04 & 110.462444444444 & 0.577555555555563 \tabularnewline
30 & 111.25 & 115.165333333333 & -3.91533333333334 \tabularnewline
31 & 111.33 & 115.165333333333 & -3.83533333333334 \tabularnewline
32 & 111.1 & 110.462444444444 & 0.637555555555551 \tabularnewline
33 & 111.74 & 110.462444444444 & 1.27755555555555 \tabularnewline
34 & 111.36 & 110.462444444444 & 0.897555555555556 \tabularnewline
35 & 111.25 & 110.462444444444 & 0.787555555555556 \tabularnewline
36 & 111.49 & 110.462444444444 & 1.02755555555555 \tabularnewline
37 & 112.16 & 110.462444444444 & 1.69755555555555 \tabularnewline
38 & 112.36 & 110.462444444444 & 1.89755555555556 \tabularnewline
39 & 112.18 & 110.462444444444 & 1.71755555555556 \tabularnewline
40 & 112.87 & 110.462444444444 & 2.40755555555556 \tabularnewline
41 & 112.28 & 110.462444444444 & 1.81755555555556 \tabularnewline
42 & 111.66 & 110.462444444444 & 1.19755555555555 \tabularnewline
43 & 110.67 & 110.462444444444 & 0.207555555555558 \tabularnewline
44 & 110.42 & 110.462444444444 & -0.0424444444444418 \tabularnewline
45 & 109.62 & 110.462444444444 & -0.842444444444439 \tabularnewline
46 & 108.84 & 110.462444444444 & -1.62244444444444 \tabularnewline
47 & 108.4 & 110.462444444444 & -2.06244444444444 \tabularnewline
48 & 108.1 & 110.462444444444 & -2.36244444444445 \tabularnewline
49 & 107.1 & 110.462444444444 & -3.36244444444445 \tabularnewline
50 & 106.54 & 110.462444444444 & -3.92244444444444 \tabularnewline
51 & 106.44 & 110.462444444444 & -4.02244444444445 \tabularnewline
52 & 106.57 & 110.462444444444 & -3.89244444444445 \tabularnewline
53 & 106.12 & 110.462444444444 & -4.34244444444444 \tabularnewline
54 & 106.13 & 110.462444444444 & -4.33244444444445 \tabularnewline
55 & 106.26 & 110.462444444444 & -4.20244444444444 \tabularnewline
56 & 105.78 & 110.462444444444 & -4.68244444444444 \tabularnewline
57 & 105.77 & 110.462444444444 & -4.69244444444445 \tabularnewline
58 & 105.2 & 110.462444444444 & -5.26244444444444 \tabularnewline
59 & 105.15 & 110.462444444444 & -5.31244444444444 \tabularnewline
60 & 105.01 & 110.462444444444 & -5.45244444444444 \tabularnewline
\hline
\end{tabular}
%Source: https://freestatistics.org/blog/index.php?pk=153613&T=2

[TABLE]
[ROW][C]Actuals, Predictions, and Residuals[/C][/ROW]
[ROW][C]#[/C][C]Actuals[/C][C]Forecasts[/C][C]Residuals[/C][/ROW]
[ROW][C]1[/C][C]118.49[/C][C]115.165333333333[/C][C]3.32466666666666[/C][/ROW]
[ROW][C]2[/C][C]118.31[/C][C]115.165333333333[/C][C]3.14466666666667[/C][/ROW]
[ROW][C]3[/C][C]117.99[/C][C]110.462444444444[/C][C]7.52755555555555[/C][/ROW]
[ROW][C]4[/C][C]118.09[/C][C]115.165333333333[/C][C]2.92466666666667[/C][/ROW]
[ROW][C]5[/C][C]117.95[/C][C]110.462444444444[/C][C]7.48755555555556[/C][/ROW]
[ROW][C]6[/C][C]117.59[/C][C]115.165333333333[/C][C]2.42466666666667[/C][/ROW]
[ROW][C]7[/C][C]117.2[/C][C]115.165333333333[/C][C]2.03466666666667[/C][/ROW]
[ROW][C]8[/C][C]116.91[/C][C]115.165333333333[/C][C]1.74466666666666[/C][/ROW]
[ROW][C]9[/C][C]116.33[/C][C]115.165333333333[/C][C]1.16466666666666[/C][/ROW]
[ROW][C]10[/C][C]115.66[/C][C]115.165333333333[/C][C]0.49466666666666[/C][/ROW]
[ROW][C]11[/C][C]115[/C][C]115.165333333333[/C][C]-0.165333333333336[/C][/ROW]
[ROW][C]12[/C][C]114.55[/C][C]115.165333333333[/C][C]-0.61533333333334[/C][/ROW]
[ROW][C]13[/C][C]114.41[/C][C]110.462444444444[/C][C]3.94755555555555[/C][/ROW]
[ROW][C]14[/C][C]114.25[/C][C]110.462444444444[/C][C]3.78755555555556[/C][/ROW]
[ROW][C]15[/C][C]113.89[/C][C]110.462444444444[/C][C]3.42755555555556[/C][/ROW]
[ROW][C]16[/C][C]113.82[/C][C]110.462444444444[/C][C]3.35755555555555[/C][/ROW]
[ROW][C]17[/C][C]113.77[/C][C]110.462444444444[/C][C]3.30755555555555[/C][/ROW]
[ROW][C]18[/C][C]113.78[/C][C]110.462444444444[/C][C]3.31755555555556[/C][/ROW]
[ROW][C]19[/C][C]113.33[/C][C]110.462444444444[/C][C]2.86755555555555[/C][/ROW]
[ROW][C]20[/C][C]112.94[/C][C]115.165333333333[/C][C]-2.22533333333334[/C][/ROW]
[ROW][C]21[/C][C]112.52[/C][C]115.165333333333[/C][C]-2.64533333333334[/C][/ROW]
[ROW][C]22[/C][C]112.05[/C][C]110.462444444444[/C][C]1.58755555555555[/C][/ROW]
[ROW][C]23[/C][C]111.54[/C][C]110.462444444444[/C][C]1.07755555555556[/C][/ROW]
[ROW][C]24[/C][C]111.36[/C][C]110.462444444444[/C][C]0.897555555555556[/C][/ROW]
[ROW][C]25[/C][C]111.07[/C][C]110.462444444444[/C][C]0.60755555555555[/C][/ROW]
[ROW][C]26[/C][C]111.02[/C][C]110.462444444444[/C][C]0.557555555555552[/C][/ROW]
[ROW][C]27[/C][C]111.31[/C][C]115.165333333333[/C][C]-3.85533333333333[/C][/ROW]
[ROW][C]28[/C][C]110.97[/C][C]110.462444444444[/C][C]0.507555555555555[/C][/ROW]
[ROW][C]29[/C][C]111.04[/C][C]110.462444444444[/C][C]0.577555555555563[/C][/ROW]
[ROW][C]30[/C][C]111.25[/C][C]115.165333333333[/C][C]-3.91533333333334[/C][/ROW]
[ROW][C]31[/C][C]111.33[/C][C]115.165333333333[/C][C]-3.83533333333334[/C][/ROW]
[ROW][C]32[/C][C]111.1[/C][C]110.462444444444[/C][C]0.637555555555551[/C][/ROW]
[ROW][C]33[/C][C]111.74[/C][C]110.462444444444[/C][C]1.27755555555555[/C][/ROW]
[ROW][C]34[/C][C]111.36[/C][C]110.462444444444[/C][C]0.897555555555556[/C][/ROW]
[ROW][C]35[/C][C]111.25[/C][C]110.462444444444[/C][C]0.787555555555556[/C][/ROW]
[ROW][C]36[/C][C]111.49[/C][C]110.462444444444[/C][C]1.02755555555555[/C][/ROW]
[ROW][C]37[/C][C]112.16[/C][C]110.462444444444[/C][C]1.69755555555555[/C][/ROW]
[ROW][C]38[/C][C]112.36[/C][C]110.462444444444[/C][C]1.89755555555556[/C][/ROW]
[ROW][C]39[/C][C]112.18[/C][C]110.462444444444[/C][C]1.71755555555556[/C][/ROW]
[ROW][C]40[/C][C]112.87[/C][C]110.462444444444[/C][C]2.40755555555556[/C][/ROW]
[ROW][C]41[/C][C]112.28[/C][C]110.462444444444[/C][C]1.81755555555556[/C][/ROW]
[ROW][C]42[/C][C]111.66[/C][C]110.462444444444[/C][C]1.19755555555555[/C][/ROW]
[ROW][C]43[/C][C]110.67[/C][C]110.462444444444[/C][C]0.207555555555558[/C][/ROW]
[ROW][C]44[/C][C]110.42[/C][C]110.462444444444[/C][C]-0.0424444444444418[/C][/ROW]
[ROW][C]45[/C][C]109.62[/C][C]110.462444444444[/C][C]-0.842444444444439[/C][/ROW]
[ROW][C]46[/C][C]108.84[/C][C]110.462444444444[/C][C]-1.62244444444444[/C][/ROW]
[ROW][C]47[/C][C]108.4[/C][C]110.462444444444[/C][C]-2.06244444444444[/C][/ROW]
[ROW][C]48[/C][C]108.1[/C][C]110.462444444444[/C][C]-2.36244444444445[/C][/ROW]
[ROW][C]49[/C][C]107.1[/C][C]110.462444444444[/C][C]-3.36244444444445[/C][/ROW]
[ROW][C]50[/C][C]106.54[/C][C]110.462444444444[/C][C]-3.92244444444444[/C][/ROW]
[ROW][C]51[/C][C]106.44[/C][C]110.462444444444[/C][C]-4.02244444444445[/C][/ROW]
[ROW][C]52[/C][C]106.57[/C][C]110.462444444444[/C][C]-3.89244444444445[/C][/ROW]
[ROW][C]53[/C][C]106.12[/C][C]110.462444444444[/C][C]-4.34244444444444[/C][/ROW]
[ROW][C]54[/C][C]106.13[/C][C]110.462444444444[/C][C]-4.33244444444445[/C][/ROW]
[ROW][C]55[/C][C]106.26[/C][C]110.462444444444[/C][C]-4.20244444444444[/C][/ROW]
[ROW][C]56[/C][C]105.78[/C][C]110.462444444444[/C][C]-4.68244444444444[/C][/ROW]
[ROW][C]57[/C][C]105.77[/C][C]110.462444444444[/C][C]-4.69244444444445[/C][/ROW]
[ROW][C]58[/C][C]105.2[/C][C]110.462444444444[/C][C]-5.26244444444444[/C][/ROW]
[ROW][C]59[/C][C]105.15[/C][C]110.462444444444[/C][C]-5.31244444444444[/C][/ROW]
[ROW][C]60[/C][C]105.01[/C][C]110.462444444444[/C][C]-5.45244444444444[/C][/ROW]
[/TABLE]
Source: https://freestatistics.org/blog/index.php?pk=153613&T=2

Globally Unique Identifier (entire table): ba.freestatistics.org/blog/index.php?pk=153613&T=2

As an alternative you can also use a QR Code:  

The GUIDs for individual cells are displayed in the table below:

Actuals, Predictions, and Residuals
#ActualsForecastsResiduals
1118.49115.1653333333333.32466666666666
2118.31115.1653333333333.14466666666667
3117.99110.4624444444447.52755555555555
4118.09115.1653333333332.92466666666667
5117.95110.4624444444447.48755555555556
6117.59115.1653333333332.42466666666667
7117.2115.1653333333332.03466666666667
8116.91115.1653333333331.74466666666666
9116.33115.1653333333331.16466666666666
10115.66115.1653333333330.49466666666666
11115115.165333333333-0.165333333333336
12114.55115.165333333333-0.61533333333334
13114.41110.4624444444443.94755555555555
14114.25110.4624444444443.78755555555556
15113.89110.4624444444443.42755555555556
16113.82110.4624444444443.35755555555555
17113.77110.4624444444443.30755555555555
18113.78110.4624444444443.31755555555556
19113.33110.4624444444442.86755555555555
20112.94115.165333333333-2.22533333333334
21112.52115.165333333333-2.64533333333334
22112.05110.4624444444441.58755555555555
23111.54110.4624444444441.07755555555556
24111.36110.4624444444440.897555555555556
25111.07110.4624444444440.60755555555555
26111.02110.4624444444440.557555555555552
27111.31115.165333333333-3.85533333333333
28110.97110.4624444444440.507555555555555
29111.04110.4624444444440.577555555555563
30111.25115.165333333333-3.91533333333334
31111.33115.165333333333-3.83533333333334
32111.1110.4624444444440.637555555555551
33111.74110.4624444444441.27755555555555
34111.36110.4624444444440.897555555555556
35111.25110.4624444444440.787555555555556
36111.49110.4624444444441.02755555555555
37112.16110.4624444444441.69755555555555
38112.36110.4624444444441.89755555555556
39112.18110.4624444444441.71755555555556
40112.87110.4624444444442.40755555555556
41112.28110.4624444444441.81755555555556
42111.66110.4624444444441.19755555555555
43110.67110.4624444444440.207555555555558
44110.42110.462444444444-0.0424444444444418
45109.62110.462444444444-0.842444444444439
46108.84110.462444444444-1.62244444444444
47108.4110.462444444444-2.06244444444444
48108.1110.462444444444-2.36244444444445
49107.1110.462444444444-3.36244444444445
50106.54110.462444444444-3.92244444444444
51106.44110.462444444444-4.02244444444445
52106.57110.462444444444-3.89244444444445
53106.12110.462444444444-4.34244444444444
54106.13110.462444444444-4.33244444444445
55106.26110.462444444444-4.20244444444444
56105.78110.462444444444-4.68244444444444
57105.77110.462444444444-4.69244444444445
58105.2110.462444444444-5.26244444444444
59105.15110.462444444444-5.31244444444444
60105.01110.462444444444-5.45244444444444


Parameters (Session):
par1 = 1 ; par2 = none ; par3 = 3 ; par4 = no ;
Parameters (R input):
par1 = 1 ; par2 = none ; par3 = 3 ; par4 = no ;
R code (references can be found in the software module):
library(party)
library(Hmisc)
par1 <- as.numeric(par1)
par3 <- as.numeric(par3)
x <- data.frame(t(y))
is.data.frame(x)
x <- x[!is.na(x[,par1]),]
k <- length(x[1,])
n <- length(x[,1])
colnames(x)[par1]
x[,par1]
if (par2 == 'kmeans') {
cl <- kmeans(x[,par1], par3)
print(cl)
clm <- matrix(cbind(cl$centers,1:par3),ncol=2)
clm <- clm[sort.list(clm[,1]),]
for (i in 1:par3) {
cl$cluster[cl$cluster==clm[i,2]] <- paste('C',i,sep='')
}
cl$cluster <- as.factor(cl$cluster)
print(cl$cluster)
x[,par1] <- cl$cluster
}
if (par2 == 'quantiles') {
x[,par1] <- cut2(x[,par1],g=par3)
}
if (par2 == 'hclust') {
hc <- hclust(dist(x[,par1])^2, 'cen')
print(hc)
memb <- cutree(hc, k = par3)
dum <- c(mean(x[memb==1,par1]))
for (i in 2:par3) {
dum <- c(dum, mean(x[memb==i,par1]))
}
hcm <- matrix(cbind(dum,1:par3),ncol=2)
hcm <- hcm[sort.list(hcm[,1]),]
for (i in 1:par3) {
memb[memb==hcm[i,2]] <- paste('C',i,sep='')
}
memb <- as.factor(memb)
print(memb)
x[,par1] <- memb
}
if (par2=='equal') {
ed <- cut(as.numeric(x[,par1]),par3,labels=paste('C',1:par3,sep=''))
x[,par1] <- as.factor(ed)
}
table(x[,par1])
colnames(x)
colnames(x)[par1]
x[,par1]
if (par2 == 'none') {
m <- ctree(as.formula(paste(colnames(x)[par1],' ~ .',sep='')),data = x)
}
load(file='createtable')
if (par2 != 'none') {
m <- ctree(as.formula(paste('as.factor(',colnames(x)[par1],') ~ .',sep='')),data = x)
if (par4=='yes') {
a<-table.start()
a<-table.row.start(a)
a<-table.element(a,'10-Fold Cross Validation',3+2*par3,TRUE)
a<-table.row.end(a)
a<-table.row.start(a)
a<-table.element(a,'',1,TRUE)
a<-table.element(a,'Prediction (training)',par3+1,TRUE)
a<-table.element(a,'Prediction (testing)',par3+1,TRUE)
a<-table.row.end(a)
a<-table.row.start(a)
a<-table.element(a,'Actual',1,TRUE)
for (jjj in 1:par3) a<-table.element(a,paste('C',jjj,sep=''),1,TRUE)
a<-table.element(a,'CV',1,TRUE)
for (jjj in 1:par3) a<-table.element(a,paste('C',jjj,sep=''),1,TRUE)
a<-table.element(a,'CV',1,TRUE)
a<-table.row.end(a)
for (i in 1:10) {
ind <- sample(2, nrow(x), replace=T, prob=c(0.9,0.1))
m.ct <- ctree(as.formula(paste('as.factor(',colnames(x)[par1],') ~ .',sep='')),data =x[ind==1,])
if (i==1) {
m.ct.i.pred <- predict(m.ct, newdata=x[ind==1,])
m.ct.i.actu <- x[ind==1,par1]
m.ct.x.pred <- predict(m.ct, newdata=x[ind==2,])
m.ct.x.actu <- x[ind==2,par1]
} else {
m.ct.i.pred <- c(m.ct.i.pred,predict(m.ct, newdata=x[ind==1,]))
m.ct.i.actu <- c(m.ct.i.actu,x[ind==1,par1])
m.ct.x.pred <- c(m.ct.x.pred,predict(m.ct, newdata=x[ind==2,]))
m.ct.x.actu <- c(m.ct.x.actu,x[ind==2,par1])
}
}
print(m.ct.i.tab <- table(m.ct.i.actu,m.ct.i.pred))
numer <- 0
for (i in 1:par3) {
print(m.ct.i.tab[i,i] / sum(m.ct.i.tab[i,]))
numer <- numer + m.ct.i.tab[i,i]
}
print(m.ct.i.cp <- numer / sum(m.ct.i.tab))
print(m.ct.x.tab <- table(m.ct.x.actu,m.ct.x.pred))
numer <- 0
for (i in 1:par3) {
print(m.ct.x.tab[i,i] / sum(m.ct.x.tab[i,]))
numer <- numer + m.ct.x.tab[i,i]
}
print(m.ct.x.cp <- numer / sum(m.ct.x.tab))
for (i in 1:par3) {
a<-table.row.start(a)
a<-table.element(a,paste('C',i,sep=''),1,TRUE)
for (jjj in 1:par3) a<-table.element(a,m.ct.i.tab[i,jjj])
a<-table.element(a,round(m.ct.i.tab[i,i]/sum(m.ct.i.tab[i,]),4))
for (jjj in 1:par3) a<-table.element(a,m.ct.x.tab[i,jjj])
a<-table.element(a,round(m.ct.x.tab[i,i]/sum(m.ct.x.tab[i,]),4))
a<-table.row.end(a)
}
a<-table.row.start(a)
a<-table.element(a,'Overall',1,TRUE)
for (jjj in 1:par3) a<-table.element(a,'-')
a<-table.element(a,round(m.ct.i.cp,4))
for (jjj in 1:par3) a<-table.element(a,'-')
a<-table.element(a,round(m.ct.x.cp,4))
a<-table.row.end(a)
a<-table.end(a)
table.save(a,file='mytable3.tab')
}
}
m
bitmap(file='test1.png')
plot(m)
dev.off()
bitmap(file='test1a.png')
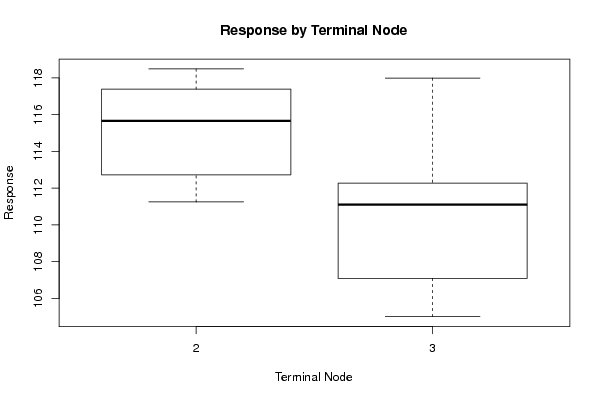
plot(x[,par1] ~ as.factor(where(m)),main='Response by Terminal Node',xlab='Terminal Node',ylab='Response')
dev.off()
if (par2 == 'none') {
forec <- predict(m)
result <- as.data.frame(cbind(x[,par1],forec,x[,par1]-forec))
colnames(result) <- c('Actuals','Forecasts','Residuals')
print(result)
}
if (par2 != 'none') {
print(cbind(as.factor(x[,par1]),predict(m)))
myt <- table(as.factor(x[,par1]),predict(m))
print(myt)
}
bitmap(file='test2.png')
if(par2=='none') {
op <- par(mfrow=c(2,2))
plot(density(result$Actuals),main='Kernel Density Plot of Actuals')
plot(density(result$Residuals),main='Kernel Density Plot of Residuals')
plot(result$Forecasts,result$Actuals,main='Actuals versus Predictions',xlab='Predictions',ylab='Actuals')
plot(density(result$Forecasts),main='Kernel Density Plot of Predictions')
par(op)
}
if(par2!='none') {
plot(myt,main='Confusion Matrix',xlab='Actual',ylab='Predicted')
}
dev.off()
if (par2 == 'none') {
detcoef <- cor(result$Forecasts,result$Actuals)
a<-table.start()
a<-table.row.start(a)
a<-table.element(a,'Goodness of Fit',2,TRUE)
a<-table.row.end(a)
a<-table.row.start(a)
a<-table.element(a,'Correlation',1,TRUE)
a<-table.element(a,round(detcoef,4))
a<-table.row.end(a)
a<-table.row.start(a)
a<-table.element(a,'R-squared',1,TRUE)
a<-table.element(a,round(detcoef*detcoef,4))
a<-table.row.end(a)
a<-table.row.start(a)
a<-table.element(a,'RMSE',1,TRUE)
a<-table.element(a,round(sqrt(mean((result$Residuals)^2)),4))
a<-table.row.end(a)
a<-table.end(a)
table.save(a,file='mytable1.tab')
a<-table.start()
a<-table.row.start(a)
a<-table.element(a,'Actuals, Predictions, and Residuals',4,TRUE)
a<-table.row.end(a)
a<-table.row.start(a)
a<-table.element(a,'#',header=TRUE)
a<-table.element(a,'Actuals',header=TRUE)
a<-table.element(a,'Forecasts',header=TRUE)
a<-table.element(a,'Residuals',header=TRUE)
a<-table.row.end(a)
for (i in 1:length(result$Actuals)) {
a<-table.row.start(a)
a<-table.element(a,i,header=TRUE)
a<-table.element(a,result$Actuals[i])
a<-table.element(a,result$Forecasts[i])
a<-table.element(a,result$Residuals[i])
a<-table.row.end(a)
}
a<-table.end(a)
table.save(a,file='mytable.tab')
}
if (par2 != 'none') {
a<-table.start()
a<-table.row.start(a)
a<-table.element(a,'Confusion Matrix (predicted in columns / actuals in rows)',par3+1,TRUE)
a<-table.row.end(a)
a<-table.row.start(a)
a<-table.element(a,'',1,TRUE)
for (i in 1:par3) {
a<-table.element(a,paste('C',i,sep=''),1,TRUE)
}
a<-table.row.end(a)
for (i in 1:par3) {
a<-table.row.start(a)
a<-table.element(a,paste('C',i,sep=''),1,TRUE)
for (j in 1:par3) {
a<-table.element(a,myt[i,j])
}
a<-table.row.end(a)
}
a<-table.end(a)
table.save(a,file='mytable2.tab')
}