Free Statistics
of Irreproducible Research!
Description of Statistical Computation | |||||||||||||||||||||||||||||||||||||||||||||
|---|---|---|---|---|---|---|---|---|---|---|---|---|---|---|---|---|---|---|---|---|---|---|---|---|---|---|---|---|---|---|---|---|---|---|---|---|---|---|---|---|---|---|---|---|---|
| Author's title | |||||||||||||||||||||||||||||||||||||||||||||
| Author | *The author of this computation has been verified* | ||||||||||||||||||||||||||||||||||||||||||||
| R Software Module | rwasp_regression_trees1.wasp | ||||||||||||||||||||||||||||||||||||||||||||
| Title produced by software | Recursive Partitioning (Regression Trees) | ||||||||||||||||||||||||||||||||||||||||||||
| Date of computation | Fri, 09 Dec 2011 14:38:35 -0500 | ||||||||||||||||||||||||||||||||||||||||||||
| Cite this page as follows | Statistical Computations at FreeStatistics.org, Office for Research Development and Education, URL https://freestatistics.org/blog/index.php?v=date/2011/Dec/09/t13234595801p9bx197b3dmi7p.htm/, Retrieved Thu, 02 May 2024 21:44:57 +0000 | ||||||||||||||||||||||||||||||||||||||||||||
| Statistical Computations at FreeStatistics.org, Office for Research Development and Education, URL https://freestatistics.org/blog/index.php?pk=153442, Retrieved Thu, 02 May 2024 21:44:57 +0000 | |||||||||||||||||||||||||||||||||||||||||||||
| QR Codes: | |||||||||||||||||||||||||||||||||||||||||||||
|
| |||||||||||||||||||||||||||||||||||||||||||||
| Original text written by user: | |||||||||||||||||||||||||||||||||||||||||||||
| IsPrivate? | No (this computation is public) | ||||||||||||||||||||||||||||||||||||||||||||
| User-defined keywords | |||||||||||||||||||||||||||||||||||||||||||||
| Estimated Impact | 125 | ||||||||||||||||||||||||||||||||||||||||||||
Tree of Dependent Computations | |||||||||||||||||||||||||||||||||||||||||||||
| Family? (F = Feedback message, R = changed R code, M = changed R Module, P = changed Parameters, D = changed Data) | |||||||||||||||||||||||||||||||||||||||||||||
| - [Recursive Partitioning (Regression Trees)] [] [2010-12-05 18:59:57] [b98453cac15ba1066b407e146608df68] - R PD [Recursive Partitioning (Regression Trees)] [Workshop 10 Recur...] [2011-12-09 18:45:00] [de8512d9b386046939a89973b76869e3] - R D [Recursive Partitioning (Regression Trees)] [Workshop 10 Recur...] [2011-12-09 19:18:30] [de8512d9b386046939a89973b76869e3] - R [Recursive Partitioning (Regression Trees)] [Workshop 10 Recur...] [2011-12-09 19:22:17] [de8512d9b386046939a89973b76869e3] - R D [Recursive Partitioning (Regression Trees)] [Workshop 10 Recur...] [2011-12-09 19:32:47] [de8512d9b386046939a89973b76869e3] - R [Recursive Partitioning (Regression Trees)] [Workshop 10 Recur...] [2011-12-09 19:38:35] [5c44e6aad476a1bab98fc6774eca4c08] [Current] - MP [Recursive Partitioning (Regression Trees)] [Paper SHW Recursi...] [2011-12-16 14:43:06] [74be16979710d4c4e7c6647856088456] - RMP [Multiple Regression] [Paper SHW MLR 2] [2011-12-16 14:52:16] [de8512d9b386046939a89973b76869e3] - R P [Recursive Partitioning (Regression Trees)] [Paper SHW Recursi...] [2011-12-16 14:58:20] [de8512d9b386046939a89973b76869e3] | |||||||||||||||||||||||||||||||||||||||||||||
| Feedback Forum | |||||||||||||||||||||||||||||||||||||||||||||
Post a new message | |||||||||||||||||||||||||||||||||||||||||||||
Dataset | |||||||||||||||||||||||||||||||||||||||||||||
| Dataseries X: | |||||||||||||||||||||||||||||||||||||||||||||
869 58 28 103 84786 98364 120982 2172 108 30 103 101193 96933 179321 901 49 22 51 38361 79234 123185 463 0 26 70 68504 42551 52746 371 1 18 22 22807 6853 33170 1495 86 44 148 71701 75851 173326 2187 104 40 124 80444 93163 258873 1491 63 34 70 53855 96037 180083 1036 82 23 66 99645 94728 135473 1882 115 36 134 114789 105499 202925 1220 50 25 84 65553 98958 153935 1289 83 39 156 97500 77900 132943 1812 105 33 110 77873 178812 221698 1731 114 43 158 90183 163253 260561 807 38 30 109 61542 27032 84853 1940 71 32 92 55813 86572 215641 1499 59 28 70 55461 85371 167542 2747 106 30 93 70106 120642 269651 2099 34 39 31 71570 78348 116408 918 20 26 66 33032 56968 78800 3373 115 39 133 139077 161632 277965 1713 85 33 113 71595 87850 150629 1438 76 28 100 72260 127969 168809 496 8 4 7 5950 15049 24188 744 21 18 61 32551 25109 65029 1161 30 14 41 31701 45824 101097 2694 92 28 102 120733 162647 233328 1769 75 28 99 73107 60622 206161 3148 128 38 129 132068 179566 311473 2474 105 23 62 149193 184301 235800 2084 55 36 73 46821 75661 177939 1954 56 32 114 87011 96144 207176 1389 72 25 70 55183 117286 174184 2269 75 36 116 73511 109377 187559 1268 118 23 74 78664 73631 119016 1943 77 40 138 70054 86767 182192 1762 66 40 151 74011 93487 194979 1857 116 33 115 93133 94552 275541 1502 73 34 104 225920 128754 182999 1441 99 30 108 62133 66363 135649 1416 53 22 69 43836 61724 120221 1317 30 26 99 38692 68580 145790 870 49 8 27 56622 55792 80953 2008 75 45 93 67267 129484 241066 1885 68 33 69 41140 87831 204713 1369 81 28 99 138599 136048 182613 2845 130 24 85 162901 186646 310839 1391 39 32 50 37510 64219 144966 602 13 19 64 43750 19630 43287 1743 74 20 31 40652 76825 155754 2014 109 31 92 85872 109427 201940 2143 151 32 106 89275 118168 235454 1401 54 31 114 120662 146304 224549 530 23 11 30 25162 24610 61857 387 4 0 0 855 6622 21054 1742 62 24 60 97068 115814 209641 449 18 8 9 14116 13155 31414 1606 64 40 140 110681 68847 184510 568 16 8 21 8773 13983 38214 1459 48 35 124 83209 65176 151101 1955 130 38 120 103487 180759 250579 1002 59 31 114 71220 100226 158015 956 32 28 78 56926 54454 85439 3604 95 40 141 115168 170745 351619 1035 14 30 101 111194 6940 84207 1701 70 32 90 51633 86839 165543 1249 19 27 36 75345 44830 141722 3352 91 31 97 98952 103300 299775 1369 135 41 148 123969 58106 104389 2201 87 32 105 135400 122422 199476 207 4 0 0 6023 7953 14688 151 7 0 0 1644 4245 7199 474 12 5 13 6179 21509 46660 141 0 1 4 3926 7670 17547 1318 46 24 46 73224 53608 152601 | |||||||||||||||||||||||||||||||||||||||||||||
Tables (Output of Computation) | |||||||||||||||||||||||||||||||||||||||||||||
| |||||||||||||||||||||||||||||||||||||||||||||
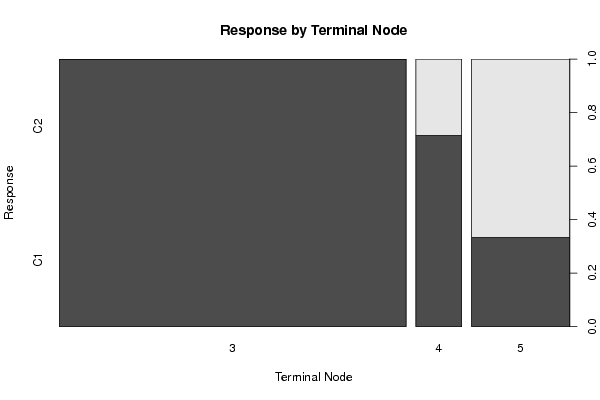
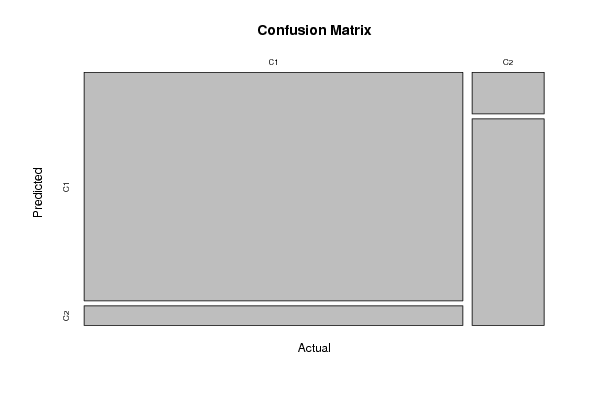
Figures (Output of Computation) | |||||||||||||||||||||||||||||||||||||||||||||
Input Parameters & R Code | |||||||||||||||||||||||||||||||||||||||||||||
| Parameters (Session): | |||||||||||||||||||||||||||||||||||||||||||||
| par1 = pearson ; par2 = equal ; par3 = 2 ; par4 = no ; | |||||||||||||||||||||||||||||||||||||||||||||
| Parameters (R input): | |||||||||||||||||||||||||||||||||||||||||||||
| par1 = 5 ; par2 = equal ; par3 = 2 ; par4 = no ; | |||||||||||||||||||||||||||||||||||||||||||||
| R code (references can be found in the software module): | |||||||||||||||||||||||||||||||||||||||||||||
library(party) | |||||||||||||||||||||||||||||||||||||||||||||