Free Statistics

of Irreproducible Research!

Author's title

Author*The author of this computation has been verified*
R Software Modulerwasp_arimabackwardselection.wasp
Title produced by softwareARIMA Backward Selection
Date of computationFri, 09 Dec 2011 09:26:36 -0500
Cite this page as followsStatistical Computations at FreeStatistics.org, Office for Research Development and Education, URL https://freestatistics.org/blog/index.php?v=date/2011/Dec/09/t1323440878k9rvypkuokhi22r.htm/, Retrieved Thu, 02 May 2024 21:01:32 +0000
Statistical Computations at FreeStatistics.org, Office for Research Development and Education, URL https://freestatistics.org/blog/index.php?pk=153389, Retrieved Thu, 02 May 2024 21:01:32 +0000
QR Codes:

Original text written by user:
IsPrivate?No (this computation is public)
User-defined keywords
Estimated Impact100
Family? (F = Feedback message, R = changed R code, M = changed R Module, P = changed Parameters, D = changed Data)
-     [Univariate Data Series] [] [2008-12-08 19:22:39] [d2d412c7f4d35ffbf5ee5ee89db327d4]
- RMPD  [ARIMA Backward Selection] [WS9 Wine Sales Au...] [2011-12-02 15:00:34] [9d4f280afcb4ecc352d7c6f913a0a151]
- R P     [ARIMA Backward Selection] [WS9 Wine Sales Au...] [2011-12-05 16:53:14] [9d4f280afcb4ecc352d7c6f913a0a151]
-   P         [ARIMA Backward Selection] [] [2011-12-09 14:26:36] [c897fb90cb9e1f725365d7e541ad7850] [Current]
Feedback Forum

Post a new message
Dataseries X:
2564
2820
3508
3088
3299
2939
3320
3418
3604
3495
4163
4882
2211
3260
2992
2425
2707
3244
3965
3315
3333
3583
4021
4904
2252
2952
3573
3048
3059
2731
3563
3092
3478
3478
4308
5029
2075
3264
3308
3688
3136
2824
3644
4694
2914
3686
4358
5587
2265
3685
3754
3708
3210
3517
3905
3670
4221
4404
5086
5725


Summary of computational transaction
Raw Inputview raw input (R code)
Raw Outputview raw output of R engine
Computing time5 seconds
R Server'George Udny Yule' @ yule.wessa.net

\begin{tabular}{lllllllll}
\hline
Summary of computational transaction \tabularnewline
Raw Input & view raw input (R code)  \tabularnewline
Raw Output & view raw output of R engine  \tabularnewline
Computing time & 5 seconds \tabularnewline
R Server & 'George Udny Yule' @ yule.wessa.net \tabularnewline
\hline
\end{tabular}
%Source: https://freestatistics.org/blog/index.php?pk=153389&T=0

[TABLE]
[ROW][C]Summary of computational transaction[/C][/ROW]
[ROW][C]Raw Input[/C][C]view raw input (R code) [/C][/ROW]
[ROW][C]Raw Output[/C][C]view raw output of R engine [/C][/ROW]
[ROW][C]Computing time[/C][C]5 seconds[/C][/ROW]
[ROW][C]R Server[/C][C]'George Udny Yule' @ yule.wessa.net[/C][/ROW]
[/TABLE]
Source: https://freestatistics.org/blog/index.php?pk=153389&T=0

Globally Unique Identifier (entire table): ba.freestatistics.org/blog/index.php?pk=153389&T=0

As an alternative you can also use a QR Code:  

The GUIDs for individual cells are displayed in the table below:

Summary of computational transaction
Raw Inputview raw input (R code)
Raw Outputview raw output of R engine
Computing time5 seconds
R Server'George Udny Yule' @ yule.wessa.net


ARIMA Parameter Estimation and Backward Selection
Iterationar1ar2ar3ma1sma1
Estimates ( 1 )0.81220.06170.1256-0.7792-0.9503
(p-val)(0 )(0.7473 )(0.4434 )(0 )(0.053 )
Estimates ( 2 )0.847800.1495-0.7831-0.8909
(p-val)(0 )(NA )(0.2713 )(0 )(1e-04 )
Estimates ( 3 )1.007900-0.8297-1
(p-val)(0 )(NA )(NA )(0 )(0.002 )
Estimates ( 4 )NANANANANA
(p-val)(NA )(NA )(NA )(NA )(NA )
Estimates ( 5 )NANANANANA
(p-val)(NA )(NA )(NA )(NA )(NA )
Estimates ( 6 )NANANANANA
(p-val)(NA )(NA )(NA )(NA )(NA )
Estimates ( 7 )NANANANANA
(p-val)(NA )(NA )(NA )(NA )(NA )
Estimates ( 8 )NANANANANA
(p-val)(NA )(NA )(NA )(NA )(NA )
Estimates ( 9 )NANANANANA
(p-val)(NA )(NA )(NA )(NA )(NA )

\begin{tabular}{lllllllll}
\hline
ARIMA Parameter Estimation and Backward Selection \tabularnewline
Iteration & ar1 & ar2 & ar3 & ma1 & sma1 \tabularnewline
Estimates ( 1 ) & 0.8122 & 0.0617 & 0.1256 & -0.7792 & -0.9503 \tabularnewline
(p-val) & (0 ) & (0.7473 ) & (0.4434 ) & (0 ) & (0.053 ) \tabularnewline
Estimates ( 2 ) & 0.8478 & 0 & 0.1495 & -0.7831 & -0.8909 \tabularnewline
(p-val) & (0 ) & (NA ) & (0.2713 ) & (0 ) & (1e-04 ) \tabularnewline
Estimates ( 3 ) & 1.0079 & 0 & 0 & -0.8297 & -1 \tabularnewline
(p-val) & (0 ) & (NA ) & (NA ) & (0 ) & (0.002 ) \tabularnewline
Estimates ( 4 ) & NA & NA & NA & NA & NA \tabularnewline
(p-val) & (NA ) & (NA ) & (NA ) & (NA ) & (NA ) \tabularnewline
Estimates ( 5 ) & NA & NA & NA & NA & NA \tabularnewline
(p-val) & (NA ) & (NA ) & (NA ) & (NA ) & (NA ) \tabularnewline
Estimates ( 6 ) & NA & NA & NA & NA & NA \tabularnewline
(p-val) & (NA ) & (NA ) & (NA ) & (NA ) & (NA ) \tabularnewline
Estimates ( 7 ) & NA & NA & NA & NA & NA \tabularnewline
(p-val) & (NA ) & (NA ) & (NA ) & (NA ) & (NA ) \tabularnewline
Estimates ( 8 ) & NA & NA & NA & NA & NA \tabularnewline
(p-val) & (NA ) & (NA ) & (NA ) & (NA ) & (NA ) \tabularnewline
Estimates ( 9 ) & NA & NA & NA & NA & NA \tabularnewline
(p-val) & (NA ) & (NA ) & (NA ) & (NA ) & (NA ) \tabularnewline
\hline
\end{tabular}
%Source: https://freestatistics.org/blog/index.php?pk=153389&T=1

[TABLE]
[ROW][C]ARIMA Parameter Estimation and Backward Selection[/C][/ROW]
[ROW][C]Iteration[/C][C]ar1[/C][C]ar2[/C][C]ar3[/C][C]ma1[/C][C]sma1[/C][/ROW]
[ROW][C]Estimates ( 1 )[/C][C]0.8122[/C][C]0.0617[/C][C]0.1256[/C][C]-0.7792[/C][C]-0.9503[/C][/ROW]
[ROW][C](p-val)[/C][C](0 )[/C][C](0.7473 )[/C][C](0.4434 )[/C][C](0 )[/C][C](0.053 )[/C][/ROW]
[ROW][C]Estimates ( 2 )[/C][C]0.8478[/C][C]0[/C][C]0.1495[/C][C]-0.7831[/C][C]-0.8909[/C][/ROW]
[ROW][C](p-val)[/C][C](0 )[/C][C](NA )[/C][C](0.2713 )[/C][C](0 )[/C][C](1e-04 )[/C][/ROW]
[ROW][C]Estimates ( 3 )[/C][C]1.0079[/C][C]0[/C][C]0[/C][C]-0.8297[/C][C]-1[/C][/ROW]
[ROW][C](p-val)[/C][C](0 )[/C][C](NA )[/C][C](NA )[/C][C](0 )[/C][C](0.002 )[/C][/ROW]
[ROW][C]Estimates ( 4 )[/C][C]NA[/C][C]NA[/C][C]NA[/C][C]NA[/C][C]NA[/C][/ROW]
[ROW][C](p-val)[/C][C](NA )[/C][C](NA )[/C][C](NA )[/C][C](NA )[/C][C](NA )[/C][/ROW]
[ROW][C]Estimates ( 5 )[/C][C]NA[/C][C]NA[/C][C]NA[/C][C]NA[/C][C]NA[/C][/ROW]
[ROW][C](p-val)[/C][C](NA )[/C][C](NA )[/C][C](NA )[/C][C](NA )[/C][C](NA )[/C][/ROW]
[ROW][C]Estimates ( 6 )[/C][C]NA[/C][C]NA[/C][C]NA[/C][C]NA[/C][C]NA[/C][/ROW]
[ROW][C](p-val)[/C][C](NA )[/C][C](NA )[/C][C](NA )[/C][C](NA )[/C][C](NA )[/C][/ROW]
[ROW][C]Estimates ( 7 )[/C][C]NA[/C][C]NA[/C][C]NA[/C][C]NA[/C][C]NA[/C][/ROW]
[ROW][C](p-val)[/C][C](NA )[/C][C](NA )[/C][C](NA )[/C][C](NA )[/C][C](NA )[/C][/ROW]
[ROW][C]Estimates ( 8 )[/C][C]NA[/C][C]NA[/C][C]NA[/C][C]NA[/C][C]NA[/C][/ROW]
[ROW][C](p-val)[/C][C](NA )[/C][C](NA )[/C][C](NA )[/C][C](NA )[/C][C](NA )[/C][/ROW]
[ROW][C]Estimates ( 9 )[/C][C]NA[/C][C]NA[/C][C]NA[/C][C]NA[/C][C]NA[/C][/ROW]
[ROW][C](p-val)[/C][C](NA )[/C][C](NA )[/C][C](NA )[/C][C](NA )[/C][C](NA )[/C][/ROW]
[/TABLE]
Source: https://freestatistics.org/blog/index.php?pk=153389&T=1

Globally Unique Identifier (entire table): ba.freestatistics.org/blog/index.php?pk=153389&T=1

As an alternative you can also use a QR Code:  

The GUIDs for individual cells are displayed in the table below:

ARIMA Parameter Estimation and Backward Selection
Iterationar1ar2ar3ma1sma1
Estimates ( 1 )0.81220.06170.1256-0.7792-0.9503
(p-val)(0 )(0.7473 )(0.4434 )(0 )(0.053 )
Estimates ( 2 )0.847800.1495-0.7831-0.8909
(p-val)(0 )(NA )(0.2713 )(0 )(1e-04 )
Estimates ( 3 )1.007900-0.8297-1
(p-val)(0 )(NA )(NA )(0 )(0.002 )
Estimates ( 4 )NANANANANA
(p-val)(NA )(NA )(NA )(NA )(NA )
Estimates ( 5 )NANANANANA
(p-val)(NA )(NA )(NA )(NA )(NA )
Estimates ( 6 )NANANANANA
(p-val)(NA )(NA )(NA )(NA )(NA )
Estimates ( 7 )NANANANANA
(p-val)(NA )(NA )(NA )(NA )(NA )
Estimates ( 8 )NANANANANA
(p-val)(NA )(NA )(NA )(NA )(NA )
Estimates ( 9 )NANANANANA
(p-val)(NA )(NA )(NA )(NA )(NA )


Estimated ARIMA Residuals
Value
4.8819878843243
-258.751259024571
346.215928976262
-390.49947121276
-437.49443485382
-431.21743710219
308.43563641244
608.587452685382
61.817556420972
-132.993967107619
55.5791525957142
-99.2768427161164
18.4783749530409
-60.8053755783492
-10.9241110416892
339.053041414406
296.212789040348
79.474525814438
-335.726702997579
-112.273145395385
-277.551811435239
30.6720710854779
-28.8646864390949
253.750168048822
142.0395051596
-190.862852453957
260.293895011335
-51.0742903972524
794.90614207069
52.0294476416749
-173.293623467736
-112.657509662026
1175.98939777496
-660.73234696708
60.305901435972
-85.8905396545869
442.582065433635
-172.309243509493
414.840417773983
140.948199340693
386.243057159444
-135.575223358671
263.28622585478
-80.8145835538483
-282.474551914923
519.102618048947
451.315010881975
517.075787258815
163.833072563007

\begin{tabular}{lllllllll}
\hline
Estimated ARIMA Residuals \tabularnewline
Value \tabularnewline
4.8819878843243 \tabularnewline
-258.751259024571 \tabularnewline
346.215928976262 \tabularnewline
-390.49947121276 \tabularnewline
-437.49443485382 \tabularnewline
-431.21743710219 \tabularnewline
308.43563641244 \tabularnewline
608.587452685382 \tabularnewline
61.817556420972 \tabularnewline
-132.993967107619 \tabularnewline
55.5791525957142 \tabularnewline
-99.2768427161164 \tabularnewline
18.4783749530409 \tabularnewline
-60.8053755783492 \tabularnewline
-10.9241110416892 \tabularnewline
339.053041414406 \tabularnewline
296.212789040348 \tabularnewline
79.474525814438 \tabularnewline
-335.726702997579 \tabularnewline
-112.273145395385 \tabularnewline
-277.551811435239 \tabularnewline
30.6720710854779 \tabularnewline
-28.8646864390949 \tabularnewline
253.750168048822 \tabularnewline
142.0395051596 \tabularnewline
-190.862852453957 \tabularnewline
260.293895011335 \tabularnewline
-51.0742903972524 \tabularnewline
794.90614207069 \tabularnewline
52.0294476416749 \tabularnewline
-173.293623467736 \tabularnewline
-112.657509662026 \tabularnewline
1175.98939777496 \tabularnewline
-660.73234696708 \tabularnewline
60.305901435972 \tabularnewline
-85.8905396545869 \tabularnewline
442.582065433635 \tabularnewline
-172.309243509493 \tabularnewline
414.840417773983 \tabularnewline
140.948199340693 \tabularnewline
386.243057159444 \tabularnewline
-135.575223358671 \tabularnewline
263.28622585478 \tabularnewline
-80.8145835538483 \tabularnewline
-282.474551914923 \tabularnewline
519.102618048947 \tabularnewline
451.315010881975 \tabularnewline
517.075787258815 \tabularnewline
163.833072563007 \tabularnewline
\hline
\end{tabular}
%Source: https://freestatistics.org/blog/index.php?pk=153389&T=2

[TABLE]
[ROW][C]Estimated ARIMA Residuals[/C][/ROW]
[ROW][C]Value[/C][/ROW]
[ROW][C]4.8819878843243[/C][/ROW]
[ROW][C]-258.751259024571[/C][/ROW]
[ROW][C]346.215928976262[/C][/ROW]
[ROW][C]-390.49947121276[/C][/ROW]
[ROW][C]-437.49443485382[/C][/ROW]
[ROW][C]-431.21743710219[/C][/ROW]
[ROW][C]308.43563641244[/C][/ROW]
[ROW][C]608.587452685382[/C][/ROW]
[ROW][C]61.817556420972[/C][/ROW]
[ROW][C]-132.993967107619[/C][/ROW]
[ROW][C]55.5791525957142[/C][/ROW]
[ROW][C]-99.2768427161164[/C][/ROW]
[ROW][C]18.4783749530409[/C][/ROW]
[ROW][C]-60.8053755783492[/C][/ROW]
[ROW][C]-10.9241110416892[/C][/ROW]
[ROW][C]339.053041414406[/C][/ROW]
[ROW][C]296.212789040348[/C][/ROW]
[ROW][C]79.474525814438[/C][/ROW]
[ROW][C]-335.726702997579[/C][/ROW]
[ROW][C]-112.273145395385[/C][/ROW]
[ROW][C]-277.551811435239[/C][/ROW]
[ROW][C]30.6720710854779[/C][/ROW]
[ROW][C]-28.8646864390949[/C][/ROW]
[ROW][C]253.750168048822[/C][/ROW]
[ROW][C]142.0395051596[/C][/ROW]
[ROW][C]-190.862852453957[/C][/ROW]
[ROW][C]260.293895011335[/C][/ROW]
[ROW][C]-51.0742903972524[/C][/ROW]
[ROW][C]794.90614207069[/C][/ROW]
[ROW][C]52.0294476416749[/C][/ROW]
[ROW][C]-173.293623467736[/C][/ROW]
[ROW][C]-112.657509662026[/C][/ROW]
[ROW][C]1175.98939777496[/C][/ROW]
[ROW][C]-660.73234696708[/C][/ROW]
[ROW][C]60.305901435972[/C][/ROW]
[ROW][C]-85.8905396545869[/C][/ROW]
[ROW][C]442.582065433635[/C][/ROW]
[ROW][C]-172.309243509493[/C][/ROW]
[ROW][C]414.840417773983[/C][/ROW]
[ROW][C]140.948199340693[/C][/ROW]
[ROW][C]386.243057159444[/C][/ROW]
[ROW][C]-135.575223358671[/C][/ROW]
[ROW][C]263.28622585478[/C][/ROW]
[ROW][C]-80.8145835538483[/C][/ROW]
[ROW][C]-282.474551914923[/C][/ROW]
[ROW][C]519.102618048947[/C][/ROW]
[ROW][C]451.315010881975[/C][/ROW]
[ROW][C]517.075787258815[/C][/ROW]
[ROW][C]163.833072563007[/C][/ROW]
[/TABLE]
Source: https://freestatistics.org/blog/index.php?pk=153389&T=2

Globally Unique Identifier (entire table): ba.freestatistics.org/blog/index.php?pk=153389&T=2

As an alternative you can also use a QR Code:  

The GUIDs for individual cells are displayed in the table below:

Estimated ARIMA Residuals
Value
4.8819878843243
-258.751259024571
346.215928976262
-390.49947121276
-437.49443485382
-431.21743710219
308.43563641244
608.587452685382
61.817556420972
-132.993967107619
55.5791525957142
-99.2768427161164
18.4783749530409
-60.8053755783492
-10.9241110416892
339.053041414406
296.212789040348
79.474525814438
-335.726702997579
-112.273145395385
-277.551811435239
30.6720710854779
-28.8646864390949
253.750168048822
142.0395051596
-190.862852453957
260.293895011335
-51.0742903972524
794.90614207069
52.0294476416749
-173.293623467736
-112.657509662026
1175.98939777496
-660.73234696708
60.305901435972
-85.8905396545869
442.582065433635
-172.309243509493
414.840417773983
140.948199340693
386.243057159444
-135.575223358671
263.28622585478
-80.8145835538483
-282.474551914923
519.102618048947
451.315010881975
517.075787258815
163.833072563007


Parameters (Session):
par1 = FALSE ; par2 = 1 ; par3 = 0 ; par4 = 1 ; par5 = 12 ; par6 = 3 ; par7 = 1 ; par8 = 0 ; par9 = 1 ;
Parameters (R input):
par1 = FALSE ; par2 = 1 ; par3 = 0 ; par4 = 1 ; par5 = 12 ; par6 = 3 ; par7 = 1 ; par8 = 0 ; par9 = 1 ;
R code (references can be found in the software module):
library(lattice)
if (par1 == 'TRUE') par1 <- TRUE
if (par1 == 'FALSE') par1 <- FALSE
par2 <- as.numeric(par2) #Box-Cox lambda transformation parameter
par3 <- as.numeric(par3) #degree of non-seasonal differencing
par4 <- as.numeric(par4) #degree of seasonal differencing
par5 <- as.numeric(par5) #seasonal period
par6 <- as.numeric(par6) #degree (p) of the non-seasonal AR(p) polynomial
par7 <- as.numeric(par7) #degree (q) of the non-seasonal MA(q) polynomial
par8 <- as.numeric(par8) #degree (P) of the seasonal AR(P) polynomial
par9 <- as.numeric(par9) #degree (Q) of the seasonal MA(Q) polynomial
armaGR <- function(arima.out, names, n){
try1 <- arima.out$coef
try2 <- sqrt(diag(arima.out$var.coef))
try.data.frame <- data.frame(matrix(NA,ncol=4,nrow=length(names)))
dimnames(try.data.frame) <- list(names,c('coef','std','tstat','pv'))
try.data.frame[,1] <- try1
for(i in 1:length(try2)) try.data.frame[which(rownames(try.data.frame)==names(try2)[i]),2] <- try2[i]
try.data.frame[,3] <- try.data.frame[,1] / try.data.frame[,2]
try.data.frame[,4] <- round((1-pt(abs(try.data.frame[,3]),df=n-(length(try2)+1)))*2,5)
vector <- rep(NA,length(names))
vector[is.na(try.data.frame[,4])] <- 0
maxi <- which.max(try.data.frame[,4])
continue <- max(try.data.frame[,4],na.rm=TRUE) > .05
vector[maxi] <- 0
list(summary=try.data.frame,next.vector=vector,continue=continue)
}
arimaSelect <- function(series, order=c(13,0,0), seasonal=list(order=c(2,0,0),period=12), include.mean=F){
nrc <- order[1]+order[3]+seasonal$order[1]+seasonal$order[3]
coeff <- matrix(NA, nrow=nrc*2, ncol=nrc)
pval <- matrix(NA, nrow=nrc*2, ncol=nrc)
mylist <- rep(list(NULL), nrc)
names <- NULL
if(order[1] > 0) names <- paste('ar',1:order[1],sep='')
if(order[3] > 0) names <- c( names , paste('ma',1:order[3],sep='') )
if(seasonal$order[1] > 0) names <- c(names, paste('sar',1:seasonal$order[1],sep=''))
if(seasonal$order[3] > 0) names <- c(names, paste('sma',1:seasonal$order[3],sep=''))
arima.out <- arima(series, order=order, seasonal=seasonal, include.mean=include.mean, method='ML')
mylist[[1]] <- arima.out
last.arma <- armaGR(arima.out, names, length(series))
mystop <- FALSE
i <- 1
coeff[i,] <- last.arma[[1]][,1]
pval [i,] <- last.arma[[1]][,4]
i <- 2
aic <- arima.out$aic
while(!mystop){
mylist[[i]] <- arima.out
arima.out <- arima(series, order=order, seasonal=seasonal, include.mean=include.mean, method='ML', fixed=last.arma$next.vector)
aic <- c(aic, arima.out$aic)
last.arma <- armaGR(arima.out, names, length(series))
mystop <- !last.arma$continue
coeff[i,] <- last.arma[[1]][,1]
pval [i,] <- last.arma[[1]][,4]
i <- i+1
}
list(coeff, pval, mylist, aic=aic)
}
arimaSelectplot <- function(arimaSelect.out,noms,choix){
noms <- names(arimaSelect.out[[3]][[1]]$coef)
coeff <- arimaSelect.out[[1]]
k <- min(which(is.na(coeff[,1])))-1
coeff <- coeff[1:k,]
pval <- arimaSelect.out[[2]][1:k,]
aic <- arimaSelect.out$aic[1:k]
coeff[coeff==0] <- NA
n <- ncol(coeff)
if(missing(choix)) choix <- k
layout(matrix(c(1,1,1,2,
3,3,3,2,
3,3,3,4,
5,6,7,7),nr=4),
widths=c(10,35,45,15),
heights=c(30,30,15,15))
couleurs <- rainbow(75)[1:50]#(50)
ticks <- pretty(coeff)
par(mar=c(1,1,3,1))
plot(aic,k:1-.5,type='o',pch=21,bg='blue',cex=2,axes=F,lty=2,xpd=NA)
points(aic[choix],k-choix+.5,pch=21,cex=4,bg=2,xpd=NA)
title('aic',line=2)
par(mar=c(3,0,0,0))
plot(0,axes=F,xlab='',ylab='',xlim=range(ticks),ylim=c(.1,1))
rect(xleft = min(ticks) + (0:49)/50*(max(ticks)-min(ticks)),
xright = min(ticks) + (1:50)/50*(max(ticks)-min(ticks)),
ytop = rep(1,50),
ybottom= rep(0,50),col=couleurs,border=NA)
axis(1,ticks)
rect(xleft=min(ticks),xright=max(ticks),ytop=1,ybottom=0)
text(mean(coeff,na.rm=T),.5,'coefficients',cex=2,font=2)
par(mar=c(1,1,3,1))
image(1:n,1:k,t(coeff[k:1,]),axes=F,col=couleurs,zlim=range(ticks))
for(i in 1:n) for(j in 1:k) if(!is.na(coeff[j,i])) {
if(pval[j,i]<.01) symb = 'green'
else if( (pval[j,i]<.05) & (pval[j,i]>=.01)) symb = 'orange'
else if( (pval[j,i]<.1) & (pval[j,i]>=.05)) symb = 'red'
else symb = 'black'
polygon(c(i+.5 ,i+.2 ,i+.5 ,i+.5),
c(k-j+0.5,k-j+0.5,k-j+0.8,k-j+0.5),
col=symb)
if(j==choix) {
rect(xleft=i-.5,
xright=i+.5,
ybottom=k-j+1.5,
ytop=k-j+.5,
lwd=4)
text(i,
k-j+1,
round(coeff[j,i],2),
cex=1.2,
font=2)
}
else{
rect(xleft=i-.5,xright=i+.5,ybottom=k-j+1.5,ytop=k-j+.5)
text(i,k-j+1,round(coeff[j,i],2),cex=1.2,font=1)
}
}
axis(3,1:n,noms)
par(mar=c(0.5,0,0,0.5))
plot(0,axes=F,xlab='',ylab='',type='n',xlim=c(0,8),ylim=c(-.2,.8))
cols <- c('green','orange','red','black')
niv <- c('0','0.01','0.05','0.1')
for(i in 0:3){
polygon(c(1+2*i ,1+2*i ,1+2*i-.5 ,1+2*i),
c(.4 ,.7 , .4 , .4),
col=cols[i+1])
text(2*i,0.5,niv[i+1],cex=1.5)
}
text(8,.5,1,cex=1.5)
text(4,0,'p-value',cex=2)
box()
residus <- arimaSelect.out[[3]][[choix]]$res
par(mar=c(1,2,4,1))
acf(residus,main='')
title('acf',line=.5)
par(mar=c(1,2,4,1))
pacf(residus,main='')
title('pacf',line=.5)
par(mar=c(2,2,4,1))
qqnorm(residus,main='')
title('qq-norm',line=.5)
qqline(residus)
residus
}
if (par2 == 0) x <- log(x)
if (par2 != 0) x <- x^par2
(selection <- arimaSelect(x, order=c(par6,par3,par7), seasonal=list(order=c(par8,par4,par9), period=par5)))
bitmap(file='test1.png')
resid <- arimaSelectplot(selection)
dev.off()
resid
bitmap(file='test2.png')
acf(resid,length(resid)/2, main='Residual Autocorrelation Function')
dev.off()
bitmap(file='test3.png')
pacf(resid,length(resid)/2, main='Residual Partial Autocorrelation Function')
dev.off()
bitmap(file='test4.png')
cpgram(resid, main='Residual Cumulative Periodogram')
dev.off()
bitmap(file='test5.png')
hist(resid, main='Residual Histogram', xlab='values of Residuals')
dev.off()
bitmap(file='test6.png')
densityplot(~resid,col='black',main='Residual Density Plot', xlab='values of Residuals')
dev.off()
bitmap(file='test7.png')
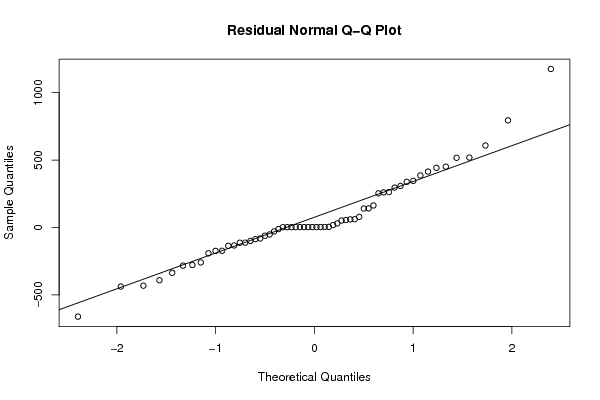
qqnorm(resid, main='Residual Normal Q-Q Plot')
qqline(resid)
dev.off()
ncols <- length(selection[[1]][1,])
nrows <- length(selection[[2]][,1])-1
load(file='createtable')
a<-table.start()
a<-table.row.start(a)
a<-table.element(a,'ARIMA Parameter Estimation and Backward Selection', ncols+1,TRUE)
a<-table.row.end(a)
a<-table.row.start(a)
a<-table.element(a,'Iteration', header=TRUE)
for (i in 1:ncols) {
a<-table.element(a,names(selection[[3]][[1]]$coef)[i],header=TRUE)
}
a<-table.row.end(a)
for (j in 1:nrows) {
a<-table.row.start(a)
mydum <- 'Estimates ('
mydum <- paste(mydum,j)
mydum <- paste(mydum,')')
a<-table.element(a,mydum, header=TRUE)
for (i in 1:ncols) {
a<-table.element(a,round(selection[[1]][j,i],4))
}
a<-table.row.end(a)
a<-table.row.start(a)
a<-table.element(a,'(p-val)', header=TRUE)
for (i in 1:ncols) {
mydum <- '('
mydum <- paste(mydum,round(selection[[2]][j,i],4),sep='')
mydum <- paste(mydum,')')
a<-table.element(a,mydum)
}
a<-table.row.end(a)
}
a<-table.end(a)
table.save(a,file='mytable.tab')
a<-table.start()
a<-table.row.start(a)
a<-table.element(a,'Estimated ARIMA Residuals', 1,TRUE)
a<-table.row.end(a)
a<-table.row.start(a)
a<-table.element(a,'Value', 1,TRUE)
a<-table.row.end(a)
for (i in (par4*par5+par3):length(resid)) {
a<-table.row.start(a)
a<-table.element(a,resid[i])
a<-table.row.end(a)
}
a<-table.end(a)
table.save(a,file='mytable1.tab')