Free Statistics

of Irreproducible Research!

Author's title

Author*The author of this computation has been verified*
R Software Modulerwasp_multipleregression.wasp
Title produced by softwareMultiple Regression
Date of computationFri, 09 Dec 2011 08:16:10 -0500
Cite this page as followsStatistical Computations at FreeStatistics.org, Office for Research Development and Education, URL https://freestatistics.org/blog/index.php?v=date/2011/Dec/09/t1323437085hlpll5reqn28zop.htm/, Retrieved Thu, 02 May 2024 21:03:18 +0000
Statistical Computations at FreeStatistics.org, Office for Research Development and Education, URL https://freestatistics.org/blog/index.php?pk=153341, Retrieved Thu, 02 May 2024 21:03:18 +0000
QR Codes:

Original text written by user:
IsPrivate?No (this computation is public)
User-defined keywords
Estimated Impact169
Family? (F = Feedback message, R = changed R code, M = changed R Module, P = changed Parameters, D = changed Data)
-     [Kendall tau Correlation Matrix] [] [2010-12-05 18:04:16] [b98453cac15ba1066b407e146608df68]
- R PD  [Kendall tau Correlation Matrix] [Workshop 10, Kend...] [2010-12-10 12:56:11] [3635fb7041b1998c5a1332cf9de22bce]
- RMPD      [Multiple Regression] [] [2011-12-09 13:16:10] [f8ac047da1b1db86cbd9837decfb2b34] [Current]
Feedback Forum

Post a new message
Dataseries X:
235.1	46
280.7	62
264.6	66
240.7	59
201.4	58
240.8	61
241.1	41
223.8	27
206.1	58
174.7	70
203.3	49
220.5	59
299.5	44
347.4	36
338.3	72
327.7	45
351.6	56
396.6	54
438.8	53
395.6	35
363.5	61
378.8	52
357	47
369	51
464.8	52
479.1	63
431.3	74
366.5	45
326.3	51
355.1	64
331.6	36
261.3	30
249	55
205.5	64
235.6	39
240.9	40
264.9	63
253.8	45
232.3	59
193.8	55
177	40
213.2	64
207.2	27
180.6	28
188.6	45
175.4	57
199	45
179.6	69
225.8	60
234	56
200.2	58
183.6	50
178.2	51
203.2	53
208.5	37
191.8	22
172.8	55
148	70
159.4	62
154.5	58
213.2	39
196.4	49
182.8	58
176.4	47
153.6	42
173.2	62
171	39
151.2	40
161.9	72
157.2	70
201.7	54
236.4	65


Summary of computational transaction
Raw Inputview raw input (R code)
Raw Outputview raw output of R engine
Computing time5 seconds
R Server'George Udny Yule' @ yule.wessa.net

\begin{tabular}{lllllllll}
\hline
Summary of computational transaction \tabularnewline
Raw Input & view raw input (R code)  \tabularnewline
Raw Output & view raw output of R engine  \tabularnewline
Computing time & 5 seconds \tabularnewline
R Server & 'George Udny Yule' @ yule.wessa.net \tabularnewline
\hline
\end{tabular}
%Source: https://freestatistics.org/blog/index.php?pk=153341&T=0

[TABLE]
[ROW][C]Summary of computational transaction[/C][/ROW]
[ROW][C]Raw Input[/C][C]view raw input (R code) [/C][/ROW]
[ROW][C]Raw Output[/C][C]view raw output of R engine [/C][/ROW]
[ROW][C]Computing time[/C][C]5 seconds[/C][/ROW]
[ROW][C]R Server[/C][C]'George Udny Yule' @ yule.wessa.net[/C][/ROW]
[/TABLE]
Source: https://freestatistics.org/blog/index.php?pk=153341&T=0

Globally Unique Identifier (entire table): ba.freestatistics.org/blog/index.php?pk=153341&T=0

As an alternative you can also use a QR Code:  

The GUIDs for individual cells are displayed in the table below:

Summary of computational transaction
Raw Inputview raw input (R code)
Raw Outputview raw output of R engine
Computing time5 seconds
R Server'George Udny Yule' @ yule.wessa.net


Multiple Linear Regression - Estimated Regression Equation
werkloosheid[t] = + 237.570666666667 + 0.224248062015504faillissementen[t] + e[t]

\begin{tabular}{lllllllll}
\hline
Multiple Linear Regression - Estimated Regression Equation \tabularnewline
werkloosheid[t] =  +  237.570666666667 +  0.224248062015504faillissementen[t]  + e[t] \tabularnewline
\hline
\end{tabular}
%Source: https://freestatistics.org/blog/index.php?pk=153341&T=1

[TABLE]
[ROW][C]Multiple Linear Regression - Estimated Regression Equation[/C][/ROW]
[ROW][C]werkloosheid[t] =  +  237.570666666667 +  0.224248062015504faillissementen[t]  + e[t][/C][/ROW]
[/TABLE]
Source: https://freestatistics.org/blog/index.php?pk=153341&T=1

Globally Unique Identifier (entire table): ba.freestatistics.org/blog/index.php?pk=153341&T=1

As an alternative you can also use a QR Code:  

The GUIDs for individual cells are displayed in the table below:

Multiple Linear Regression - Estimated Regression Equation
werkloosheid[t] = + 237.570666666667 + 0.224248062015504faillissementen[t] + e[t]


Multiple Linear Regression - Ordinary Least Squares
VariableParameterS.D.T-STATH0: parameter = 02-tail p-value1-tail p-value
(Intercept)237.57066666666744.627735.32341e-061e-06
faillissementen0.2242480620155040.8369270.26790.7895320.394766

\begin{tabular}{lllllllll}
\hline
Multiple Linear Regression - Ordinary Least Squares \tabularnewline
Variable & Parameter & S.D. & T-STATH0: parameter = 0 & 2-tail p-value & 1-tail p-value \tabularnewline
(Intercept) & 237.570666666667 & 44.62773 & 5.3234 & 1e-06 & 1e-06 \tabularnewline
faillissementen & 0.224248062015504 & 0.836927 & 0.2679 & 0.789532 & 0.394766 \tabularnewline
\hline
\end{tabular}
%Source: https://freestatistics.org/blog/index.php?pk=153341&T=2

[TABLE]
[ROW][C]Multiple Linear Regression - Ordinary Least Squares[/C][/ROW]
[ROW][C]Variable[/C][C]Parameter[/C][C]S.D.[/C][C]T-STATH0: parameter = 0[/C][C]2-tail p-value[/C][C]1-tail p-value[/C][/ROW]
[ROW][C](Intercept)[/C][C]237.570666666667[/C][C]44.62773[/C][C]5.3234[/C][C]1e-06[/C][C]1e-06[/C][/ROW]
[ROW][C]faillissementen[/C][C]0.224248062015504[/C][C]0.836927[/C][C]0.2679[/C][C]0.789532[/C][C]0.394766[/C][/ROW]
[/TABLE]
Source: https://freestatistics.org/blog/index.php?pk=153341&T=2

Globally Unique Identifier (entire table): ba.freestatistics.org/blog/index.php?pk=153341&T=2

As an alternative you can also use a QR Code:  

The GUIDs for individual cells are displayed in the table below:

Multiple Linear Regression - Ordinary Least Squares
VariableParameterS.D.T-STATH0: parameter = 02-tail p-value1-tail p-value
(Intercept)237.57066666666744.627735.32341e-061e-06
faillissementen0.2242480620155040.8369270.26790.7895320.394766


Multiple Linear Regression - Regression Statistics
Multiple R0.0320087974158807
R-squared0.00102456311201089
Adjusted R-squared-0.0132465145578173
F-TEST (value)0.071792974273905
F-TEST (DF numerator)1
F-TEST (DF denominator)70
p-value0.789531853278938
Multiple Linear Regression - Residual Statistics
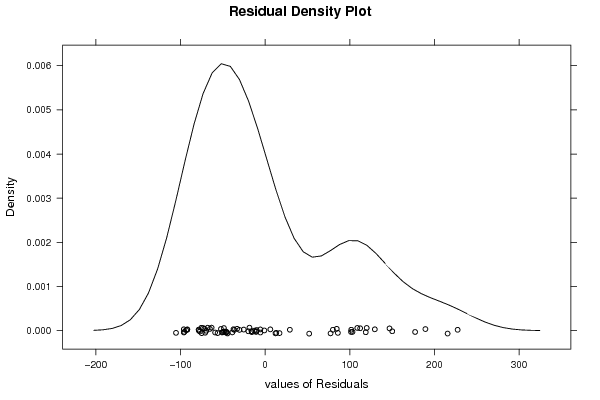
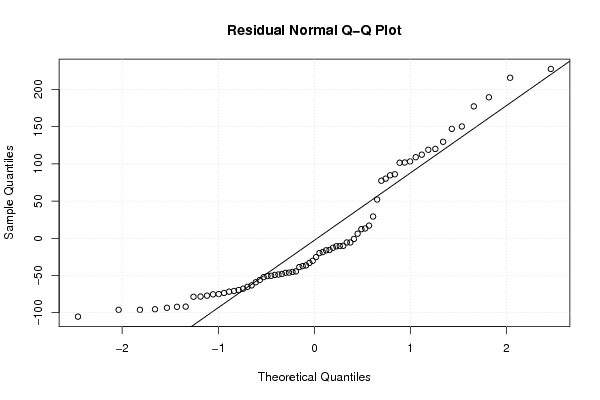
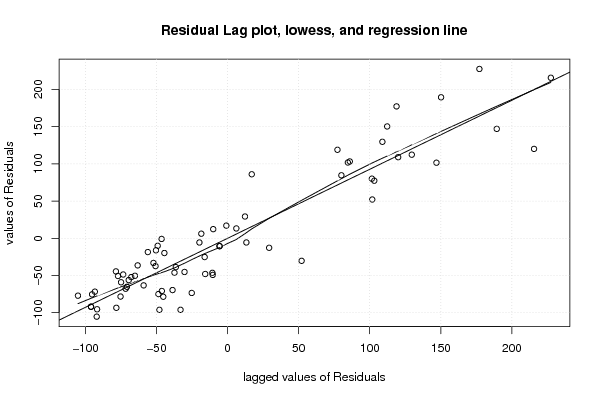
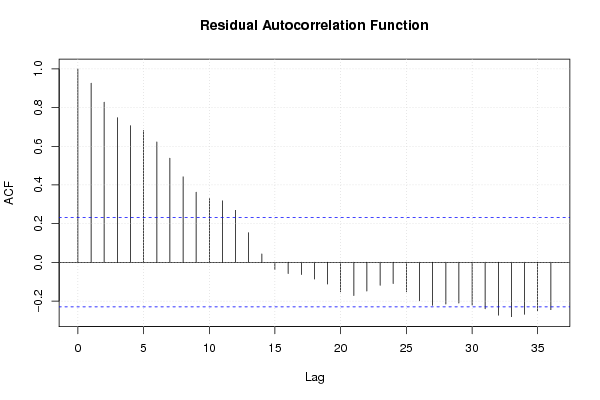
Residual Standard Deviation85.131900109778
Sum Squared Residuals507320.829141085

\begin{tabular}{lllllllll}
\hline
Multiple Linear Regression - Regression Statistics \tabularnewline
Multiple R & 0.0320087974158807 \tabularnewline
R-squared & 0.00102456311201089 \tabularnewline
Adjusted R-squared & -0.0132465145578173 \tabularnewline
F-TEST (value) & 0.071792974273905 \tabularnewline
F-TEST (DF numerator) & 1 \tabularnewline
F-TEST (DF denominator) & 70 \tabularnewline
p-value & 0.789531853278938 \tabularnewline
Multiple Linear Regression - Residual Statistics \tabularnewline
Residual Standard Deviation & 85.131900109778 \tabularnewline
Sum Squared Residuals & 507320.829141085 \tabularnewline
\hline
\end{tabular}
%Source: https://freestatistics.org/blog/index.php?pk=153341&T=3

[TABLE]
[ROW][C]Multiple Linear Regression - Regression Statistics[/C][/ROW]
[ROW][C]Multiple R[/C][C]0.0320087974158807[/C][/ROW]
[ROW][C]R-squared[/C][C]0.00102456311201089[/C][/ROW]
[ROW][C]Adjusted R-squared[/C][C]-0.0132465145578173[/C][/ROW]
[ROW][C]F-TEST (value)[/C][C]0.071792974273905[/C][/ROW]
[ROW][C]F-TEST (DF numerator)[/C][C]1[/C][/ROW]
[ROW][C]F-TEST (DF denominator)[/C][C]70[/C][/ROW]
[ROW][C]p-value[/C][C]0.789531853278938[/C][/ROW]
[ROW][C]Multiple Linear Regression - Residual Statistics[/C][/ROW]
[ROW][C]Residual Standard Deviation[/C][C]85.131900109778[/C][/ROW]
[ROW][C]Sum Squared Residuals[/C][C]507320.829141085[/C][/ROW]
[/TABLE]
Source: https://freestatistics.org/blog/index.php?pk=153341&T=3

Globally Unique Identifier (entire table): ba.freestatistics.org/blog/index.php?pk=153341&T=3

As an alternative you can also use a QR Code:  

The GUIDs for individual cells are displayed in the table below:

Multiple Linear Regression - Regression Statistics
Multiple R0.0320087974158807
R-squared0.00102456311201089
Adjusted R-squared-0.0132465145578173
F-TEST (value)0.071792974273905
F-TEST (DF numerator)1
F-TEST (DF denominator)70
p-value0.789531853278938
Multiple Linear Regression - Residual Statistics
Residual Standard Deviation85.131900109778
Sum Squared Residuals507320.829141085


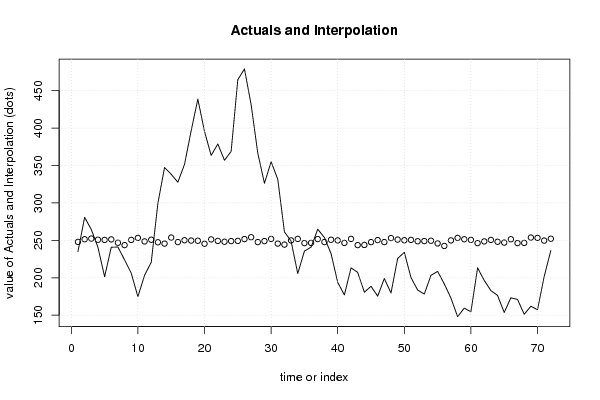
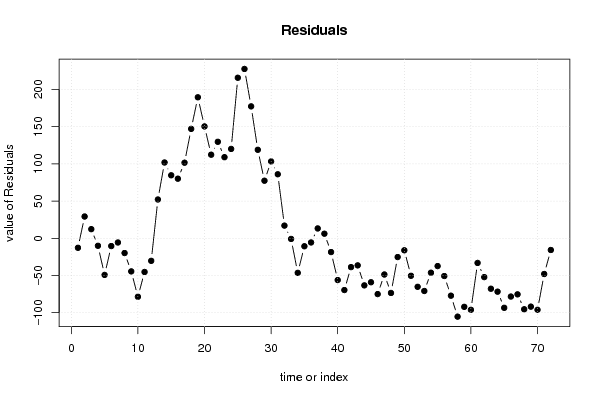
Multiple Linear Regression - Actuals, Interpolation, and Residuals
Time or IndexActualsInterpolationForecastResidualsPrediction Error
1235.1247.88607751938-12.7860775193797
2280.7251.47404651162829.2259534883721
3264.6252.3710387596912.2289612403101
4240.7250.801302325581-10.1013023255814
5201.4250.577054263566-49.1770542635659
6240.8251.249798449612-10.4497984496124
7241.1246.764837209302-5.66483720930234
8223.8243.625364341085-19.8253643410853
9206.1250.577054263566-44.4770542635659
10174.7253.268031007752-78.568031007752
11203.3248.558821705426-45.2588217054263
12220.5250.801302325581-30.3013023255814
13299.5247.43758139534952.0624186046512
14347.4245.643596899225101.756403100775
15338.3253.71652713178384.583472868217
16327.7247.66182945736480.0381705426356
17351.6250.128558139535101.471441860465
18396.6249.680062015504146.919937984496
19438.8249.455813953488189.344186046512
20395.6245.419348837209150.180651162791
21363.5251.249798449612112.250201550388
22378.8249.231565891473129.568434108527
23357248.110325581395108.889674418605
24369249.007317829457119.992682170543
25464.8249.231565891473215.568434108527
26479.1251.698294573643227.401705426357
27431.3254.165023255814177.134976744186
28366.5247.661829457364118.838170542636
29326.3249.00731782945777.2926821705426
30355.1251.922542635659103.177457364341
31331.6245.64359689922585.9564031007752
32261.3244.29810852713217.0018914728682
33249249.904310077519-0.904310077519387
34205.5251.922542635659-46.4225426356589
35235.6246.316341085271-10.7163410852713
36240.9246.540589147287-5.64058914728682
37264.9251.69829457364313.2017054263566
38253.8247.6618294573646.13817054263566
39232.3250.801302325581-18.5013023255814
40193.8249.904310077519-56.1043100775194
41177246.540589147287-69.5405891472868
42213.2251.922542635659-38.7225426356589
43207.2243.625364341085-36.4253643410853
44180.6243.849612403101-63.2496124031008
45188.6247.661829457364-59.0618294573644
46175.4250.35280620155-74.9528062015504
47199247.661829457364-48.6618294573643
48179.6253.043782945736-73.4437829457364
49225.8251.025550387597-25.2255503875969
50234250.128558139535-16.1285581395349
51200.2250.577054263566-50.3770542635659
52183.6248.783069767442-65.1830697674419
53178.2249.007317829457-70.8073178294574
54203.2249.455813953488-46.2558139534884
55208.5245.86784496124-37.3678449612403
56191.8242.504124031008-50.7041240310078
57172.8249.904310077519-77.1043100775194
58148253.268031007752-105.268031007752
59159.4251.474046511628-92.0740465116279
60154.5250.577054263566-96.0770542635659
61213.2246.316341085271-33.1163410852713
62196.4248.558821705426-52.1588217054264
63182.8250.577054263566-67.7770542635659
64176.4248.110325581395-71.7103255813954
65153.6246.989085271318-93.3890852713178
66173.2251.474046511628-78.274046511628
67171246.316341085271-75.3163410852713
68151.2246.540589147287-95.3405891472868
69161.9253.716527131783-91.816527131783
70157.2253.268031007752-96.068031007752
71201.7249.680062015504-47.9800620155039
72236.4252.146790697674-15.7467906976744

\begin{tabular}{lllllllll}
\hline
Multiple Linear Regression - Actuals, Interpolation, and Residuals \tabularnewline
Time or Index & Actuals & InterpolationForecast & ResidualsPrediction Error \tabularnewline
1 & 235.1 & 247.88607751938 & -12.7860775193797 \tabularnewline
2 & 280.7 & 251.474046511628 & 29.2259534883721 \tabularnewline
3 & 264.6 & 252.37103875969 & 12.2289612403101 \tabularnewline
4 & 240.7 & 250.801302325581 & -10.1013023255814 \tabularnewline
5 & 201.4 & 250.577054263566 & -49.1770542635659 \tabularnewline
6 & 240.8 & 251.249798449612 & -10.4497984496124 \tabularnewline
7 & 241.1 & 246.764837209302 & -5.66483720930234 \tabularnewline
8 & 223.8 & 243.625364341085 & -19.8253643410853 \tabularnewline
9 & 206.1 & 250.577054263566 & -44.4770542635659 \tabularnewline
10 & 174.7 & 253.268031007752 & -78.568031007752 \tabularnewline
11 & 203.3 & 248.558821705426 & -45.2588217054263 \tabularnewline
12 & 220.5 & 250.801302325581 & -30.3013023255814 \tabularnewline
13 & 299.5 & 247.437581395349 & 52.0624186046512 \tabularnewline
14 & 347.4 & 245.643596899225 & 101.756403100775 \tabularnewline
15 & 338.3 & 253.716527131783 & 84.583472868217 \tabularnewline
16 & 327.7 & 247.661829457364 & 80.0381705426356 \tabularnewline
17 & 351.6 & 250.128558139535 & 101.471441860465 \tabularnewline
18 & 396.6 & 249.680062015504 & 146.919937984496 \tabularnewline
19 & 438.8 & 249.455813953488 & 189.344186046512 \tabularnewline
20 & 395.6 & 245.419348837209 & 150.180651162791 \tabularnewline
21 & 363.5 & 251.249798449612 & 112.250201550388 \tabularnewline
22 & 378.8 & 249.231565891473 & 129.568434108527 \tabularnewline
23 & 357 & 248.110325581395 & 108.889674418605 \tabularnewline
24 & 369 & 249.007317829457 & 119.992682170543 \tabularnewline
25 & 464.8 & 249.231565891473 & 215.568434108527 \tabularnewline
26 & 479.1 & 251.698294573643 & 227.401705426357 \tabularnewline
27 & 431.3 & 254.165023255814 & 177.134976744186 \tabularnewline
28 & 366.5 & 247.661829457364 & 118.838170542636 \tabularnewline
29 & 326.3 & 249.007317829457 & 77.2926821705426 \tabularnewline
30 & 355.1 & 251.922542635659 & 103.177457364341 \tabularnewline
31 & 331.6 & 245.643596899225 & 85.9564031007752 \tabularnewline
32 & 261.3 & 244.298108527132 & 17.0018914728682 \tabularnewline
33 & 249 & 249.904310077519 & -0.904310077519387 \tabularnewline
34 & 205.5 & 251.922542635659 & -46.4225426356589 \tabularnewline
35 & 235.6 & 246.316341085271 & -10.7163410852713 \tabularnewline
36 & 240.9 & 246.540589147287 & -5.64058914728682 \tabularnewline
37 & 264.9 & 251.698294573643 & 13.2017054263566 \tabularnewline
38 & 253.8 & 247.661829457364 & 6.13817054263566 \tabularnewline
39 & 232.3 & 250.801302325581 & -18.5013023255814 \tabularnewline
40 & 193.8 & 249.904310077519 & -56.1043100775194 \tabularnewline
41 & 177 & 246.540589147287 & -69.5405891472868 \tabularnewline
42 & 213.2 & 251.922542635659 & -38.7225426356589 \tabularnewline
43 & 207.2 & 243.625364341085 & -36.4253643410853 \tabularnewline
44 & 180.6 & 243.849612403101 & -63.2496124031008 \tabularnewline
45 & 188.6 & 247.661829457364 & -59.0618294573644 \tabularnewline
46 & 175.4 & 250.35280620155 & -74.9528062015504 \tabularnewline
47 & 199 & 247.661829457364 & -48.6618294573643 \tabularnewline
48 & 179.6 & 253.043782945736 & -73.4437829457364 \tabularnewline
49 & 225.8 & 251.025550387597 & -25.2255503875969 \tabularnewline
50 & 234 & 250.128558139535 & -16.1285581395349 \tabularnewline
51 & 200.2 & 250.577054263566 & -50.3770542635659 \tabularnewline
52 & 183.6 & 248.783069767442 & -65.1830697674419 \tabularnewline
53 & 178.2 & 249.007317829457 & -70.8073178294574 \tabularnewline
54 & 203.2 & 249.455813953488 & -46.2558139534884 \tabularnewline
55 & 208.5 & 245.86784496124 & -37.3678449612403 \tabularnewline
56 & 191.8 & 242.504124031008 & -50.7041240310078 \tabularnewline
57 & 172.8 & 249.904310077519 & -77.1043100775194 \tabularnewline
58 & 148 & 253.268031007752 & -105.268031007752 \tabularnewline
59 & 159.4 & 251.474046511628 & -92.0740465116279 \tabularnewline
60 & 154.5 & 250.577054263566 & -96.0770542635659 \tabularnewline
61 & 213.2 & 246.316341085271 & -33.1163410852713 \tabularnewline
62 & 196.4 & 248.558821705426 & -52.1588217054264 \tabularnewline
63 & 182.8 & 250.577054263566 & -67.7770542635659 \tabularnewline
64 & 176.4 & 248.110325581395 & -71.7103255813954 \tabularnewline
65 & 153.6 & 246.989085271318 & -93.3890852713178 \tabularnewline
66 & 173.2 & 251.474046511628 & -78.274046511628 \tabularnewline
67 & 171 & 246.316341085271 & -75.3163410852713 \tabularnewline
68 & 151.2 & 246.540589147287 & -95.3405891472868 \tabularnewline
69 & 161.9 & 253.716527131783 & -91.816527131783 \tabularnewline
70 & 157.2 & 253.268031007752 & -96.068031007752 \tabularnewline
71 & 201.7 & 249.680062015504 & -47.9800620155039 \tabularnewline
72 & 236.4 & 252.146790697674 & -15.7467906976744 \tabularnewline
\hline
\end{tabular}
%Source: https://freestatistics.org/blog/index.php?pk=153341&T=4

[TABLE]
[ROW][C]Multiple Linear Regression - Actuals, Interpolation, and Residuals[/C][/ROW]
[ROW][C]Time or Index[/C][C]Actuals[/C][C]InterpolationForecast[/C][C]ResidualsPrediction Error[/C][/ROW]
[ROW][C]1[/C][C]235.1[/C][C]247.88607751938[/C][C]-12.7860775193797[/C][/ROW]
[ROW][C]2[/C][C]280.7[/C][C]251.474046511628[/C][C]29.2259534883721[/C][/ROW]
[ROW][C]3[/C][C]264.6[/C][C]252.37103875969[/C][C]12.2289612403101[/C][/ROW]
[ROW][C]4[/C][C]240.7[/C][C]250.801302325581[/C][C]-10.1013023255814[/C][/ROW]
[ROW][C]5[/C][C]201.4[/C][C]250.577054263566[/C][C]-49.1770542635659[/C][/ROW]
[ROW][C]6[/C][C]240.8[/C][C]251.249798449612[/C][C]-10.4497984496124[/C][/ROW]
[ROW][C]7[/C][C]241.1[/C][C]246.764837209302[/C][C]-5.66483720930234[/C][/ROW]
[ROW][C]8[/C][C]223.8[/C][C]243.625364341085[/C][C]-19.8253643410853[/C][/ROW]
[ROW][C]9[/C][C]206.1[/C][C]250.577054263566[/C][C]-44.4770542635659[/C][/ROW]
[ROW][C]10[/C][C]174.7[/C][C]253.268031007752[/C][C]-78.568031007752[/C][/ROW]
[ROW][C]11[/C][C]203.3[/C][C]248.558821705426[/C][C]-45.2588217054263[/C][/ROW]
[ROW][C]12[/C][C]220.5[/C][C]250.801302325581[/C][C]-30.3013023255814[/C][/ROW]
[ROW][C]13[/C][C]299.5[/C][C]247.437581395349[/C][C]52.0624186046512[/C][/ROW]
[ROW][C]14[/C][C]347.4[/C][C]245.643596899225[/C][C]101.756403100775[/C][/ROW]
[ROW][C]15[/C][C]338.3[/C][C]253.716527131783[/C][C]84.583472868217[/C][/ROW]
[ROW][C]16[/C][C]327.7[/C][C]247.661829457364[/C][C]80.0381705426356[/C][/ROW]
[ROW][C]17[/C][C]351.6[/C][C]250.128558139535[/C][C]101.471441860465[/C][/ROW]
[ROW][C]18[/C][C]396.6[/C][C]249.680062015504[/C][C]146.919937984496[/C][/ROW]
[ROW][C]19[/C][C]438.8[/C][C]249.455813953488[/C][C]189.344186046512[/C][/ROW]
[ROW][C]20[/C][C]395.6[/C][C]245.419348837209[/C][C]150.180651162791[/C][/ROW]
[ROW][C]21[/C][C]363.5[/C][C]251.249798449612[/C][C]112.250201550388[/C][/ROW]
[ROW][C]22[/C][C]378.8[/C][C]249.231565891473[/C][C]129.568434108527[/C][/ROW]
[ROW][C]23[/C][C]357[/C][C]248.110325581395[/C][C]108.889674418605[/C][/ROW]
[ROW][C]24[/C][C]369[/C][C]249.007317829457[/C][C]119.992682170543[/C][/ROW]
[ROW][C]25[/C][C]464.8[/C][C]249.231565891473[/C][C]215.568434108527[/C][/ROW]
[ROW][C]26[/C][C]479.1[/C][C]251.698294573643[/C][C]227.401705426357[/C][/ROW]
[ROW][C]27[/C][C]431.3[/C][C]254.165023255814[/C][C]177.134976744186[/C][/ROW]
[ROW][C]28[/C][C]366.5[/C][C]247.661829457364[/C][C]118.838170542636[/C][/ROW]
[ROW][C]29[/C][C]326.3[/C][C]249.007317829457[/C][C]77.2926821705426[/C][/ROW]
[ROW][C]30[/C][C]355.1[/C][C]251.922542635659[/C][C]103.177457364341[/C][/ROW]
[ROW][C]31[/C][C]331.6[/C][C]245.643596899225[/C][C]85.9564031007752[/C][/ROW]
[ROW][C]32[/C][C]261.3[/C][C]244.298108527132[/C][C]17.0018914728682[/C][/ROW]
[ROW][C]33[/C][C]249[/C][C]249.904310077519[/C][C]-0.904310077519387[/C][/ROW]
[ROW][C]34[/C][C]205.5[/C][C]251.922542635659[/C][C]-46.4225426356589[/C][/ROW]
[ROW][C]35[/C][C]235.6[/C][C]246.316341085271[/C][C]-10.7163410852713[/C][/ROW]
[ROW][C]36[/C][C]240.9[/C][C]246.540589147287[/C][C]-5.64058914728682[/C][/ROW]
[ROW][C]37[/C][C]264.9[/C][C]251.698294573643[/C][C]13.2017054263566[/C][/ROW]
[ROW][C]38[/C][C]253.8[/C][C]247.661829457364[/C][C]6.13817054263566[/C][/ROW]
[ROW][C]39[/C][C]232.3[/C][C]250.801302325581[/C][C]-18.5013023255814[/C][/ROW]
[ROW][C]40[/C][C]193.8[/C][C]249.904310077519[/C][C]-56.1043100775194[/C][/ROW]
[ROW][C]41[/C][C]177[/C][C]246.540589147287[/C][C]-69.5405891472868[/C][/ROW]
[ROW][C]42[/C][C]213.2[/C][C]251.922542635659[/C][C]-38.7225426356589[/C][/ROW]
[ROW][C]43[/C][C]207.2[/C][C]243.625364341085[/C][C]-36.4253643410853[/C][/ROW]
[ROW][C]44[/C][C]180.6[/C][C]243.849612403101[/C][C]-63.2496124031008[/C][/ROW]
[ROW][C]45[/C][C]188.6[/C][C]247.661829457364[/C][C]-59.0618294573644[/C][/ROW]
[ROW][C]46[/C][C]175.4[/C][C]250.35280620155[/C][C]-74.9528062015504[/C][/ROW]
[ROW][C]47[/C][C]199[/C][C]247.661829457364[/C][C]-48.6618294573643[/C][/ROW]
[ROW][C]48[/C][C]179.6[/C][C]253.043782945736[/C][C]-73.4437829457364[/C][/ROW]
[ROW][C]49[/C][C]225.8[/C][C]251.025550387597[/C][C]-25.2255503875969[/C][/ROW]
[ROW][C]50[/C][C]234[/C][C]250.128558139535[/C][C]-16.1285581395349[/C][/ROW]
[ROW][C]51[/C][C]200.2[/C][C]250.577054263566[/C][C]-50.3770542635659[/C][/ROW]
[ROW][C]52[/C][C]183.6[/C][C]248.783069767442[/C][C]-65.1830697674419[/C][/ROW]
[ROW][C]53[/C][C]178.2[/C][C]249.007317829457[/C][C]-70.8073178294574[/C][/ROW]
[ROW][C]54[/C][C]203.2[/C][C]249.455813953488[/C][C]-46.2558139534884[/C][/ROW]
[ROW][C]55[/C][C]208.5[/C][C]245.86784496124[/C][C]-37.3678449612403[/C][/ROW]
[ROW][C]56[/C][C]191.8[/C][C]242.504124031008[/C][C]-50.7041240310078[/C][/ROW]
[ROW][C]57[/C][C]172.8[/C][C]249.904310077519[/C][C]-77.1043100775194[/C][/ROW]
[ROW][C]58[/C][C]148[/C][C]253.268031007752[/C][C]-105.268031007752[/C][/ROW]
[ROW][C]59[/C][C]159.4[/C][C]251.474046511628[/C][C]-92.0740465116279[/C][/ROW]
[ROW][C]60[/C][C]154.5[/C][C]250.577054263566[/C][C]-96.0770542635659[/C][/ROW]
[ROW][C]61[/C][C]213.2[/C][C]246.316341085271[/C][C]-33.1163410852713[/C][/ROW]
[ROW][C]62[/C][C]196.4[/C][C]248.558821705426[/C][C]-52.1588217054264[/C][/ROW]
[ROW][C]63[/C][C]182.8[/C][C]250.577054263566[/C][C]-67.7770542635659[/C][/ROW]
[ROW][C]64[/C][C]176.4[/C][C]248.110325581395[/C][C]-71.7103255813954[/C][/ROW]
[ROW][C]65[/C][C]153.6[/C][C]246.989085271318[/C][C]-93.3890852713178[/C][/ROW]
[ROW][C]66[/C][C]173.2[/C][C]251.474046511628[/C][C]-78.274046511628[/C][/ROW]
[ROW][C]67[/C][C]171[/C][C]246.316341085271[/C][C]-75.3163410852713[/C][/ROW]
[ROW][C]68[/C][C]151.2[/C][C]246.540589147287[/C][C]-95.3405891472868[/C][/ROW]
[ROW][C]69[/C][C]161.9[/C][C]253.716527131783[/C][C]-91.816527131783[/C][/ROW]
[ROW][C]70[/C][C]157.2[/C][C]253.268031007752[/C][C]-96.068031007752[/C][/ROW]
[ROW][C]71[/C][C]201.7[/C][C]249.680062015504[/C][C]-47.9800620155039[/C][/ROW]
[ROW][C]72[/C][C]236.4[/C][C]252.146790697674[/C][C]-15.7467906976744[/C][/ROW]
[/TABLE]
Source: https://freestatistics.org/blog/index.php?pk=153341&T=4

Globally Unique Identifier (entire table): ba.freestatistics.org/blog/index.php?pk=153341&T=4

As an alternative you can also use a QR Code:  

The GUIDs for individual cells are displayed in the table below:

Multiple Linear Regression - Actuals, Interpolation, and Residuals
Time or IndexActualsInterpolationForecastResidualsPrediction Error
1235.1247.88607751938-12.7860775193797
2280.7251.47404651162829.2259534883721
3264.6252.3710387596912.2289612403101
4240.7250.801302325581-10.1013023255814
5201.4250.577054263566-49.1770542635659
6240.8251.249798449612-10.4497984496124
7241.1246.764837209302-5.66483720930234
8223.8243.625364341085-19.8253643410853
9206.1250.577054263566-44.4770542635659
10174.7253.268031007752-78.568031007752
11203.3248.558821705426-45.2588217054263
12220.5250.801302325581-30.3013023255814
13299.5247.43758139534952.0624186046512
14347.4245.643596899225101.756403100775
15338.3253.71652713178384.583472868217
16327.7247.66182945736480.0381705426356
17351.6250.128558139535101.471441860465
18396.6249.680062015504146.919937984496
19438.8249.455813953488189.344186046512
20395.6245.419348837209150.180651162791
21363.5251.249798449612112.250201550388
22378.8249.231565891473129.568434108527
23357248.110325581395108.889674418605
24369249.007317829457119.992682170543
25464.8249.231565891473215.568434108527
26479.1251.698294573643227.401705426357
27431.3254.165023255814177.134976744186
28366.5247.661829457364118.838170542636
29326.3249.00731782945777.2926821705426
30355.1251.922542635659103.177457364341
31331.6245.64359689922585.9564031007752
32261.3244.29810852713217.0018914728682
33249249.904310077519-0.904310077519387
34205.5251.922542635659-46.4225426356589
35235.6246.316341085271-10.7163410852713
36240.9246.540589147287-5.64058914728682
37264.9251.69829457364313.2017054263566
38253.8247.6618294573646.13817054263566
39232.3250.801302325581-18.5013023255814
40193.8249.904310077519-56.1043100775194
41177246.540589147287-69.5405891472868
42213.2251.922542635659-38.7225426356589
43207.2243.625364341085-36.4253643410853
44180.6243.849612403101-63.2496124031008
45188.6247.661829457364-59.0618294573644
46175.4250.35280620155-74.9528062015504
47199247.661829457364-48.6618294573643
48179.6253.043782945736-73.4437829457364
49225.8251.025550387597-25.2255503875969
50234250.128558139535-16.1285581395349
51200.2250.577054263566-50.3770542635659
52183.6248.783069767442-65.1830697674419
53178.2249.007317829457-70.8073178294574
54203.2249.455813953488-46.2558139534884
55208.5245.86784496124-37.3678449612403
56191.8242.504124031008-50.7041240310078
57172.8249.904310077519-77.1043100775194
58148253.268031007752-105.268031007752
59159.4251.474046511628-92.0740465116279
60154.5250.577054263566-96.0770542635659
61213.2246.316341085271-33.1163410852713
62196.4248.558821705426-52.1588217054264
63182.8250.577054263566-67.7770542635659
64176.4248.110325581395-71.7103255813954
65153.6246.989085271318-93.3890852713178
66173.2251.474046511628-78.274046511628
67171246.316341085271-75.3163410852713
68151.2246.540589147287-95.3405891472868
69161.9253.716527131783-91.816527131783
70157.2253.268031007752-96.068031007752
71201.7249.680062015504-47.9800620155039
72236.4252.146790697674-15.7467906976744


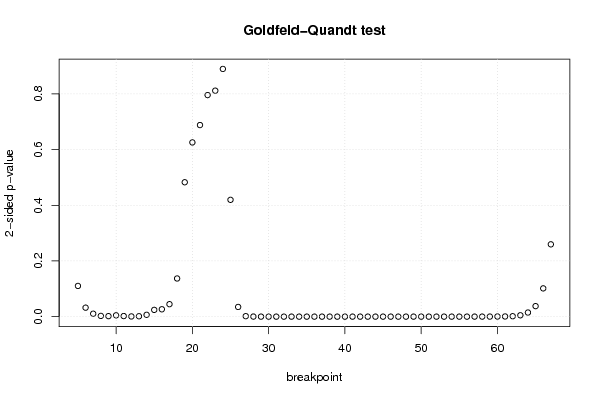
Goldfeld-Quandt test for Heteroskedasticity
p-valuesAlternative Hypothesis
breakpoint indexgreater2-sidedless
50.05512758210536820.1102551642107360.944872417894632
60.01613415271575480.03226830543150970.983865847284245
70.005241534499448550.01048306899889710.994758465500551
80.001311061419144210.002622122838288430.998688938580856
90.0009275708493588160.001855141698717630.99907242915064
100.002362716876200190.004725433752400370.9976372831238
110.001071365034805960.002142730069611920.998928634965194
120.0003545528608773990.0007091057217547990.999645447139123
130.0007157268270021470.001431453654004290.999284273172998
140.003328935643778870.006657871287557740.99667106435622
150.0121591850691630.0243183701383260.987840814930837
160.01327443639905180.02654887279810360.986725563600948
170.02239009322965160.04478018645930310.977609906770348
180.06853039805836990.137060796116740.93146960194163
190.2413413075816790.4826826151633570.758658692418321
200.3128284210950560.6256568421901130.687171578904944
210.3440636973692470.6881273947384950.655936302630753
220.3978304048470660.7956608096941320.602169595152934
230.4057400501367550.8114801002735090.594259949863245
240.4447817626875090.8895635253750170.555218237312491
250.7902132030898970.4195735938202050.209786796910103
260.9825915839618350.034816832076330.017408416038165
270.999159560182050.001680879635901780.00084043981795089
280.9998653959680250.0002692080639506830.000134604031975342
290.999957996658548.400668291952e-054.200334145976e-05
300.9999992169490111.56610197789539e-067.83050988947694e-07
310.9999999790314154.19371694412022e-082.09685847206011e-08
320.9999999862018962.75962089703904e-081.37981044851952e-08
330.9999999913048421.73903154741914e-088.69515773709571e-09
340.9999999891327482.17345035152633e-081.08672517576316e-08
350.999999987985882.40282423791008e-081.20141211895504e-08
360.9999999894864952.10270097997834e-081.05135048998917e-08
370.999999998488913.0221810823812e-091.5110905411906e-09
380.9999999996622786.75443315438299e-103.3772165771915e-10
390.9999999998189523.62096281888087e-101.81048140944044e-10
400.9999999996664966.67008930954446e-103.33504465477223e-10
410.9999999994426661.11466785661281e-095.57333928306403e-10
420.999999999300181.39964222901958e-096.99821114509792e-10
430.9999999983191463.36170777603043e-091.68085388801521e-09
440.9999999960972377.80552516730666e-093.90276258365333e-09
450.9999999902498041.95003911961795e-089.75019559808973e-09
460.9999999801590273.96819466649977e-081.98409733324988e-08
470.9999999496417161.00716566982882e-075.03582834914411e-08
480.9999998896615232.20676953934387e-071.10338476967194e-07
490.9999999031000921.93799815994497e-079.68999079972487e-08
500.9999999607750167.84499674230755e-083.92249837115378e-08
510.9999999181848221.63630355393079e-078.18151776965395e-08
520.9999997533992174.93201566374338e-072.46600783187169e-07
530.9999992720239651.45595207084075e-067.27976035420375e-07
540.9999984845180023.03096399520741e-061.5154819976037e-06
550.9999967195618476.56087630562755e-063.28043815281377e-06
560.9999893701661632.12596676732527e-051.06298338366264e-05
570.9999694586977726.10826044567e-053.054130222835e-05
580.9999484345991560.0001031308016888255.15654008444124e-05
590.9998814766770570.0002370466458867670.000118523322943383
600.9997706805149450.0004586389701105110.000229319485055256
610.999687689076280.0006246218474381240.000312310923719062
620.9992309752315640.001538049536872150.000769024768436074
630.9975474928769230.004905014246153370.00245250712307668
640.9925788565381340.01484228692373180.00742114346186591
650.981123758568650.03775248286269970.0188762414313498
660.9492159812351650.101568037529670.050784018764835
670.8701300576516740.2597398846966510.129869942348326

\begin{tabular}{lllllllll}
\hline
Goldfeld-Quandt test for Heteroskedasticity \tabularnewline
p-values & Alternative Hypothesis \tabularnewline
breakpoint index & greater & 2-sided & less \tabularnewline
5 & 0.0551275821053682 & 0.110255164210736 & 0.944872417894632 \tabularnewline
6 & 0.0161341527157548 & 0.0322683054315097 & 0.983865847284245 \tabularnewline
7 & 0.00524153449944855 & 0.0104830689988971 & 0.994758465500551 \tabularnewline
8 & 0.00131106141914421 & 0.00262212283828843 & 0.998688938580856 \tabularnewline
9 & 0.000927570849358816 & 0.00185514169871763 & 0.99907242915064 \tabularnewline
10 & 0.00236271687620019 & 0.00472543375240037 & 0.9976372831238 \tabularnewline
11 & 0.00107136503480596 & 0.00214273006961192 & 0.998928634965194 \tabularnewline
12 & 0.000354552860877399 & 0.000709105721754799 & 0.999645447139123 \tabularnewline
13 & 0.000715726827002147 & 0.00143145365400429 & 0.999284273172998 \tabularnewline
14 & 0.00332893564377887 & 0.00665787128755774 & 0.99667106435622 \tabularnewline
15 & 0.012159185069163 & 0.024318370138326 & 0.987840814930837 \tabularnewline
16 & 0.0132744363990518 & 0.0265488727981036 & 0.986725563600948 \tabularnewline
17 & 0.0223900932296516 & 0.0447801864593031 & 0.977609906770348 \tabularnewline
18 & 0.0685303980583699 & 0.13706079611674 & 0.93146960194163 \tabularnewline
19 & 0.241341307581679 & 0.482682615163357 & 0.758658692418321 \tabularnewline
20 & 0.312828421095056 & 0.625656842190113 & 0.687171578904944 \tabularnewline
21 & 0.344063697369247 & 0.688127394738495 & 0.655936302630753 \tabularnewline
22 & 0.397830404847066 & 0.795660809694132 & 0.602169595152934 \tabularnewline
23 & 0.405740050136755 & 0.811480100273509 & 0.594259949863245 \tabularnewline
24 & 0.444781762687509 & 0.889563525375017 & 0.555218237312491 \tabularnewline
25 & 0.790213203089897 & 0.419573593820205 & 0.209786796910103 \tabularnewline
26 & 0.982591583961835 & 0.03481683207633 & 0.017408416038165 \tabularnewline
27 & 0.99915956018205 & 0.00168087963590178 & 0.00084043981795089 \tabularnewline
28 & 0.999865395968025 & 0.000269208063950683 & 0.000134604031975342 \tabularnewline
29 & 0.99995799665854 & 8.400668291952e-05 & 4.200334145976e-05 \tabularnewline
30 & 0.999999216949011 & 1.56610197789539e-06 & 7.83050988947694e-07 \tabularnewline
31 & 0.999999979031415 & 4.19371694412022e-08 & 2.09685847206011e-08 \tabularnewline
32 & 0.999999986201896 & 2.75962089703904e-08 & 1.37981044851952e-08 \tabularnewline
33 & 0.999999991304842 & 1.73903154741914e-08 & 8.69515773709571e-09 \tabularnewline
34 & 0.999999989132748 & 2.17345035152633e-08 & 1.08672517576316e-08 \tabularnewline
35 & 0.99999998798588 & 2.40282423791008e-08 & 1.20141211895504e-08 \tabularnewline
36 & 0.999999989486495 & 2.10270097997834e-08 & 1.05135048998917e-08 \tabularnewline
37 & 0.99999999848891 & 3.0221810823812e-09 & 1.5110905411906e-09 \tabularnewline
38 & 0.999999999662278 & 6.75443315438299e-10 & 3.3772165771915e-10 \tabularnewline
39 & 0.999999999818952 & 3.62096281888087e-10 & 1.81048140944044e-10 \tabularnewline
40 & 0.999999999666496 & 6.67008930954446e-10 & 3.33504465477223e-10 \tabularnewline
41 & 0.999999999442666 & 1.11466785661281e-09 & 5.57333928306403e-10 \tabularnewline
42 & 0.99999999930018 & 1.39964222901958e-09 & 6.99821114509792e-10 \tabularnewline
43 & 0.999999998319146 & 3.36170777603043e-09 & 1.68085388801521e-09 \tabularnewline
44 & 0.999999996097237 & 7.80552516730666e-09 & 3.90276258365333e-09 \tabularnewline
45 & 0.999999990249804 & 1.95003911961795e-08 & 9.75019559808973e-09 \tabularnewline
46 & 0.999999980159027 & 3.96819466649977e-08 & 1.98409733324988e-08 \tabularnewline
47 & 0.999999949641716 & 1.00716566982882e-07 & 5.03582834914411e-08 \tabularnewline
48 & 0.999999889661523 & 2.20676953934387e-07 & 1.10338476967194e-07 \tabularnewline
49 & 0.999999903100092 & 1.93799815994497e-07 & 9.68999079972487e-08 \tabularnewline
50 & 0.999999960775016 & 7.84499674230755e-08 & 3.92249837115378e-08 \tabularnewline
51 & 0.999999918184822 & 1.63630355393079e-07 & 8.18151776965395e-08 \tabularnewline
52 & 0.999999753399217 & 4.93201566374338e-07 & 2.46600783187169e-07 \tabularnewline
53 & 0.999999272023965 & 1.45595207084075e-06 & 7.27976035420375e-07 \tabularnewline
54 & 0.999998484518002 & 3.03096399520741e-06 & 1.5154819976037e-06 \tabularnewline
55 & 0.999996719561847 & 6.56087630562755e-06 & 3.28043815281377e-06 \tabularnewline
56 & 0.999989370166163 & 2.12596676732527e-05 & 1.06298338366264e-05 \tabularnewline
57 & 0.999969458697772 & 6.10826044567e-05 & 3.054130222835e-05 \tabularnewline
58 & 0.999948434599156 & 0.000103130801688825 & 5.15654008444124e-05 \tabularnewline
59 & 0.999881476677057 & 0.000237046645886767 & 0.000118523322943383 \tabularnewline
60 & 0.999770680514945 & 0.000458638970110511 & 0.000229319485055256 \tabularnewline
61 & 0.99968768907628 & 0.000624621847438124 & 0.000312310923719062 \tabularnewline
62 & 0.999230975231564 & 0.00153804953687215 & 0.000769024768436074 \tabularnewline
63 & 0.997547492876923 & 0.00490501424615337 & 0.00245250712307668 \tabularnewline
64 & 0.992578856538134 & 0.0148422869237318 & 0.00742114346186591 \tabularnewline
65 & 0.98112375856865 & 0.0377524828626997 & 0.0188762414313498 \tabularnewline
66 & 0.949215981235165 & 0.10156803752967 & 0.050784018764835 \tabularnewline
67 & 0.870130057651674 & 0.259739884696651 & 0.129869942348326 \tabularnewline
\hline
\end{tabular}
%Source: https://freestatistics.org/blog/index.php?pk=153341&T=5

[TABLE]
[ROW][C]Goldfeld-Quandt test for Heteroskedasticity[/C][/ROW]
[ROW][C]p-values[/C][C]Alternative Hypothesis[/C][/ROW]
[ROW][C]breakpoint index[/C][C]greater[/C][C]2-sided[/C][C]less[/C][/ROW]
[ROW][C]5[/C][C]0.0551275821053682[/C][C]0.110255164210736[/C][C]0.944872417894632[/C][/ROW]
[ROW][C]6[/C][C]0.0161341527157548[/C][C]0.0322683054315097[/C][C]0.983865847284245[/C][/ROW]
[ROW][C]7[/C][C]0.00524153449944855[/C][C]0.0104830689988971[/C][C]0.994758465500551[/C][/ROW]
[ROW][C]8[/C][C]0.00131106141914421[/C][C]0.00262212283828843[/C][C]0.998688938580856[/C][/ROW]
[ROW][C]9[/C][C]0.000927570849358816[/C][C]0.00185514169871763[/C][C]0.99907242915064[/C][/ROW]
[ROW][C]10[/C][C]0.00236271687620019[/C][C]0.00472543375240037[/C][C]0.9976372831238[/C][/ROW]
[ROW][C]11[/C][C]0.00107136503480596[/C][C]0.00214273006961192[/C][C]0.998928634965194[/C][/ROW]
[ROW][C]12[/C][C]0.000354552860877399[/C][C]0.000709105721754799[/C][C]0.999645447139123[/C][/ROW]
[ROW][C]13[/C][C]0.000715726827002147[/C][C]0.00143145365400429[/C][C]0.999284273172998[/C][/ROW]
[ROW][C]14[/C][C]0.00332893564377887[/C][C]0.00665787128755774[/C][C]0.99667106435622[/C][/ROW]
[ROW][C]15[/C][C]0.012159185069163[/C][C]0.024318370138326[/C][C]0.987840814930837[/C][/ROW]
[ROW][C]16[/C][C]0.0132744363990518[/C][C]0.0265488727981036[/C][C]0.986725563600948[/C][/ROW]
[ROW][C]17[/C][C]0.0223900932296516[/C][C]0.0447801864593031[/C][C]0.977609906770348[/C][/ROW]
[ROW][C]18[/C][C]0.0685303980583699[/C][C]0.13706079611674[/C][C]0.93146960194163[/C][/ROW]
[ROW][C]19[/C][C]0.241341307581679[/C][C]0.482682615163357[/C][C]0.758658692418321[/C][/ROW]
[ROW][C]20[/C][C]0.312828421095056[/C][C]0.625656842190113[/C][C]0.687171578904944[/C][/ROW]
[ROW][C]21[/C][C]0.344063697369247[/C][C]0.688127394738495[/C][C]0.655936302630753[/C][/ROW]
[ROW][C]22[/C][C]0.397830404847066[/C][C]0.795660809694132[/C][C]0.602169595152934[/C][/ROW]
[ROW][C]23[/C][C]0.405740050136755[/C][C]0.811480100273509[/C][C]0.594259949863245[/C][/ROW]
[ROW][C]24[/C][C]0.444781762687509[/C][C]0.889563525375017[/C][C]0.555218237312491[/C][/ROW]
[ROW][C]25[/C][C]0.790213203089897[/C][C]0.419573593820205[/C][C]0.209786796910103[/C][/ROW]
[ROW][C]26[/C][C]0.982591583961835[/C][C]0.03481683207633[/C][C]0.017408416038165[/C][/ROW]
[ROW][C]27[/C][C]0.99915956018205[/C][C]0.00168087963590178[/C][C]0.00084043981795089[/C][/ROW]
[ROW][C]28[/C][C]0.999865395968025[/C][C]0.000269208063950683[/C][C]0.000134604031975342[/C][/ROW]
[ROW][C]29[/C][C]0.99995799665854[/C][C]8.400668291952e-05[/C][C]4.200334145976e-05[/C][/ROW]
[ROW][C]30[/C][C]0.999999216949011[/C][C]1.56610197789539e-06[/C][C]7.83050988947694e-07[/C][/ROW]
[ROW][C]31[/C][C]0.999999979031415[/C][C]4.19371694412022e-08[/C][C]2.09685847206011e-08[/C][/ROW]
[ROW][C]32[/C][C]0.999999986201896[/C][C]2.75962089703904e-08[/C][C]1.37981044851952e-08[/C][/ROW]
[ROW][C]33[/C][C]0.999999991304842[/C][C]1.73903154741914e-08[/C][C]8.69515773709571e-09[/C][/ROW]
[ROW][C]34[/C][C]0.999999989132748[/C][C]2.17345035152633e-08[/C][C]1.08672517576316e-08[/C][/ROW]
[ROW][C]35[/C][C]0.99999998798588[/C][C]2.40282423791008e-08[/C][C]1.20141211895504e-08[/C][/ROW]
[ROW][C]36[/C][C]0.999999989486495[/C][C]2.10270097997834e-08[/C][C]1.05135048998917e-08[/C][/ROW]
[ROW][C]37[/C][C]0.99999999848891[/C][C]3.0221810823812e-09[/C][C]1.5110905411906e-09[/C][/ROW]
[ROW][C]38[/C][C]0.999999999662278[/C][C]6.75443315438299e-10[/C][C]3.3772165771915e-10[/C][/ROW]
[ROW][C]39[/C][C]0.999999999818952[/C][C]3.62096281888087e-10[/C][C]1.81048140944044e-10[/C][/ROW]
[ROW][C]40[/C][C]0.999999999666496[/C][C]6.67008930954446e-10[/C][C]3.33504465477223e-10[/C][/ROW]
[ROW][C]41[/C][C]0.999999999442666[/C][C]1.11466785661281e-09[/C][C]5.57333928306403e-10[/C][/ROW]
[ROW][C]42[/C][C]0.99999999930018[/C][C]1.39964222901958e-09[/C][C]6.99821114509792e-10[/C][/ROW]
[ROW][C]43[/C][C]0.999999998319146[/C][C]3.36170777603043e-09[/C][C]1.68085388801521e-09[/C][/ROW]
[ROW][C]44[/C][C]0.999999996097237[/C][C]7.80552516730666e-09[/C][C]3.90276258365333e-09[/C][/ROW]
[ROW][C]45[/C][C]0.999999990249804[/C][C]1.95003911961795e-08[/C][C]9.75019559808973e-09[/C][/ROW]
[ROW][C]46[/C][C]0.999999980159027[/C][C]3.96819466649977e-08[/C][C]1.98409733324988e-08[/C][/ROW]
[ROW][C]47[/C][C]0.999999949641716[/C][C]1.00716566982882e-07[/C][C]5.03582834914411e-08[/C][/ROW]
[ROW][C]48[/C][C]0.999999889661523[/C][C]2.20676953934387e-07[/C][C]1.10338476967194e-07[/C][/ROW]
[ROW][C]49[/C][C]0.999999903100092[/C][C]1.93799815994497e-07[/C][C]9.68999079972487e-08[/C][/ROW]
[ROW][C]50[/C][C]0.999999960775016[/C][C]7.84499674230755e-08[/C][C]3.92249837115378e-08[/C][/ROW]
[ROW][C]51[/C][C]0.999999918184822[/C][C]1.63630355393079e-07[/C][C]8.18151776965395e-08[/C][/ROW]
[ROW][C]52[/C][C]0.999999753399217[/C][C]4.93201566374338e-07[/C][C]2.46600783187169e-07[/C][/ROW]
[ROW][C]53[/C][C]0.999999272023965[/C][C]1.45595207084075e-06[/C][C]7.27976035420375e-07[/C][/ROW]
[ROW][C]54[/C][C]0.999998484518002[/C][C]3.03096399520741e-06[/C][C]1.5154819976037e-06[/C][/ROW]
[ROW][C]55[/C][C]0.999996719561847[/C][C]6.56087630562755e-06[/C][C]3.28043815281377e-06[/C][/ROW]
[ROW][C]56[/C][C]0.999989370166163[/C][C]2.12596676732527e-05[/C][C]1.06298338366264e-05[/C][/ROW]
[ROW][C]57[/C][C]0.999969458697772[/C][C]6.10826044567e-05[/C][C]3.054130222835e-05[/C][/ROW]
[ROW][C]58[/C][C]0.999948434599156[/C][C]0.000103130801688825[/C][C]5.15654008444124e-05[/C][/ROW]
[ROW][C]59[/C][C]0.999881476677057[/C][C]0.000237046645886767[/C][C]0.000118523322943383[/C][/ROW]
[ROW][C]60[/C][C]0.999770680514945[/C][C]0.000458638970110511[/C][C]0.000229319485055256[/C][/ROW]
[ROW][C]61[/C][C]0.99968768907628[/C][C]0.000624621847438124[/C][C]0.000312310923719062[/C][/ROW]
[ROW][C]62[/C][C]0.999230975231564[/C][C]0.00153804953687215[/C][C]0.000769024768436074[/C][/ROW]
[ROW][C]63[/C][C]0.997547492876923[/C][C]0.00490501424615337[/C][C]0.00245250712307668[/C][/ROW]
[ROW][C]64[/C][C]0.992578856538134[/C][C]0.0148422869237318[/C][C]0.00742114346186591[/C][/ROW]
[ROW][C]65[/C][C]0.98112375856865[/C][C]0.0377524828626997[/C][C]0.0188762414313498[/C][/ROW]
[ROW][C]66[/C][C]0.949215981235165[/C][C]0.10156803752967[/C][C]0.050784018764835[/C][/ROW]
[ROW][C]67[/C][C]0.870130057651674[/C][C]0.259739884696651[/C][C]0.129869942348326[/C][/ROW]
[/TABLE]
Source: https://freestatistics.org/blog/index.php?pk=153341&T=5

Globally Unique Identifier (entire table): ba.freestatistics.org/blog/index.php?pk=153341&T=5

As an alternative you can also use a QR Code:  

The GUIDs for individual cells are displayed in the table below:

Goldfeld-Quandt test for Heteroskedasticity
p-valuesAlternative Hypothesis
breakpoint indexgreater2-sidedless
50.05512758210536820.1102551642107360.944872417894632
60.01613415271575480.03226830543150970.983865847284245
70.005241534499448550.01048306899889710.994758465500551
80.001311061419144210.002622122838288430.998688938580856
90.0009275708493588160.001855141698717630.99907242915064
100.002362716876200190.004725433752400370.9976372831238
110.001071365034805960.002142730069611920.998928634965194
120.0003545528608773990.0007091057217547990.999645447139123
130.0007157268270021470.001431453654004290.999284273172998
140.003328935643778870.006657871287557740.99667106435622
150.0121591850691630.0243183701383260.987840814930837
160.01327443639905180.02654887279810360.986725563600948
170.02239009322965160.04478018645930310.977609906770348
180.06853039805836990.137060796116740.93146960194163
190.2413413075816790.4826826151633570.758658692418321
200.3128284210950560.6256568421901130.687171578904944
210.3440636973692470.6881273947384950.655936302630753
220.3978304048470660.7956608096941320.602169595152934
230.4057400501367550.8114801002735090.594259949863245
240.4447817626875090.8895635253750170.555218237312491
250.7902132030898970.4195735938202050.209786796910103
260.9825915839618350.034816832076330.017408416038165
270.999159560182050.001680879635901780.00084043981795089
280.9998653959680250.0002692080639506830.000134604031975342
290.999957996658548.400668291952e-054.200334145976e-05
300.9999992169490111.56610197789539e-067.83050988947694e-07
310.9999999790314154.19371694412022e-082.09685847206011e-08
320.9999999862018962.75962089703904e-081.37981044851952e-08
330.9999999913048421.73903154741914e-088.69515773709571e-09
340.9999999891327482.17345035152633e-081.08672517576316e-08
350.999999987985882.40282423791008e-081.20141211895504e-08
360.9999999894864952.10270097997834e-081.05135048998917e-08
370.999999998488913.0221810823812e-091.5110905411906e-09
380.9999999996622786.75443315438299e-103.3772165771915e-10
390.9999999998189523.62096281888087e-101.81048140944044e-10
400.9999999996664966.67008930954446e-103.33504465477223e-10
410.9999999994426661.11466785661281e-095.57333928306403e-10
420.999999999300181.39964222901958e-096.99821114509792e-10
430.9999999983191463.36170777603043e-091.68085388801521e-09
440.9999999960972377.80552516730666e-093.90276258365333e-09
450.9999999902498041.95003911961795e-089.75019559808973e-09
460.9999999801590273.96819466649977e-081.98409733324988e-08
470.9999999496417161.00716566982882e-075.03582834914411e-08
480.9999998896615232.20676953934387e-071.10338476967194e-07
490.9999999031000921.93799815994497e-079.68999079972487e-08
500.9999999607750167.84499674230755e-083.92249837115378e-08
510.9999999181848221.63630355393079e-078.18151776965395e-08
520.9999997533992174.93201566374338e-072.46600783187169e-07
530.9999992720239651.45595207084075e-067.27976035420375e-07
540.9999984845180023.03096399520741e-061.5154819976037e-06
550.9999967195618476.56087630562755e-063.28043815281377e-06
560.9999893701661632.12596676732527e-051.06298338366264e-05
570.9999694586977726.10826044567e-053.054130222835e-05
580.9999484345991560.0001031308016888255.15654008444124e-05
590.9998814766770570.0002370466458867670.000118523322943383
600.9997706805149450.0004586389701105110.000229319485055256
610.999687689076280.0006246218474381240.000312310923719062
620.9992309752315640.001538049536872150.000769024768436074
630.9975474928769230.004905014246153370.00245250712307668
640.9925788565381340.01484228692373180.00742114346186591
650.981123758568650.03775248286269970.0188762414313498
660.9492159812351650.101568037529670.050784018764835
670.8701300576516740.2597398846966510.129869942348326


Meta Analysis of Goldfeld-Quandt test for Heteroskedasticity
Description# significant tests% significant testsOK/NOK
1% type I error level440.698412698412698NOK
5% type I error level520.825396825396825NOK
10% type I error level520.825396825396825NOK

\begin{tabular}{lllllllll}
\hline
Meta Analysis of Goldfeld-Quandt test for Heteroskedasticity \tabularnewline
Description & # significant tests & % significant tests & OK/NOK \tabularnewline
1% type I error level & 44 & 0.698412698412698 & NOK \tabularnewline
5% type I error level & 52 & 0.825396825396825 & NOK \tabularnewline
10% type I error level & 52 & 0.825396825396825 & NOK \tabularnewline
\hline
\end{tabular}
%Source: https://freestatistics.org/blog/index.php?pk=153341&T=6

[TABLE]
[ROW][C]Meta Analysis of Goldfeld-Quandt test for Heteroskedasticity[/C][/ROW]
[ROW][C]Description[/C][C]# significant tests[/C][C]% significant tests[/C][C]OK/NOK[/C][/ROW]
[ROW][C]1% type I error level[/C][C]44[/C][C]0.698412698412698[/C][C]NOK[/C][/ROW]
[ROW][C]5% type I error level[/C][C]52[/C][C]0.825396825396825[/C][C]NOK[/C][/ROW]
[ROW][C]10% type I error level[/C][C]52[/C][C]0.825396825396825[/C][C]NOK[/C][/ROW]
[/TABLE]
Source: https://freestatistics.org/blog/index.php?pk=153341&T=6

Globally Unique Identifier (entire table): ba.freestatistics.org/blog/index.php?pk=153341&T=6

As an alternative you can also use a QR Code:  

The GUIDs for individual cells are displayed in the table below:

Meta Analysis of Goldfeld-Quandt test for Heteroskedasticity
Description# significant tests% significant testsOK/NOK
1% type I error level440.698412698412698NOK
5% type I error level520.825396825396825NOK
10% type I error level520.825396825396825NOK


Parameters (Session):
par1 = 1 ; par2 = Do not include Seasonal Dummies ; par3 = No Linear Trend ;
Parameters (R input):
par1 = 1 ; par2 = Do not include Seasonal Dummies ; par3 = No Linear Trend ;
R code (references can be found in the software module):
library(lattice)
library(lmtest)
n25 <- 25 #minimum number of obs. for Goldfeld-Quandt test
par1 <- as.numeric(par1)
x <- t(y)
k <- length(x[1,])
n <- length(x[,1])
x1 <- cbind(x[,par1], x[,1:k!=par1])
mycolnames <- c(colnames(x)[par1], colnames(x)[1:k!=par1])
colnames(x1) <- mycolnames #colnames(x)[par1]
x <- x1
if (par3 == 'First Differences'){
x2 <- array(0, dim=c(n-1,k), dimnames=list(1:(n-1), paste('(1-B)',colnames(x),sep='')))
for (i in 1:n-1) {
for (j in 1:k) {
x2[i,j] <- x[i+1,j] - x[i,j]
}
}
x <- x2
}
if (par2 == 'Include Monthly Dummies'){
x2 <- array(0, dim=c(n,11), dimnames=list(1:n, paste('M', seq(1:11), sep ='')))
for (i in 1:11){
x2[seq(i,n,12),i] <- 1
}
x <- cbind(x, x2)
}
if (par2 == 'Include Quarterly Dummies'){
x2 <- array(0, dim=c(n,3), dimnames=list(1:n, paste('Q', seq(1:3), sep ='')))
for (i in 1:3){
x2[seq(i,n,4),i] <- 1
}
x <- cbind(x, x2)
}
k <- length(x[1,])
if (par3 == 'Linear Trend'){
x <- cbind(x, c(1:n))
colnames(x)[k+1] <- 't'
}
x
k <- length(x[1,])
df <- as.data.frame(x)
(mylm <- lm(df))
(mysum <- summary(mylm))
if (n > n25) {
kp3 <- k + 3
nmkm3 <- n - k - 3
gqarr <- array(NA, dim=c(nmkm3-kp3+1,3))
numgqtests <- 0
numsignificant1 <- 0
numsignificant5 <- 0
numsignificant10 <- 0
for (mypoint in kp3:nmkm3) {
j <- 0
numgqtests <- numgqtests + 1
for (myalt in c('greater', 'two.sided', 'less')) {
j <- j + 1
gqarr[mypoint-kp3+1,j] <- gqtest(mylm, point=mypoint, alternative=myalt)$p.value
}
if (gqarr[mypoint-kp3+1,2] < 0.01) numsignificant1 <- numsignificant1 + 1
if (gqarr[mypoint-kp3+1,2] < 0.05) numsignificant5 <- numsignificant5 + 1
if (gqarr[mypoint-kp3+1,2] < 0.10) numsignificant10 <- numsignificant10 + 1
}
gqarr
}
bitmap(file='test0.png')
plot(x[,1], type='l', main='Actuals and Interpolation', ylab='value of Actuals and Interpolation (dots)', xlab='time or index')
points(x[,1]-mysum$resid)
grid()
dev.off()
bitmap(file='test1.png')
plot(mysum$resid, type='b', pch=19, main='Residuals', ylab='value of Residuals', xlab='time or index')
grid()
dev.off()
bitmap(file='test2.png')
hist(mysum$resid, main='Residual Histogram', xlab='values of Residuals')
grid()
dev.off()
bitmap(file='test3.png')
densityplot(~mysum$resid,col='black',main='Residual Density Plot', xlab='values of Residuals')
dev.off()
bitmap(file='test4.png')
qqnorm(mysum$resid, main='Residual Normal Q-Q Plot')
qqline(mysum$resid)
grid()
dev.off()
(myerror <- as.ts(mysum$resid))
bitmap(file='test5.png')
dum <- cbind(lag(myerror,k=1),myerror)
dum
dum1 <- dum[2:length(myerror),]
dum1
z <- as.data.frame(dum1)
z
plot(z,main=paste('Residual Lag plot, lowess, and regression line'), ylab='values of Residuals', xlab='lagged values of Residuals')
lines(lowess(z))
abline(lm(z))
grid()
dev.off()
bitmap(file='test6.png')
acf(mysum$resid, lag.max=length(mysum$resid)/2, main='Residual Autocorrelation Function')
grid()
dev.off()
bitmap(file='test7.png')
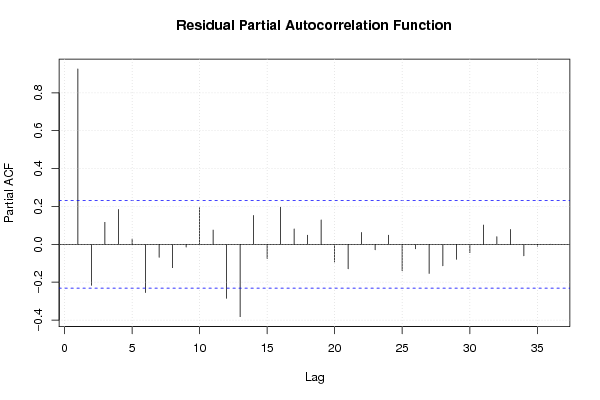
pacf(mysum$resid, lag.max=length(mysum$resid)/2, main='Residual Partial Autocorrelation Function')
grid()
dev.off()
bitmap(file='test8.png')
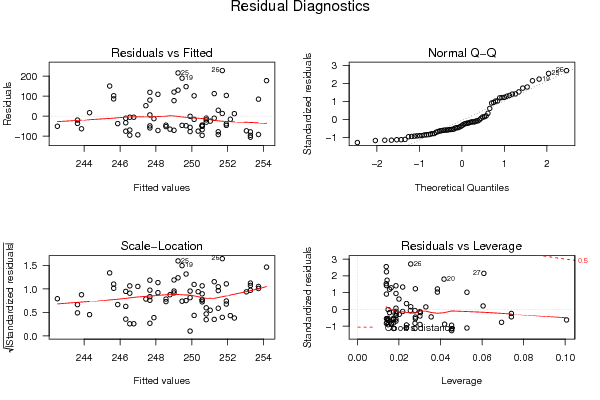
opar <- par(mfrow = c(2,2), oma = c(0, 0, 1.1, 0))
plot(mylm, las = 1, sub='Residual Diagnostics')
par(opar)
dev.off()
if (n > n25) {
bitmap(file='test9.png')
plot(kp3:nmkm3,gqarr[,2], main='Goldfeld-Quandt test',ylab='2-sided p-value',xlab='breakpoint')
grid()
dev.off()
}
load(file='createtable')
a<-table.start()
a<-table.row.start(a)
a<-table.element(a, 'Multiple Linear Regression - Estimated Regression Equation', 1, TRUE)
a<-table.row.end(a)
myeq <- colnames(x)[1]
myeq <- paste(myeq, '[t] = ', sep='')
for (i in 1:k){
if (mysum$coefficients[i,1] > 0) myeq <- paste(myeq, '+', '')
myeq <- paste(myeq, mysum$coefficients[i,1], sep=' ')
if (rownames(mysum$coefficients)[i] != '(Intercept)') {
myeq <- paste(myeq, rownames(mysum$coefficients)[i], sep='')
if (rownames(mysum$coefficients)[i] != 't') myeq <- paste(myeq, '[t]', sep='')
}
}
myeq <- paste(myeq, ' + e[t]')
a<-table.row.start(a)
a<-table.element(a, myeq)
a<-table.row.end(a)
a<-table.end(a)
table.save(a,file='mytable1.tab')
a<-table.start()
a<-table.row.start(a)
a<-table.element(a,hyperlink('ols1.htm','Multiple Linear Regression - Ordinary Least Squares',''), 6, TRUE)
a<-table.row.end(a)
a<-table.row.start(a)
a<-table.element(a,'Variable',header=TRUE)
a<-table.element(a,'Parameter',header=TRUE)
a<-table.element(a,'S.D.',header=TRUE)
a<-table.element(a,'T-STAT
H0: parameter = 0',header=TRUE)
a<-table.element(a,'2-tail p-value',header=TRUE)
a<-table.element(a,'1-tail p-value',header=TRUE)
a<-table.row.end(a)
for (i in 1:k){
a<-table.row.start(a)
a<-table.element(a,rownames(mysum$coefficients)[i],header=TRUE)
a<-table.element(a,mysum$coefficients[i,1])
a<-table.element(a, round(mysum$coefficients[i,2],6))
a<-table.element(a, round(mysum$coefficients[i,3],4))
a<-table.element(a, round(mysum$coefficients[i,4],6))
a<-table.element(a, round(mysum$coefficients[i,4]/2,6))
a<-table.row.end(a)
}
a<-table.end(a)
table.save(a,file='mytable2.tab')
a<-table.start()
a<-table.row.start(a)
a<-table.element(a, 'Multiple Linear Regression - Regression Statistics', 2, TRUE)
a<-table.row.end(a)
a<-table.row.start(a)
a<-table.element(a, 'Multiple R',1,TRUE)
a<-table.element(a, sqrt(mysum$r.squared))
a<-table.row.end(a)
a<-table.row.start(a)
a<-table.element(a, 'R-squared',1,TRUE)
a<-table.element(a, mysum$r.squared)
a<-table.row.end(a)
a<-table.row.start(a)
a<-table.element(a, 'Adjusted R-squared',1,TRUE)
a<-table.element(a, mysum$adj.r.squared)
a<-table.row.end(a)
a<-table.row.start(a)
a<-table.element(a, 'F-TEST (value)',1,TRUE)
a<-table.element(a, mysum$fstatistic[1])
a<-table.row.end(a)
a<-table.row.start(a)
a<-table.element(a, 'F-TEST (DF numerator)',1,TRUE)
a<-table.element(a, mysum$fstatistic[2])
a<-table.row.end(a)
a<-table.row.start(a)
a<-table.element(a, 'F-TEST (DF denominator)',1,TRUE)
a<-table.element(a, mysum$fstatistic[3])
a<-table.row.end(a)
a<-table.row.start(a)
a<-table.element(a, 'p-value',1,TRUE)
a<-table.element(a, 1-pf(mysum$fstatistic[1],mysum$fstatistic[2],mysum$fstatistic[3]))
a<-table.row.end(a)
a<-table.row.start(a)
a<-table.element(a, 'Multiple Linear Regression - Residual Statistics', 2, TRUE)
a<-table.row.end(a)
a<-table.row.start(a)
a<-table.element(a, 'Residual Standard Deviation',1,TRUE)
a<-table.element(a, mysum$sigma)
a<-table.row.end(a)
a<-table.row.start(a)
a<-table.element(a, 'Sum Squared Residuals',1,TRUE)
a<-table.element(a, sum(myerror*myerror))
a<-table.row.end(a)
a<-table.end(a)
table.save(a,file='mytable3.tab')
a<-table.start()
a<-table.row.start(a)
a<-table.element(a, 'Multiple Linear Regression - Actuals, Interpolation, and Residuals', 4, TRUE)
a<-table.row.end(a)
a<-table.row.start(a)
a<-table.element(a, 'Time or Index', 1, TRUE)
a<-table.element(a, 'Actuals', 1, TRUE)
a<-table.element(a, 'Interpolation
Forecast', 1, TRUE)
a<-table.element(a, 'Residuals
Prediction Error', 1, TRUE)
a<-table.row.end(a)
for (i in 1:n) {
a<-table.row.start(a)
a<-table.element(a,i, 1, TRUE)
a<-table.element(a,x[i])
a<-table.element(a,x[i]-mysum$resid[i])
a<-table.element(a,mysum$resid[i])
a<-table.row.end(a)
}
a<-table.end(a)
table.save(a,file='mytable4.tab')
if (n > n25) {
a<-table.start()
a<-table.row.start(a)
a<-table.element(a,'Goldfeld-Quandt test for Heteroskedasticity',4,TRUE)
a<-table.row.end(a)
a<-table.row.start(a)
a<-table.element(a,'p-values',header=TRUE)
a<-table.element(a,'Alternative Hypothesis',3,header=TRUE)
a<-table.row.end(a)
a<-table.row.start(a)
a<-table.element(a,'breakpoint index',header=TRUE)
a<-table.element(a,'greater',header=TRUE)
a<-table.element(a,'2-sided',header=TRUE)
a<-table.element(a,'less',header=TRUE)
a<-table.row.end(a)
for (mypoint in kp3:nmkm3) {
a<-table.row.start(a)
a<-table.element(a,mypoint,header=TRUE)
a<-table.element(a,gqarr[mypoint-kp3+1,1])
a<-table.element(a,gqarr[mypoint-kp3+1,2])
a<-table.element(a,gqarr[mypoint-kp3+1,3])
a<-table.row.end(a)
}
a<-table.end(a)
table.save(a,file='mytable5.tab')
a<-table.start()
a<-table.row.start(a)
a<-table.element(a,'Meta Analysis of Goldfeld-Quandt test for Heteroskedasticity',4,TRUE)
a<-table.row.end(a)
a<-table.row.start(a)
a<-table.element(a,'Description',header=TRUE)
a<-table.element(a,'# significant tests',header=TRUE)
a<-table.element(a,'% significant tests',header=TRUE)
a<-table.element(a,'OK/NOK',header=TRUE)
a<-table.row.end(a)
a<-table.row.start(a)
a<-table.element(a,'1% type I error level',header=TRUE)
a<-table.element(a,numsignificant1)
a<-table.element(a,numsignificant1/numgqtests)
if (numsignificant1/numgqtests < 0.01) dum <- 'OK' else dum <- 'NOK'
a<-table.element(a,dum)
a<-table.row.end(a)
a<-table.row.start(a)
a<-table.element(a,'5% type I error level',header=TRUE)
a<-table.element(a,numsignificant5)
a<-table.element(a,numsignificant5/numgqtests)
if (numsignificant5/numgqtests < 0.05) dum <- 'OK' else dum <- 'NOK'
a<-table.element(a,dum)
a<-table.row.end(a)
a<-table.row.start(a)
a<-table.element(a,'10% type I error level',header=TRUE)
a<-table.element(a,numsignificant10)
a<-table.element(a,numsignificant10/numgqtests)
if (numsignificant10/numgqtests < 0.1) dum <- 'OK' else dum <- 'NOK'
a<-table.element(a,dum)
a<-table.row.end(a)
a<-table.end(a)
table.save(a,file='mytable6.tab')
}