Free Statistics

of Irreproducible Research!

Author's title

Author*The author of this computation has been verified*
R Software Modulerwasp_smp.wasp
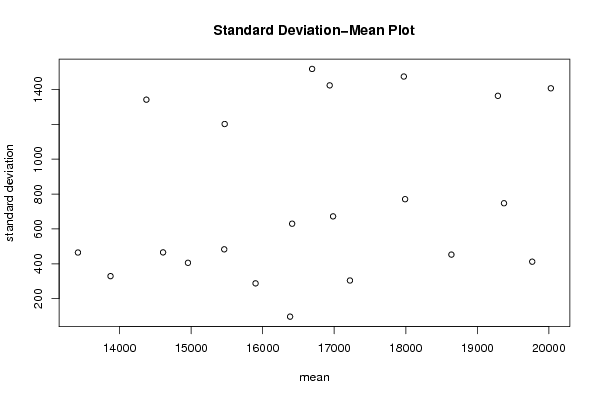
Title produced by softwareStandard Deviation-Mean Plot
Date of computationThu, 08 Dec 2011 12:07:26 -0500
Cite this page as followsStatistical Computations at FreeStatistics.org, Office for Research Development and Education, URL https://freestatistics.org/blog/index.php?v=date/2011/Dec/08/t1323364154f08x0b5htrzxmev.htm/, Retrieved Fri, 03 May 2024 14:12:43 +0000
Statistical Computations at FreeStatistics.org, Office for Research Development and Education, URL https://freestatistics.org/blog/index.php?pk=153057, Retrieved Fri, 03 May 2024 14:12:43 +0000
QR Codes:

Original text written by user:
IsPrivate?No (this computation is public)
User-defined keywords
Estimated Impact74
Family? (F = Feedback message, R = changed R code, M = changed R Module, P = changed Parameters, D = changed Data)
-       [Standard Deviation-Mean Plot] [Workshop 9] [2011-12-08 17:07:26] [02ed7fa8d7b1f39a2d911dce6cf09d8a] [Current]
Feedback Forum

Post a new message
Dataseries X:
13328
12873
14000
13477
14237
13674
13529
14058
12975
14326
14008
16193
14483
14011
15057
14884
15414
14440
14900
15074
14442
15307
14938
17193
15528
14765
15838
15723
16150
15486
15986
15983
15692
16490
15686
18897
16316
15636
17163
16534
16518
16375
16290
16352
15943
16362
16393
19051
16747
16320
17910
16961
17480
17049
16879
17473
16998
17307
17418
20169
17871
17226
19062
17804
19100
18522
18060
18869
18127
18871
18890
21263
19547
18450
20254
19240
20216
19420
19415
20018
18652
19978
19509
21971


Summary of computational transaction
Raw Inputview raw input (R code)
Raw Outputview raw output of R engine
Computing time1 seconds
R Server'George Udny Yule' @ yule.wessa.net

\begin{tabular}{lllllllll}
\hline
Summary of computational transaction \tabularnewline
Raw Input & view raw input (R code)  \tabularnewline
Raw Output & view raw output of R engine  \tabularnewline
Computing time & 1 seconds \tabularnewline
R Server & 'George Udny Yule' @ yule.wessa.net \tabularnewline
\hline
\end{tabular}
%Source: https://freestatistics.org/blog/index.php?pk=153057&T=0

[TABLE]
[ROW][C]Summary of computational transaction[/C][/ROW]
[ROW][C]Raw Input[/C][C]view raw input (R code) [/C][/ROW]
[ROW][C]Raw Output[/C][C]view raw output of R engine [/C][/ROW]
[ROW][C]Computing time[/C][C]1 seconds[/C][/ROW]
[ROW][C]R Server[/C][C]'George Udny Yule' @ yule.wessa.net[/C][/ROW]
[/TABLE]
Source: https://freestatistics.org/blog/index.php?pk=153057&T=0

Globally Unique Identifier (entire table): ba.freestatistics.org/blog/index.php?pk=153057&T=0

As an alternative you can also use a QR Code:  

The GUIDs for individual cells are displayed in the table below:

Summary of computational transaction
Raw Inputview raw input (R code)
Raw Outputview raw output of R engine
Computing time1 seconds
R Server'George Udny Yule' @ yule.wessa.net


Standard Deviation-Mean Plot
SectionMeanStandard DeviationRange
113419.5464.514441827881127
213874.5328.962510528682708
314375.51341.915670475113218
414608.75465.4061846029411046
514957405.411724875671974
6154701202.096224656472751
715463.5482.9261503239051073
815901.25287.619395498055664
916691.251518.207578034043211
1016412.25629.8880191483771527
1116383.7596.4308906246679228
1216937.251424.030986320173108
1316984.5672.0786164331271590
1417220.25303.935711404018601
15179731474.745401755843171
1617990.75770.634965466791836
1718637.75452.5279917677291040
1819287.751363.920666070183136
1919372.75747.4522838728011804
2019767.25411.87164262668801
2120027.51407.182172523043319

\begin{tabular}{lllllllll}
\hline
Standard Deviation-Mean Plot \tabularnewline
Section & Mean & Standard Deviation & Range \tabularnewline
1 & 13419.5 & 464.51444182788 & 1127 \tabularnewline
2 & 13874.5 & 328.962510528682 & 708 \tabularnewline
3 & 14375.5 & 1341.91567047511 & 3218 \tabularnewline
4 & 14608.75 & 465.406184602941 & 1046 \tabularnewline
5 & 14957 & 405.411724875671 & 974 \tabularnewline
6 & 15470 & 1202.09622465647 & 2751 \tabularnewline
7 & 15463.5 & 482.926150323905 & 1073 \tabularnewline
8 & 15901.25 & 287.619395498055 & 664 \tabularnewline
9 & 16691.25 & 1518.20757803404 & 3211 \tabularnewline
10 & 16412.25 & 629.888019148377 & 1527 \tabularnewline
11 & 16383.75 & 96.4308906246679 & 228 \tabularnewline
12 & 16937.25 & 1424.03098632017 & 3108 \tabularnewline
13 & 16984.5 & 672.078616433127 & 1590 \tabularnewline
14 & 17220.25 & 303.935711404018 & 601 \tabularnewline
15 & 17973 & 1474.74540175584 & 3171 \tabularnewline
16 & 17990.75 & 770.63496546679 & 1836 \tabularnewline
17 & 18637.75 & 452.527991767729 & 1040 \tabularnewline
18 & 19287.75 & 1363.92066607018 & 3136 \tabularnewline
19 & 19372.75 & 747.452283872801 & 1804 \tabularnewline
20 & 19767.25 & 411.87164262668 & 801 \tabularnewline
21 & 20027.5 & 1407.18217252304 & 3319 \tabularnewline
\hline
\end{tabular}
%Source: https://freestatistics.org/blog/index.php?pk=153057&T=1

[TABLE]
[ROW][C]Standard Deviation-Mean Plot[/C][/ROW]
[ROW][C]Section[/C][C]Mean[/C][C]Standard Deviation[/C][C]Range[/C][/ROW]
[ROW][C]1[/C][C]13419.5[/C][C]464.51444182788[/C][C]1127[/C][/ROW]
[ROW][C]2[/C][C]13874.5[/C][C]328.962510528682[/C][C]708[/C][/ROW]
[ROW][C]3[/C][C]14375.5[/C][C]1341.91567047511[/C][C]3218[/C][/ROW]
[ROW][C]4[/C][C]14608.75[/C][C]465.406184602941[/C][C]1046[/C][/ROW]
[ROW][C]5[/C][C]14957[/C][C]405.411724875671[/C][C]974[/C][/ROW]
[ROW][C]6[/C][C]15470[/C][C]1202.09622465647[/C][C]2751[/C][/ROW]
[ROW][C]7[/C][C]15463.5[/C][C]482.926150323905[/C][C]1073[/C][/ROW]
[ROW][C]8[/C][C]15901.25[/C][C]287.619395498055[/C][C]664[/C][/ROW]
[ROW][C]9[/C][C]16691.25[/C][C]1518.20757803404[/C][C]3211[/C][/ROW]
[ROW][C]10[/C][C]16412.25[/C][C]629.888019148377[/C][C]1527[/C][/ROW]
[ROW][C]11[/C][C]16383.75[/C][C]96.4308906246679[/C][C]228[/C][/ROW]
[ROW][C]12[/C][C]16937.25[/C][C]1424.03098632017[/C][C]3108[/C][/ROW]
[ROW][C]13[/C][C]16984.5[/C][C]672.078616433127[/C][C]1590[/C][/ROW]
[ROW][C]14[/C][C]17220.25[/C][C]303.935711404018[/C][C]601[/C][/ROW]
[ROW][C]15[/C][C]17973[/C][C]1474.74540175584[/C][C]3171[/C][/ROW]
[ROW][C]16[/C][C]17990.75[/C][C]770.63496546679[/C][C]1836[/C][/ROW]
[ROW][C]17[/C][C]18637.75[/C][C]452.527991767729[/C][C]1040[/C][/ROW]
[ROW][C]18[/C][C]19287.75[/C][C]1363.92066607018[/C][C]3136[/C][/ROW]
[ROW][C]19[/C][C]19372.75[/C][C]747.452283872801[/C][C]1804[/C][/ROW]
[ROW][C]20[/C][C]19767.25[/C][C]411.87164262668[/C][C]801[/C][/ROW]
[ROW][C]21[/C][C]20027.5[/C][C]1407.18217252304[/C][C]3319[/C][/ROW]
[/TABLE]
Source: https://freestatistics.org/blog/index.php?pk=153057&T=1

Globally Unique Identifier (entire table): ba.freestatistics.org/blog/index.php?pk=153057&T=1

As an alternative you can also use a QR Code:  

The GUIDs for individual cells are displayed in the table below:

Standard Deviation-Mean Plot
SectionMeanStandard DeviationRange
113419.5464.514441827881127
213874.5328.962510528682708
314375.51341.915670475113218
414608.75465.4061846029411046
514957405.411724875671974
6154701202.096224656472751
715463.5482.9261503239051073
815901.25287.619395498055664
916691.251518.207578034043211
1016412.25629.8880191483771527
1116383.7596.4308906246679228
1216937.251424.030986320173108
1316984.5672.0786164331271590
1417220.25303.935711404018601
15179731474.745401755843171
1617990.75770.634965466791836
1718637.75452.5279917677291040
1819287.751363.920666070183136
1919372.75747.4522838728011804
2019767.25411.87164262668801
2120027.51407.182172523043319


Regression: S.E.(k) = alpha + beta * Mean(k)
alpha-378.887330636969
beta0.0688215500864592
S.D.0.0532083283096434
T-STAT1.29343567582043
p-value0.21136530532548

\begin{tabular}{lllllllll}
\hline
Regression: S.E.(k) = alpha + beta * Mean(k) \tabularnewline
alpha & -378.887330636969 \tabularnewline
beta & 0.0688215500864592 \tabularnewline
S.D. & 0.0532083283096434 \tabularnewline
T-STAT & 1.29343567582043 \tabularnewline
p-value & 0.21136530532548 \tabularnewline
\hline
\end{tabular}
%Source: https://freestatistics.org/blog/index.php?pk=153057&T=2

[TABLE]
[ROW][C]Regression: S.E.(k) = alpha + beta * Mean(k)[/C][/ROW]
[ROW][C]alpha[/C][C]-378.887330636969[/C][/ROW]
[ROW][C]beta[/C][C]0.0688215500864592[/C][/ROW]
[ROW][C]S.D.[/C][C]0.0532083283096434[/C][/ROW]
[ROW][C]T-STAT[/C][C]1.29343567582043[/C][/ROW]
[ROW][C]p-value[/C][C]0.21136530532548[/C][/ROW]
[/TABLE]
Source: https://freestatistics.org/blog/index.php?pk=153057&T=2

Globally Unique Identifier (entire table): ba.freestatistics.org/blog/index.php?pk=153057&T=2

As an alternative you can also use a QR Code:  

The GUIDs for individual cells are displayed in the table below:

Regression: S.E.(k) = alpha + beta * Mean(k)
alpha-378.887330636969
beta0.0688215500864592
S.D.0.0532083283096434
T-STAT1.29343567582043
p-value0.21136530532548


Regression: ln S.E.(k) = alpha + beta * ln Mean(k)
alpha-9.28441604214621
beta1.61766659238312
S.D.1.3462112446895
T-STAT1.20164394612246
p-value0.244266017597795
Lambda-0.61766659238312

\begin{tabular}{lllllllll}
\hline
Regression: ln S.E.(k) = alpha + beta * ln Mean(k) \tabularnewline
alpha & -9.28441604214621 \tabularnewline
beta & 1.61766659238312 \tabularnewline
S.D. & 1.3462112446895 \tabularnewline
T-STAT & 1.20164394612246 \tabularnewline
p-value & 0.244266017597795 \tabularnewline
Lambda & -0.61766659238312 \tabularnewline
\hline
\end{tabular}
%Source: https://freestatistics.org/blog/index.php?pk=153057&T=3

[TABLE]
[ROW][C]Regression: ln S.E.(k) = alpha + beta * ln Mean(k)[/C][/ROW]
[ROW][C]alpha[/C][C]-9.28441604214621[/C][/ROW]
[ROW][C]beta[/C][C]1.61766659238312[/C][/ROW]
[ROW][C]S.D.[/C][C]1.3462112446895[/C][/ROW]
[ROW][C]T-STAT[/C][C]1.20164394612246[/C][/ROW]
[ROW][C]p-value[/C][C]0.244266017597795[/C][/ROW]
[ROW][C]Lambda[/C][C]-0.61766659238312[/C][/ROW]
[/TABLE]
Source: https://freestatistics.org/blog/index.php?pk=153057&T=3

Globally Unique Identifier (entire table): ba.freestatistics.org/blog/index.php?pk=153057&T=3

As an alternative you can also use a QR Code:  

The GUIDs for individual cells are displayed in the table below:

Regression: ln S.E.(k) = alpha + beta * ln Mean(k)
alpha-9.28441604214621
beta1.61766659238312
S.D.1.3462112446895
T-STAT1.20164394612246
p-value0.244266017597795
Lambda-0.61766659238312


Parameters (Session):
par1 = 4 ;
Parameters (R input):
par1 = 4 ;
R code (references can be found in the software module):
par1 <- as.numeric(par1)
(n <- length(x))
(np <- floor(n / par1))
arr <- array(NA,dim=c(par1,np))
j <- 0
k <- 1
for (i in 1:(np*par1))
{
j = j + 1
arr[j,k] <- x[i]
if (j == par1) {
j = 0
k=k+1
}
}
arr
arr.mean <- array(NA,dim=np)
arr.sd <- array(NA,dim=np)
arr.range <- array(NA,dim=np)
for (j in 1:np)
{
arr.mean[j] <- mean(arr[,j],na.rm=TRUE)
arr.sd[j] <- sd(arr[,j],na.rm=TRUE)
arr.range[j] <- max(arr[,j],na.rm=TRUE) - min(arr[,j],na.rm=TRUE)
}
arr.mean
arr.sd
arr.range
(lm1 <- lm(arr.sd~arr.mean))
(lnlm1 <- lm(log(arr.sd)~log(arr.mean)))
(lm2 <- lm(arr.range~arr.mean))
bitmap(file='test1.png')
plot(arr.mean,arr.sd,main='Standard Deviation-Mean Plot',xlab='mean',ylab='standard deviation')
dev.off()
bitmap(file='test2.png')
plot(arr.mean,arr.range,main='Range-Mean Plot',xlab='mean',ylab='range')
dev.off()
load(file='createtable')
a<-table.start()
a<-table.row.start(a)
a<-table.element(a,'Standard Deviation-Mean Plot',4,TRUE)
a<-table.row.end(a)
a<-table.row.start(a)
a<-table.element(a,'Section',header=TRUE)
a<-table.element(a,'Mean',header=TRUE)
a<-table.element(a,'Standard Deviation',header=TRUE)
a<-table.element(a,'Range',header=TRUE)
a<-table.row.end(a)
for (j in 1:np) {
a<-table.row.start(a)
a<-table.element(a,j,header=TRUE)
a<-table.element(a,arr.mean[j])
a<-table.element(a,arr.sd[j] )
a<-table.element(a,arr.range[j] )
a<-table.row.end(a)
}
a<-table.end(a)
table.save(a,file='mytable.tab')
a<-table.start()
a<-table.row.start(a)
a<-table.element(a,'Regression: S.E.(k) = alpha + beta * Mean(k)',2,TRUE)
a<-table.row.end(a)
a<-table.row.start(a)
a<-table.element(a,'alpha',header=TRUE)
a<-table.element(a,lm1$coefficients[[1]])
a<-table.row.end(a)
a<-table.row.start(a)
a<-table.element(a,'beta',header=TRUE)
a<-table.element(a,lm1$coefficients[[2]])
a<-table.row.end(a)
a<-table.row.start(a)
a<-table.element(a,'S.D.',header=TRUE)
a<-table.element(a,summary(lm1)$coefficients[2,2])
a<-table.row.end(a)
a<-table.row.start(a)
a<-table.element(a,'T-STAT',header=TRUE)
a<-table.element(a,summary(lm1)$coefficients[2,3])
a<-table.row.end(a)
a<-table.row.start(a)
a<-table.element(a,'p-value',header=TRUE)
a<-table.element(a,summary(lm1)$coefficients[2,4])
a<-table.row.end(a)
a<-table.end(a)
table.save(a,file='mytable1.tab')
a<-table.start()
a<-table.row.start(a)
a<-table.element(a,'Regression: ln S.E.(k) = alpha + beta * ln Mean(k)',2,TRUE)
a<-table.row.end(a)
a<-table.row.start(a)
a<-table.element(a,'alpha',header=TRUE)
a<-table.element(a,lnlm1$coefficients[[1]])
a<-table.row.end(a)
a<-table.row.start(a)
a<-table.element(a,'beta',header=TRUE)
a<-table.element(a,lnlm1$coefficients[[2]])
a<-table.row.end(a)
a<-table.row.start(a)
a<-table.element(a,'S.D.',header=TRUE)
a<-table.element(a,summary(lnlm1)$coefficients[2,2])
a<-table.row.end(a)
a<-table.row.start(a)
a<-table.element(a,'T-STAT',header=TRUE)
a<-table.element(a,summary(lnlm1)$coefficients[2,3])
a<-table.row.end(a)
a<-table.row.start(a)
a<-table.element(a,'p-value',header=TRUE)
a<-table.element(a,summary(lnlm1)$coefficients[2,4])
a<-table.row.end(a)
a<-table.row.start(a)
a<-table.element(a,'Lambda',header=TRUE)
a<-table.element(a,1-lnlm1$coefficients[[2]])
a<-table.row.end(a)
a<-table.end(a)
table.save(a,file='mytable2.tab')